The gradient in gray matter thickness across auditory cortex and differential cortical thickness changes following perinatal deafness
- PMID: 36482814
- PMCID: PMC10183739
- DOI: 10.1093/cercor/bhac463
The gradient in gray matter thickness across auditory cortex and differential cortical thickness changes following perinatal deafness
Abstract
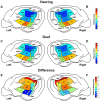
In the absence of hearing during development, the brain adapts and repurposes what was destined to become auditory cortex. As cortical thickness is commonly used as a proxy to identify cortical regions that have undergone plastic changes, the purpose of this investigation was to compare cortical thickness patterns between hearing and deaf cats. In this study, normal hearing (n = 29) and deaf (n = 26) cats were scanned to examine cortical thickness in hearing controls, as well as differential changes in thickness as a consequence of deafness. In hearing cats, a gradient in cortical thickness was identified across auditory cortex in which it is thinner in more dorsal regions and thicker in more ventral regions. Compared with hearing controls, differential thickening and thinning was observed in specific regions of deaf auditory cortex. More dorsal regions were found to be bilaterally thicker in the deaf group, while more ventral regions in the left hemisphere were thinner. The location and nature of these changes creates a gradient along the dorsoventral axis, wherein dorsal auditory cortical fields are thicker, whereas more ventral fields are thinner in deaf animals compared with hearing controls.
Keywords: MRI; cat; cortical thickness; gray matter; plasticity.
© The Author(s) 2022. Published by Oxford University Press. All rights reserved. For permissions, please e-mail: journals.permissions@oup.com.
Figures


 ) indicate significant decreased thicknesses in the deaf group and red upward pointing arrows (
 ) indicate increased thickness. Data presented as mean + SEM. ^P < 0.05, ^^P < 0.01 between the hearing and deaf conditions.

Similar articles
-
Modified Origins of Cortical Projections to the Superior Colliculus in the Deaf: Dispersion of Auditory Efferents.J Neurosci. 2018 Apr 18;38(16):4048-4058. doi: 10.1523/JNEUROSCI.2858-17.2018. Epub 2018 Apr 2. J Neurosci. 2018. PMID: 29610441 Free PMC article.
-
Origin of the thalamic projection to dorsal auditory cortex in hearing and deafness.Hear Res. 2017 Jan;343:108-117. doi: 10.1016/j.heares.2016.05.013. Epub 2016 Jun 2. Hear Res. 2017. PMID: 27262449
-
Neuroplastic changes in functional wiring in sensory cortices of the congenitally deaf: A network analysis.Hum Brain Mapp. 2023 Dec 15;44(18):6523-6536. doi: 10.1002/hbm.26530. Epub 2023 Nov 13. Hum Brain Mapp. 2023. PMID: 37956260 Free PMC article.
-
Review article: Structural brain alterations in prelingually deaf.Neuroimage. 2020 Oct 15;220:117042. doi: 10.1016/j.neuroimage.2020.117042. Epub 2020 Jun 10. Neuroimage. 2020. PMID: 32534128 Review.
-
Use it or lose it? Lessons learned from the developing brains of children who are deaf and use cochlear implants to hear.Brain Topogr. 2011 Oct;24(3-4):204-19. doi: 10.1007/s10548-011-0181-2. Epub 2011 Apr 11. Brain Topogr. 2011. PMID: 21479928 Review.
Cited by
-
Cortical thickness differences between hearing and perinatally deaf cats using ultra-high field MRI.Neuroimage Rep. 2024 Jul 3;4(3):100213. doi: 10.1016/j.ynirp.2024.100213. eCollection 2024 Sep. Neuroimage Rep. 2024. PMID: 40568573 Free PMC article.
-
Regional gray matter thickness correlations of the hearing and deaf feline brains.Neuroimage Rep. 2025 Feb 8;5(1):100239. doi: 10.1016/j.ynirp.2025.100239. eCollection 2025 Mar. Neuroimage Rep. 2025. PMID: 40567891 Free PMC article.
References
-
- Benjamini Y, Hochberg Y. Controlling the false discovery rate: a practical and powerful approach to multiple testing. J R Stat Soc. 1995:57(1):289–300.
-
- Brown TA, Joanisse MF, Gati JS, Hughes SM, Nixon PL, Menon RS, Lomber SG. Characterization of the blood-oxygen level-dependent (BOLD) response in cat auditory cortex using high-field fMRI. NeuroImage. 2013:64:458–465. - PubMed
Publication types
MeSH terms
LinkOut - more resources
Full Text Sources
Medical
Research Materials
Miscellaneous

