. 2023 Feb;75(2):279-292.
doi: 10.1002/art.42319. Epub 2022 Dec 8.

Nuclear Receptor Subfamily 4A Signaling as a Key Disease Pathway of CD1c+ Dendritic Cell Dysregulation in Systemic Sclerosis

Affiliations

Nuclear Receptor Subfamily 4A Signaling as a Key Disease Pathway of CD1c+ Dendritic Cell Dysregulation in Systemic Sclerosis

Nila H Servaas et al. Arthritis Rheumatol. 2023 Feb.

Abstract

Objective: This study was undertaken to identify key disease pathways driving conventional dendritic cell (cDC) alterations in systemic sclerosis (SSc).

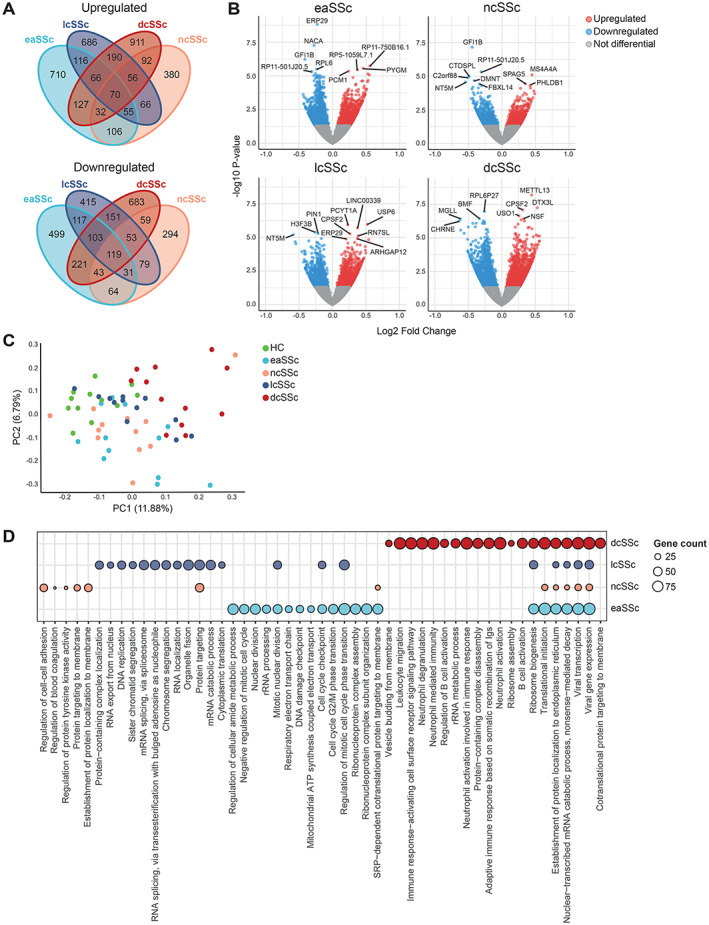
Methods: Transcriptomic profiling was performed on peripheral blood CD1c+ cDCs (cDC2s) isolated from 12 healthy donors and 48 patients with SSc, including all major disease subtypes. We performed differential expression analysis for the different SSc subtypes and healthy donors to uncover genes dysregulated in SSc. To identify biologically relevant pathways, we built a gene coexpression network using weighted gene correlation network analysis. We validated the role of key transcriptional regulators using chromatin immunoprecipitation (ChIP) sequencing and in vitro functional assays.

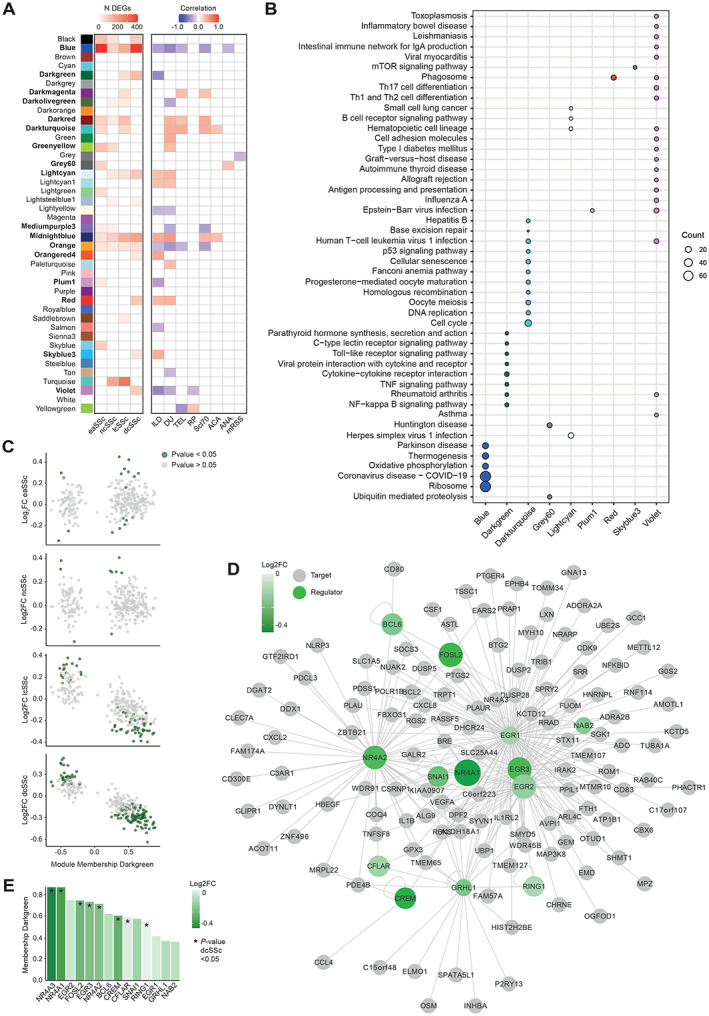
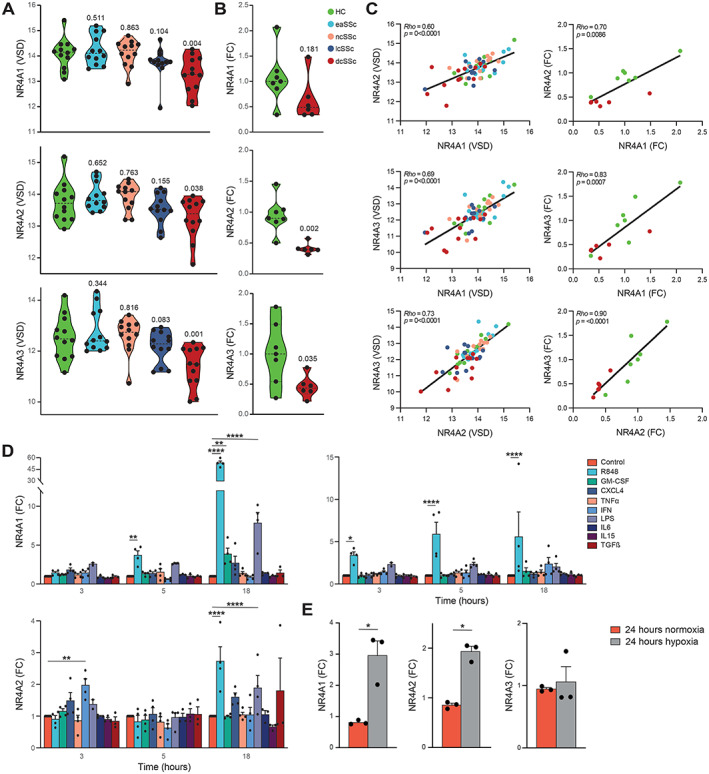
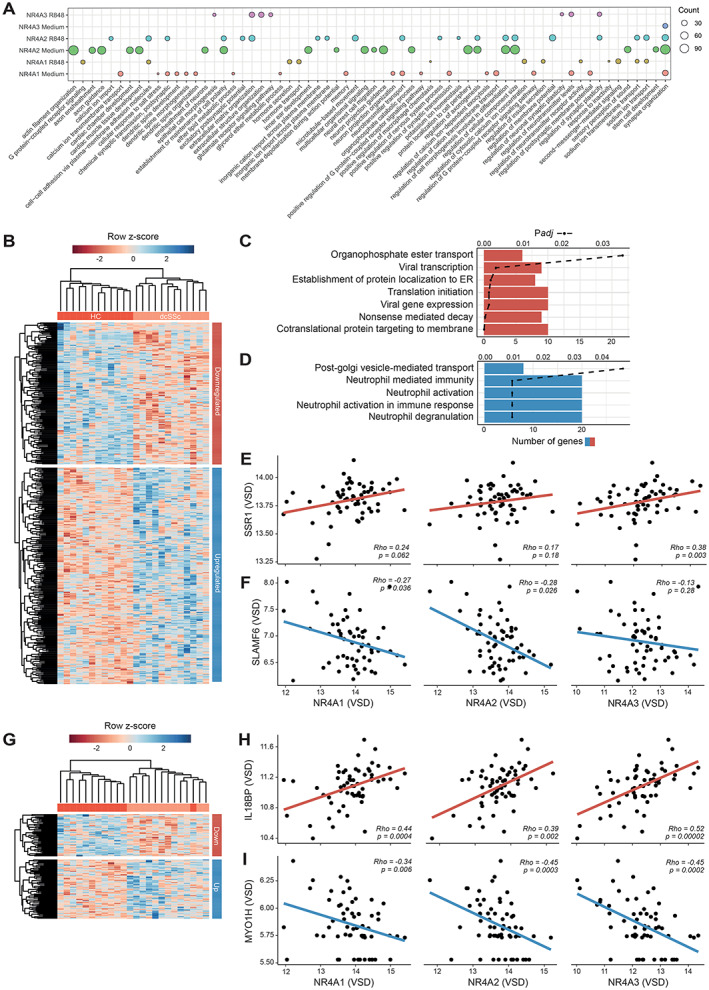
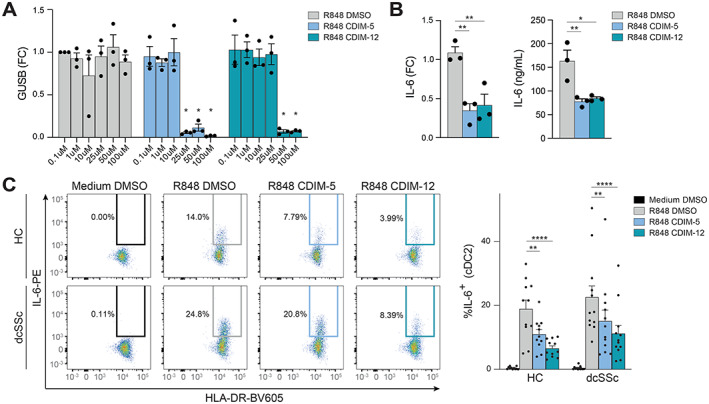
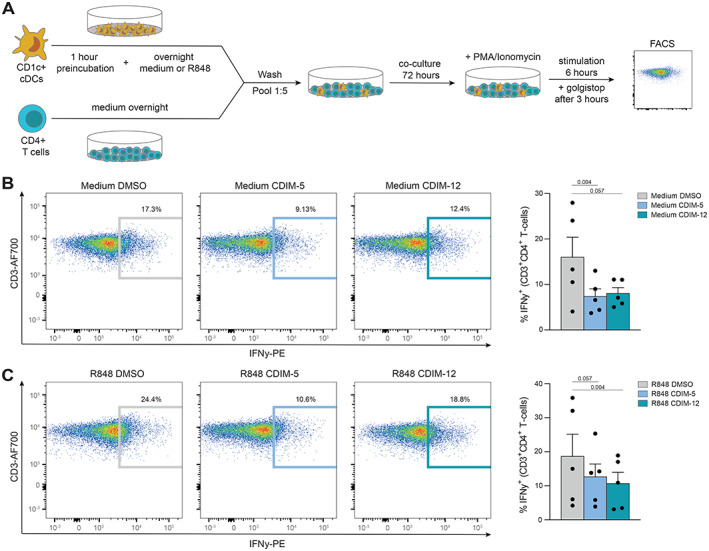
Results: We identified 17 modules of coexpressed genes in cDCs that correlated with SSc subtypes and key clinical traits, including autoantibodies, skin score, and occurrence of interstitial lung disease. A module of immunoregulatory genes was markedly down-regulated in patients with the diffuse SSc subtype characterized by severe fibrosis. Transcriptional regulatory network analysis performed on this module predicted nuclear receptor 4A (NR4A) subfamily genes (NR4A1, NR4A2, NR4A3) as the key transcriptional regulators of inflammation. Indeed, ChIP-sequencing analysis indicated that these NR4A members target numerous differentially expressed genes in SSc cDC2s. Inclusion of NR4A receptor agonists in culture-based experiments provided functional proof that dysregulation of NR4As affects cytokine production by cDC2s and modulates downstream T cell activation.

Conclusion: NR4A1, NR4A2, and NR4A3 are important regulators of immunosuppressive and fibrosis-associated pathways in SSc cDCs. Thus, the NR4A family represents novel potential targets to restore cDC homeostasis in SSc.


Figures

Figure 1
Figure 1
CD1c + conventional dendritic cells (cDC2s) from patients with systemic sclerosis (SSc) showing distinct transcriptomic profiles compared with cDC2s from healthy controls. A, Number of differentially expressed genes (DEGs) (P < 0.05) identified in cDC2s from different SSc subsets versus healthy controls. B, Volcano plots highlighting transcriptional differences between different SSc subsets and healthy controls (HC). Blue dots represent significantly down‐regulated genes (P < 0.05, log2 fold change <0), and red dots represent significantly up‐regulated genes (P < 0.05, log2 fold change >0). Top DEGs based on P value are indicated. C, Principal component (PC) analysis of the DEGs from all comparisons of SSc patients versus healthy controls. D, Pathway enrichment analysis of DEGs identified in SSc patients versus healthy controls. Circle size denotes DEG count associated with enriched pathways. When available, the top 10 pathways are shown (Benjamini and Hochberg–corrected P < 0.05). eaSSc = early SSc; ncSSc = noncutaneous SSc; lcSSc = limited SSc; dcSSc = diffuse SSc.
Figure 2
Figure 2
Coexpression network analysis identifying nuclear receptor 4A family members (NR4As) as regulators of immune‐regulatory pathways decreased in SSc cDC2s. A, Overall number of DEGs with coexpression modules (left) and the correlation of module eigengenes (Mes) to SSc clinical traits (right), with intensity bar highlighting significant enrichments (P < 0.05 by Fisher's exact test) and significant correlations with clinical traits (P < 0.05 by Pearson's chi‐square test). B, KEGG enrichment of relevant modules, with circle size denoting number of module genes associated with enriched pathways. When available, the top 10 pathways are shown (Benjamini and Hochberg–corrected P < 0.05). C, Module membership and log2 fold change (FC) (healthy control versus SSc subsets) for genes in the dark green module (immune cell regulation module) indicated in A. DEGs are highlighted in green (P < 0.05). D, Transcription factor network for the dark green module indicated in A. Transcriptional regulators are connected to their targets based on interactions from REGNET and TRRUST. Green shading intensity bar indicates log2 FC between dcSSc and healthy cDC2s. Circle size denotes module membership in the dark green module. E, Level of membership in the dark green module based on log2 FC between HC and dcSSc, as indicated in the intensity bar, of transcriptional regulators. ILD = interstitial lung disease; DU = digital ulcers; TEL = telangiectasia; RP = Raynaud's phenomenon; ACA = anticentromere antibodies; ANA = antinuclear antibodies; mRSS = modified Rodnan skin thickness score; mTOR = mechanistic target of rapamycin; TNF = tumor necrosis factor (see Figure 1 for other definitions).
Figure 3
Figure 3
Characterization of expression of nuclear receptor 4A family members (NR4As) in cDC2s from SSc patients and healthy controls. A, Variance‐stabilized data (VSD) results comparing expression of NR4As in the SSc patient groups versus HC group from the RNA‐sequencing cohort (dashed lines indicate mean). Indicated P values comparing SSc patients with HCs were calculated using Wald's test implemented in DESeq2. B, Log2 fold change (FC) in expression of NR4As in representative samples from dcSSc patients compared to HCs in the validation cohort as measured by target‐specific reverse transcription–quantitative polymerase chain reaction. Indicated P values were calculated using Kruskal‐Wallis with Dunn's post hoc test. C, Correlations (regression lines) of expression among NR4As in the RNA‐sequencing cohort (left) and the validation cohort (right). Correlations were calculated using Spearman's rank correlation coefficient (rho). D, Fold change in expression of NR4As in cDC2s from HCs after stimulation for 3, 5, or 18 hours with Toll‐like receptor ligands and cytokines implicated in DC biology and SSc pathogenesis. E, Fold change in expression of NR4As in cDC2s from HCs cultured in normoxic or hypoxic conditions. Symbols in D and E represent individual experiments; bars show the mean ± SEM. * = P < 0.05; ** = P < 0.01; *** = P < 0.001; **** = P < 0.0001, by 2‐way analysis of variance with Dunnett's post hoc test for multiple comparisons of stimulated samples versus their own time point controls (D) or by paired‐sample t‐test (E). GM‐CSF = granulocyte–macrophage colony‐stimulating factor; IFN = interferon; LPS = lipopolysaccharide; TGFβ = transforming growth factor β (see Figure 1 for other definitions).
Figure 4
Figure 4
Chromatin immunoprecipitation (ChIP) sequencing of transcriptional regulation of cDC2s by nuclear receptor 4A family members (NR4As). A, Gene Ontology–term enrichment of genes that show NR4A binding within their promoter region. Circle size denotes number of genes associated with enriched biologic processes. Top 20 genes are shown (Benjamini and Hochberg–corrected P < 0.05). B, Heatmap of DEGs in dcSSc that display binding of NR4As at their promoters in resting cDC2s. C and D, Pathway enrichment of genes down‐regulated (C) and up‐regulated (D) in dcSSc with NR4A binding at their gene promoters in resting cDC2s. Bars depict the number of genes identified within the enriched pathway, and dashed lines indicate Benjamini and Hochberg–corrected P value. E and F, Scatterplots showing correlations between expression in NR4As and SSR1 (E) or SLAMF6 (F), calculated using Spearman's rank correlation coefficient. G, Heatmap of DEGs in dcSSc that display binding of NR4As at their promoters in stimulated cDC2s. H and I, Scatterplots showing correlations between expression of NR4As and IL18BP (H) or MYOH1 (I). In scatterplots (E, F, H, I), red regression lines (or “line of best fit”) indicate positive correlations and blue regression lines indicate negative correlations. ER = endoplasmic reticulum; VSD = variance‐stabilized data (see Figure 1 for other definitions).
Figure 5
Figure 5
Nuclear receptor 4A (NR4A) activation leads to a decrease in the production of interleukin‐6 (IL‐6) in healthy control cDC2s and dcSSc cDC2s. A, Reverse transcription–quantitative polymerase chain reaction of GUSB mRNA expression by freshly isolated cDC2s after preincubation with increasing concentrations of DMSO (negative control) or NR4A agonists C‐DIM5 and C‐DIM12, followed by overnight stimulation with R‐848. Results are shown as fold change (FC) compared with 0.1 μM DMSO. * = P < 0.05, by 2‐way analysis of variance (ANOVA) with Dunnett's post hoc test comparing treated samples versus DMSO control with matching concentrations. B, IL‐6 mRNA (left) and protein expression (right) in cDC2s pretreated with 10 μM DMSO, C‐DIM5, or C‐DIM12, followed by overnight stimulation with R‐848. Relative mRNA expression levels (FC) are normalized to GUSB housekeeping levels. * = P < 0.05; ** = P < 0.01, by 1‐way ANOVA followed by Friedman's test for multiple comparisons. C, Left, Representative flow cytometry plots of percentage of IL‐6–positive cells within the cDC2 fraction in peripheral blood mononuclear cell cultures pretreated with 10 μM DMSO, C‐DIM5, or C‐DIM12, followed by overnight stimulation with R‐848. Right, Quantification of flow cytometry data. Symbols represent individual experiments; bars show the mean ± SEM. ** = P < 0.01; **** = P < 0.001, by 2‐way ANOVA with Dunnett's post hoc test. See Figure 1 for definitions.
Figure 6
Figure 6
Nuclear receptor 4A (NR4A) activation leads to decreased CD4+ T cell activation by cDC2s. A, Schematic overview of the coculture setup of freshly isolated autologous CD4+ T cells and cDC2s. B and C, Representative flow cytometry plots of the percentage of interferon‐γ (IFNγ)–positive T cells within the CD4+ T cell fraction after 3 days of coculture with cDC2s pretreated with 10 μM DMSO, C‐DIM5, or C‐DIM12, followed by overnight culture in medium (B) or overnight stimulation with R‐848 (C). Symbols in B and C represent individual experiments; bars show the mean ± SEM. Indicated P values, comparing C‐DIM5 or C‐DIM12 versus DMSO treatment, were calculated by one‐way analysis of variance followed by Friedman's test for multiple comparisons. PMA = phorbol myristate acetate; FACS = fluorescence‐activated cell sorting; PE = phycoerythrin (see Figure 1 for other definitions).

References

    1. Gabrielli A, Avvedimento EV, Krieg T. Scleroderma. N Engl J Med 2009;360:1989–2003. - PubMed
    1. Van den Hoogen F, Khanna D, Fransen J, et al. 2013 classification criteria for systemic sclerosis: an American College of Rheumatology/European League against Rheumatism collaborative initiative. Arthritis Rheum 2013;65:2737–47. - PMC - PubMed
    1. LeRoy EC, Medsger TA. Criteria for the classification of early systemic sclerosis. J Rheumatol 2001;28:1573–6. - PubMed
    1. Guiducci S, Giacomelli R, Cerinic MM. Vascular complications of scleroderma. Autoimmun Rev 2007;6:520–3. - PubMed
    1. Cutolo M, Soldano S, Smith V. Pathophysiology of systemic sclerosis: current understanding and new insights. Expert Rev Clin Immunol 2019;15:753–64. - PubMed

Publication types

MeSH terms