

Comparison of detection methods and genome quality when quantifying nuclear mitochondrial insertions in vertebrate genomes
- PMID: 36482890
- PMCID: PMC9723244
- DOI: 10.3389/fgene.2022.984513
Comparison of detection methods and genome quality when quantifying nuclear mitochondrial insertions in vertebrate genomes
Abstract
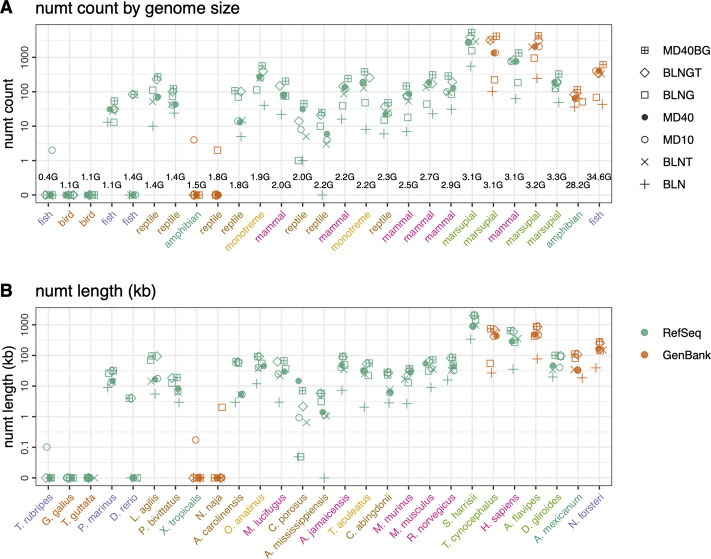
The integration of mitochondrial genome fragments into the nuclear genome is well documented, and the transfer of these mitochondrial nuclear pseudogenes (numts) is thought to be an ongoing evolutionary process. With the increasing number of eukaryotic genomes available, genome-wide distributions of numts are often surveyed. However, inconsistencies in genome quality can reduce the accuracy of numt estimates, and methods used for identification can be complicated by the diverse sizes and ages of numts. Numts have been previously characterized in rodent genomes and it was postulated that they might be more prevalent in a group of voles with rapidly evolving karyotypes. Here, we examine 37 rodent genomes, and an additional 26 vertebrate genomes, while also considering numt detection methods. We identify numts using DNA:DNA and protein:translated-DNA similarity searches and compare numt distributions among rodent and vertebrate taxa to assess whether some groups are more susceptible to transfer. A combination of protein sequence comparisons (protein:translated-DNA) and BLASTN genomic DNA searches detect 50% more numts than genomic DNA:DNA searches alone. In addition, higher-quality RefSeq genomes produce lower estimates of numts than GenBank genomes, suggesting that lower quality genome assemblies can overestimate numts abundance. Phylogenetic analysis shows that mitochondrial transfers are not associated with karyotypic diversity among rodents. Surprisingly, we did not find a strong correlation between numt counts and genome size. Estimates using DNA: DNA analyses can underestimate the amount of mitochondrial DNA that is transferred to the nucleus.
Keywords: BLASTN; Microtus; NUMT; TFASTX; karyotypic diversity; rodents; scoring matrix.
Copyright © 2022 Triant and Pearson.
Conflict of interest statement
The authors declare that the research was conducted in the absence of any commercial or financial relationships that could be construed as a potential conflict of interest.
Figures


Similar articles
-
Extensive mitochondrial DNA transfer in a rapidly evolving rodent has been mediated by independent insertion events and by duplications.Gene. 2007 Oct 15;401(1-2):61-70. doi: 10.1016/j.gene.2007.07.003. Epub 2007 Jul 14. Gene. 2007. PMID: 17714890
-
Genomic landscape of mitochondrial DNA insertions in 23 bat genomes: characteristics, loci, phylogeny, and polymorphism.Integr Zool. 2022 Sep;17(5):890-903. doi: 10.1111/1749-4877.12582. Epub 2021 Sep 29. Integr Zool. 2022. PMID: 34496458
-
Mitochondrial pseudogenes in the nuclear genome of Aedes aegypti mosquitoes: implications for past and future population genetic studies.BMC Genet. 2009 Mar 6;10:11. doi: 10.1186/1471-2156-10-11. BMC Genet. 2009. PMID: 19267896 Free PMC article.
-
The Mighty NUMT: Mitochondrial DNA Flexing Its Code in the Nuclear Genome.Biomolecules. 2023 Apr 27;13(5):753. doi: 10.3390/biom13050753. Biomolecules. 2023. PMID: 37238623 Free PMC article. Review.
-
Insertions of mitochondrial DNA into the nucleus-effects and role in cell evolution.Genome. 2020 Aug;63(8):365-374. doi: 10.1139/gen-2019-0151. Epub 2020 May 12. Genome. 2020. PMID: 32396758 Review.
Cited by
-
Repeat-Rich Regions Cause False-Positive Detection of NUMTs: A Case Study in Amphibians Using an Improved Cane Toad Reference Genome.Genome Biol Evol. 2024 Nov 1;16(11):evae246. doi: 10.1093/gbe/evae246. Genome Biol Evol. 2024. PMID: 39548850 Free PMC article.
-
Numerous insertions of mitochondrial DNA in the genome of the northern mole vole, Ellobius talpinus.Mol Biol Rep. 2023 Dec 29;51(1):36. doi: 10.1007/s11033-023-08913-4. Mol Biol Rep. 2023. PMID: 38157080 Free PMC article.
-
Mitochondrial genome plasticity of mammalian species.BMC Genomics. 2024 Mar 14;25(1):278. doi: 10.1186/s12864-024-10201-9. BMC Genomics. 2024. PMID: 38486136 Free PMC article.
References
LinkOut - more resources
Full Text Sources