[Preprint]. 2022 Dec 1:2022.12.01.518643.
doi: 10.1101/2022.12.01.518643.

Immunopeptidome profiling of human coronavirus OC43-infected cells identifies CD4 T cell epitopes specific to seasonal coronaviruses or cross-reactive with SARS-CoV-2

Affiliations

Immunopeptidome profiling of human coronavirus OC43-infected cells identifies CD4 T cell epitopes specific to seasonal coronaviruses or cross-reactive with SARS-CoV-2

Aniuska Becerra-Artiles et al. bioRxiv. .

Update in

Abstract

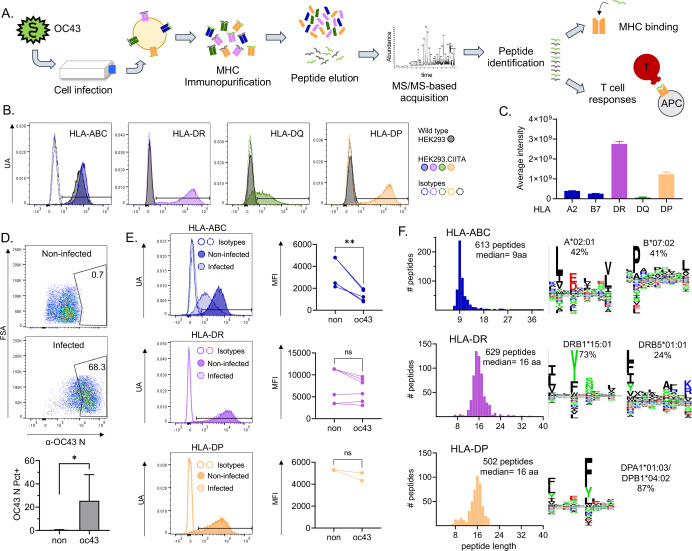
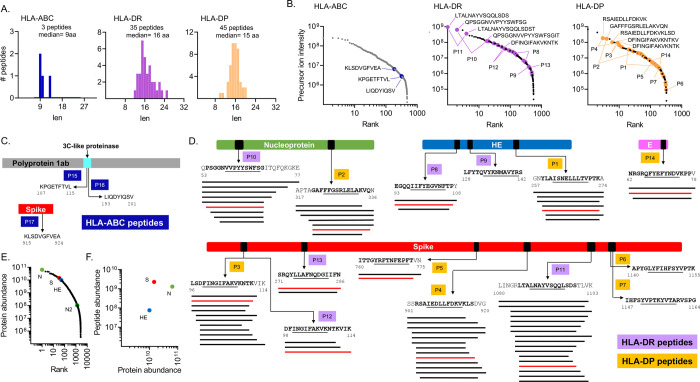
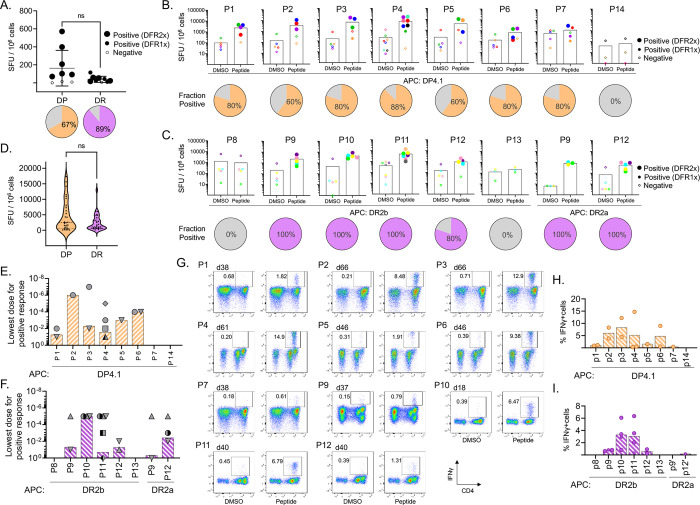
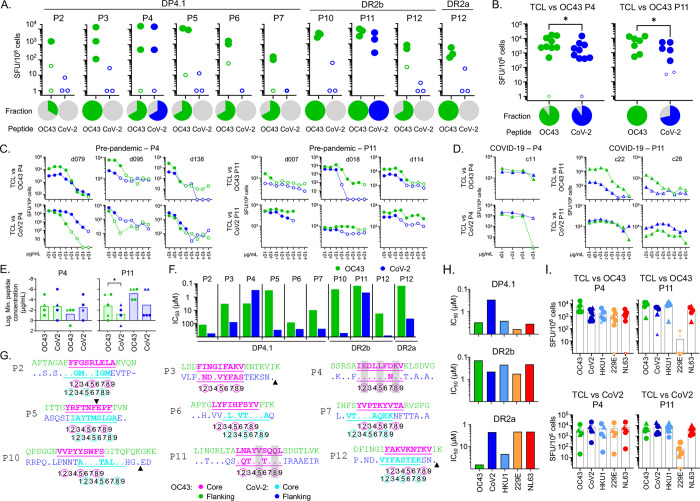
Seasonal "common-cold" human coronaviruses are widely spread throughout the world and are mainly associated with mild upper respiratory tract infections. The emergence of highly pathogenic coronaviruses MERS-CoV, SARS-CoV, and most recently SARS-CoV-2 has prompted increased attention to coronavirus biology and immunopathology, but identification and characterization of the T cell response to seasonal human coronaviruses remain largely uncharacterized. Here we report the repertoire of viral peptides that are naturally processed and presented upon infection of a model cell line with seasonal human coronavirus OC43. We identified MHC-I and MHC-II bound peptides derived from the viral spike, nucleocapsid, hemagglutinin-esterase, 3C-like proteinase, and envelope proteins. Only three MHC-I bound OC43-derived peptides were observed, possibly due to the potent MHC-I downregulation induced by OC43 infection. By contrast, 80 MHC-II bound peptides corresponding to 14 distinct OC43-derived epitopes were identified, including many at very high abundance within the overall MHC-II peptidome. These peptides elicited low-abundance recall T cell responses in most donors tested. In vitro assays confirmed that the peptides were recognized by CD4+ T cells and identified the presenting HLA alleles. T cell responses cross-reactive between OC43, SARS-CoV-2, and the other seasonal coronaviruses were confirmed in samples of peripheral blood and peptide-expanded T cell lines. Among the validated epitopes, S 903-917 presented by DPA1*01:03/DPB1*04:01 and S 1085-1099 presented by DRB1*15:01 shared substantial homology to other human coronaviruses, including SARS-CoV-2, and were targeted by cross-reactive CD4 T cells. N 54-68 and HE 128-142 presented by DRB1*15:01 and HE 259-273 presented by DPA1*01:03/DPB1*04:01 are immunodominant epitopes with low coronavirus homology that are not cross-reactive with SARS-CoV-2. Overall, the set of naturally processed and presented OC43 epitopes comprise both OC43-specific and human coronavirus cross-reactive epitopes, which can be used to follow T cell cross-reactivity after infection or vaccination and could aid in the selection of epitopes for inclusion in pan-coronavirus vaccines.

Author summary: There is much current interest in cellular immune responses to seasonal common-cold coronaviruses because of their possible role in mediating protection against SARS-CoV-2 infection or pathology. However, identification of relevant T cell epitopes and systematic studies of the T cell responses responding to these viruses are scarce. We conducted a study to identify naturally processed and presented MHC-I and MHC-II epitopes from human cells infected with the seasonal coronavirus HCoV-OC43, and to characterize the T cell responses associated with these epitopes. We found epitopes specific to the seasonal coronaviruses, as well as epitopes cross-reactive between HCoV-OC43 and SARS-CoV-2. These epitopes should be useful in following immune responses to seasonal coronaviruses and identifying their roles in COVID-19 vaccination, infection, and pathogenesis.


Conflict of interest statement

Competing Interests: The authors have declared that no competing interests exist.

Figures

Figure 1.
Figure 1.. Immunopeptidome workflow and HLA-ABC, HLA-DR, and HLA-DP immunopeptidomes in OC43-infected HEK293 cells.
A. Experimental approach: HEK293 cells transduced with CIITA were infected with OC43. After 3 days, cells were collected and pMHC complexes were purified by immunoaffinity. Peptides were eluted from pMHC and analyzed by LC-MS/MS for identification. Identified peptides were used in biochemical and immunological assays. B. MHC expression on the surface of HEK293 cells. Four panels corresponding to the surface expression of HLA-ABC, HLA-DR, HLA-DQ, and HLA-DP are shown. HLA levels on wild-type cells are shown by grey histograms. HLA levels after transduction with CIITA are shown by colored histograms: HLA-ABC (blue), HLA-DR (purple), HLA-DQ (green), and HLA-DP (yellow). Isotype control staining is shown as an open histogram with dotted lines, following the same color scheme. C. Levels of total HLA-DR, HLA-DP, and HLA-DQ proteins in CIITA-transfected HEK293 cells measured by label-free quantitative proteomics. D. Representative dot plots of intracellular staining for OC43 nucleoprotein in non-infected cells (top) and at 3 days after infection (bottom). E. Representative histograms showing the comparison of surface levels of HLA-ABC, HLA-DR, and HLA-DP on non-infected (dark histograms) and infected (light histograms) cells. Graphs show the MFI in non-infected (non) and infected (oc43) cells from 3–6 independent infections. Statistical analysis in D and E by paired t-test, * p<0.05, ** p<0.01, ns: not significant. F. Length distribution of HLA-ABC, HLA-DR, and HLA-DP eluted immunopeptidomes (histograms). G. Sequence logos of clusters obtained using the Gibbs clustering analysis of HLA-ABC, HLA-DR, and HLA-DP eluted immunopeptidomes; percentage of peptides in each cluster and probable allele are shown.
Figure 2:
Figure 2:. OC43 virus-derived peptides in the HLA-ABC, HLA-DR, and HLA-DP immunopeptidomes.
A. Length distribution of virus-derived peptides within the HLA-ABC, HLA-DR, and HLA-DP immunopeptidomes of OC43-infected cells. B. Ranking of all HLA-ABC, HLA-DR, and HLA-DP eluted peptides according to their precursor ion intensity; viral peptides are shown by colored circles. Sequences are shown for the top five most abundant viral peptides. Lines show the position of the two most abundant peptides in each nested set. C. HLA-ABC eluted viral peptides. A schematic representation of each source protein and the location of the eluted sequence is shown (first and last residues indicated). D. HLA-DR and HLA-DP eluted viral peptides. A schematic representation of each source protein with the location of each eluted sequence is shown (first and last residues indicated); the predicted core epitope in each sequence is underlined. Nested sets of eluted peptides comprising length variants with the same core epitope are shown by lines below the sequence. The peptide sequence highlighted in red was used for biochemical and immunological assays (see Table 1). In C and D, each eluted sequence or nested set was identified by “P” followed by a number. E. Label-free quantification of proteins present in infected cells; proteins were ranked from most to least abundant, with viral proteins highlighted in color. F. Relationship between viral protein abundance and eluted peptide abundance. For each source protein, the sum of intensities of all eluted peptides derived from it was used to calculate the peptide abundance.
Figure 3:
Figure 3:. T cell recognition of eluted HLA-DR and HLA-DP viral peptides.
A. Ex vivo T cell responses to OC43 eluted peptides (pooled by HLA allele) in pre-pandemic PBMC samples from donors with a partial HLA match to HEK293 cells. The plot shows IFN-γ production measured by ELISpot (SFU/106 cells); pie graphs show the percentage of donors responding to the pool. B-C. Responding T cells from partially HLA-matched pre-pandemic donors were expanded in vitro by stimulation with each of the eluted peptides presented by a single allele antigen-presenting cells (APC). IFN-γ responses by expanded T cell populations from the same set of donors are shown in (B) for the HLA-DP peptides presented by DPA1*0301/DPB1*0401(DP4.1) and in (C) for the DR peptides presented by DRB1*1501 (DR2b) or DRB5*0101 (DR2a); pie graphs show the percentage of donors responding to the peptide. D. Summary of responses of single-peptide in vitro expanded T cells to the peptides, grouped by allele. E-F. Lowest peptide dose (10 – 10−7 μg/mL) eliciting a positive response to each eluted peptide, in experiments where the single-peptide in-vitro expanded T cells were tested for IFN-γ response to HLA-DP (E) or HLA-DR (F) eluted peptides presented by single allele APC (as in B-C). Each symbol represents a different donor. G. Response of single-peptide in-vitro expanded T cells to peptide stimulation followed in IFN-γ intracellular cytokine secretion (ICS) assay. Dot blots show CD4 expression (x-axis) and IFN-γ production (y-axis). DMSO, negative control. Responses > 3-fold background (DMSO) were considered positive. The gating strategy is presented in Figure S2. H-I. Summary of IFN-γ producing cell percentages in ICS assays for multiple donors for HLA-DP (H) and HLA-DR (I) peptides; only positive responses are shown. In A-C, statistical analysis to determine positive ELISpot responses was done by distribution-free resampling (DFR) method [89]; the size of the filled symbols indicates positive responses by DFR2x or DFR1x, while negative responses are shown as empty symbols. In A and D, statistical analysis was done by unpaired t-test (ns: not significant).
Figure 4:
Figure 4:. Epitope-specific T cell cross-reactivity between OC43 and other human coronaviruses.
A. Screening of cross-reactive T cell responses in partially HLA-matched pre-pandemic donors. IFN-γ responses (SFU/106 cells) to OC43 (green) or SARS-CoV-2 (blue) peptides using T cell lines expanded in vitro by stimulation with the eluted OC43 peptides and single allele APC. Pies show the fraction of responding donors to each peptide. B. For the two cross-reactive peptides (P4, P11), the screening was extended to more donors. C. Dose-response assay for the two cross-reactive peptides (P4, P11) in pre-pandemic donors. T cells were expanded in vitro with the OC43 peptide (TCL vs OC43, top row) or SARS-CoV-2 peptide (TCL vs CoV2, bottom row) and IFN-γ responses of each line to the OC43 peptide (green) or SARS-CoV-2 peptide (blue) were tested using single allele APC as before. D. Same as C but for COVID-19 convalescent donors. E. Lowest observed dose for a positive response for the cross-reactive peptides (tested in panels C and D). Pre-pandemic donors shown as circles and COVID-19 donors as triangles. F. Experimental binding of OC43 peptides (green) and the SARS-CoV-2 homologs (blue) to the relevant alleles. Half-maximal inhibitory concentration (IC50) values are shown. G. Sequence alignment of OC43 peptides and their SARS-CoV-2 homologs. OC43 sequences shown on top, with predicted core epitope shown in magenta and flanking regions in green; SARS-CoV-2 sequences on bottom, with residues different from OC43 shown and dots indicating identical residues. Predicted SARS-CoV-2 core epitope highlighted in turquoise with flanking regions shown in blue. Positions within the 9mer core epitope are indicated by numbers shown below the sequences; major T cell contacts are enclosed in circles. Arrowheads indicated gaps in the aligned sequences. If OC43 and SARS-CoV-2 epitopes are different both are shown. Gray bars show positions of identical residues at T cell contacts positions. H. Experimental binding of P4 and P11 OC43 peptides and their homologs in other coronaviruses to the relevant alleles. I. IFN-γ responses of T cell lines expanded in vitro with OC43 peptides (TCL vs OC43, top row) or with SARS-CoV-2 peptides (TCL vs CoV2, bottom row), to P4 and P11 peptides from OC43, SARS-CoV-2, and the other seasonal coronaviruses, presented by relevant single allele APC. In A-D and I, ELISpot statistical analysis by DFR method [89]; positive responses shown as filled symbols and negative responses as empty symbols. In B and E, statistical analysis was done by unpaired t-test. * p<0.05).

Similar articles

References

    1. Perlman S, Dandekar AA. Immunopathogenesis of coronavirus infections: implications for SARS. Nat Rev Immunol. 2005;5: 917–927. doi:10.1038/nri1732 - DOI - PMC - PubMed
    1. Kesheh MM, Hosseini P, Soltani S, Zandi M. An overview on the seven pathogenic human coronaviruses. Rev Med Virol. 2022;32: e2282. doi:10.1002/rmv.2282 - DOI - PubMed
    1. Killerby ME, Biggs HM, Haynes A, Dahl RM, Mustaquim D, Gerber SI, et al. Human coronavirus circulation in the United States 2014–2017. J Clin Virol. 2018;101: 52–56. doi:10.1016/j.jcv.2018.01.019 - DOI - PMC - PubMed
    1. Gaunt ER, Hardie A, Claas ECJ, Simmonds P, Templeton KE. Epidemiology and clinical presentations of the four human coronaviruses 229E, HKU1, NL63, and OC43 detected over 3 years using a novel multiplex real-time PCR method. J Clin Microbiol. 2010;48: 2940–2947. doi:10.1128/JCM.00636-10 - DOI - PMC - PubMed
    1. Su S, Wong G, Shi W, Liu J, Lai ACK, Zhou J, et al. Epidemiology, Genetic Recombination, and Pathogenesis of Coronaviruses. Trends Microbiol. 2016;24: 490–502. doi:10.1016/j.tim.2016.03.003 - DOI - PMC - PubMed

Publication types