

MEASURING PERFORMANCE FOR END-OF-LIFE CARE
- PMID: 36483542
- PMCID: PMC9728673
- DOI: 10.1214/21-aoas1558
MEASURING PERFORMANCE FOR END-OF-LIFE CARE
Abstract
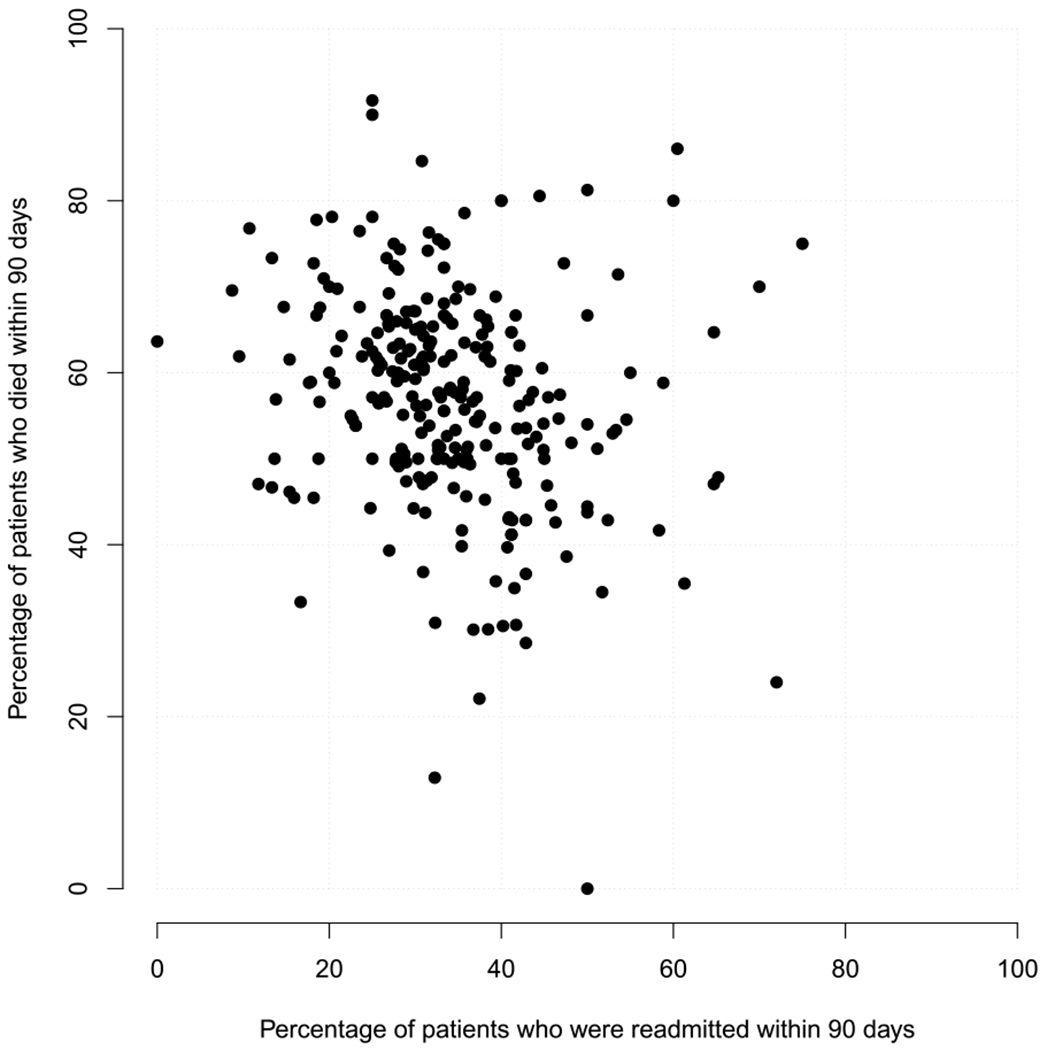
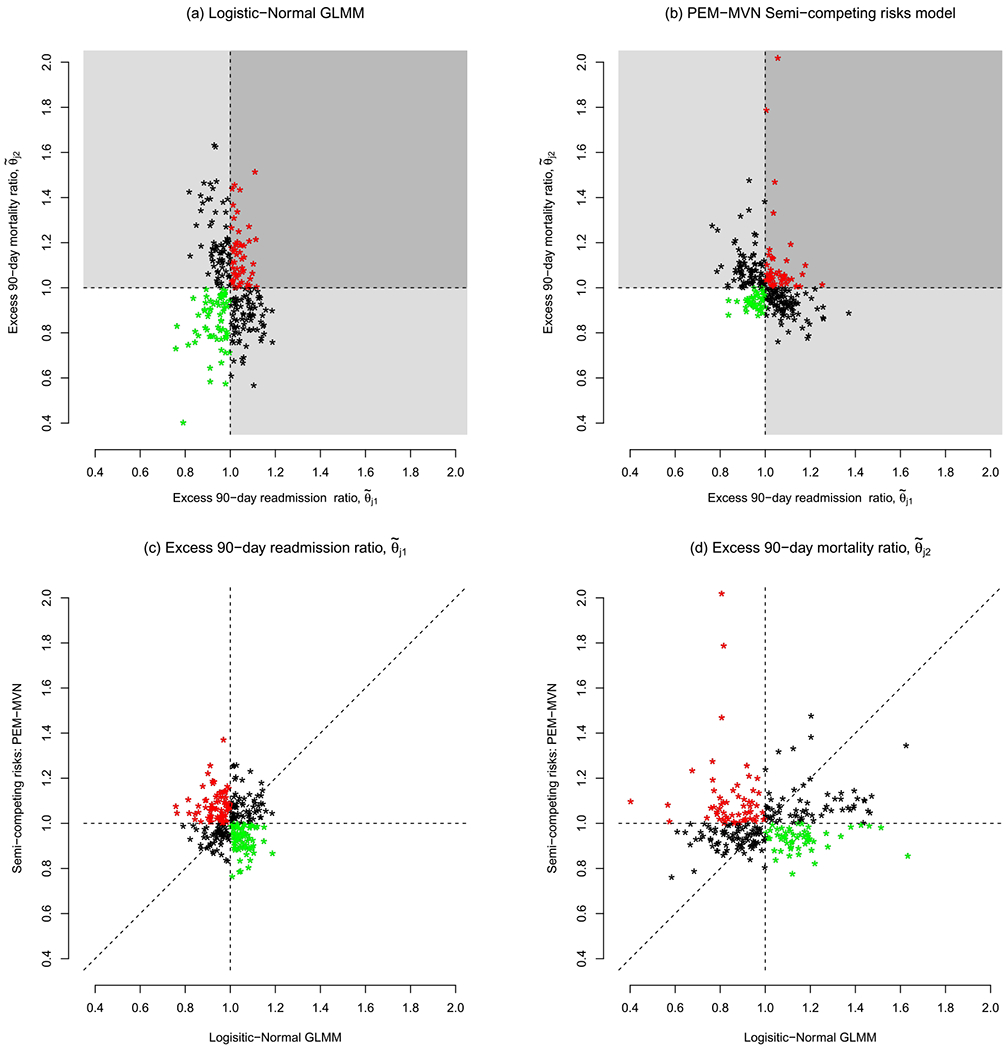
Although not without controversy, readmission is entrenched as a hospital quality metric with statistical analyses generally based on fitting a logistic-Normal generalized linear mixed model. Such analyses, however, ignore death as a competing risk, although doing so for clinical conditions with high mortality can have profound effects; a hospital's seemingly good performance for readmission may be an artifact of it having poor performance for mortality. in this paper we propose novel multivariate hospital-level performance measures for readmission and mortality that derive from framing the analysis as one of cluster-correlated semi-competing risks data. We also consider a number of profiling-related goals, including the identification of extreme performers and a bivariate classification of whether the hospital has higher-/lower-than-expected readmission and mortality rates via a Bayesian decision-theoretic approach that characterizes hospitals on the basis of minimizing the posterior expected loss for an appropriate loss function. in some settings, particularly if the number of hospitals is large, the computational burden may be prohibitive. To resolve this, we propose a series of analysis strategies that will be useful in practice. Throughout, the methods are illustrated with data from CMS on N = 17,685 patients diagnosed with pancreatic cancer between 2000-2012 at one of J = 264 hospitals in California.
Keywords: Bayesian decision theory; hierarchical modeling; provider profiling; quality of care; semicompeting risks.
Figures
References
-
- Abramowitz M. and Stegun IA, eds. (1966). Handbook of Mathematical Functions, with Formulas, Graphs, and Mathematical Tables 55. Dover, New York. MR0208797
-
- Antonelli J, Trippa L and Haneuse S (2016). Mitigating bias in generalized linear mixed models: The case for Bayesian nonparametrics. Statist. Sci 31 80–95. MR3458594 https://doi.org/10.1214/15-STS533 - DOI - PMC - PubMed
-
- Bates J, Lewis S and Pickard A (2019). Education Policy, Practice and the Professional. Bloomsbury Publishing.
-
- Bush CA and MacEachern SN (1996). A semiparametric Bayesian model for randomised block designs. Biometrika 83 275–285.
Grants and funding
LinkOut - more resources
Full Text Sources