. 2022 Nov 22:13:976196.
doi: 10.3389/fimmu.2022.976196. eCollection 2022.

Epigenetic therapy reprograms M2-type tumor-associated macrophages into an M1-like phenotype by upregulating miR-7083-5p

Affiliations

Epigenetic therapy reprograms M2-type tumor-associated macrophages into an M1-like phenotype by upregulating miR-7083-5p

Sri Murugan Poongkavithai Vadevoo et al. Front Immunol. .

Abstract

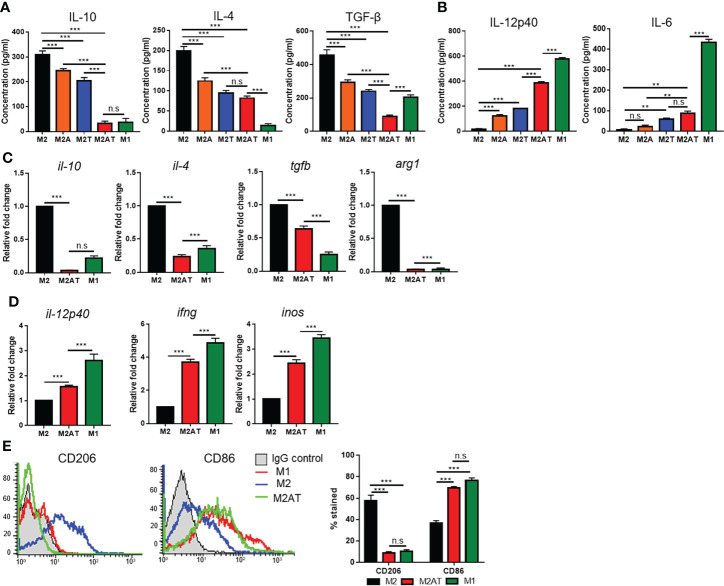
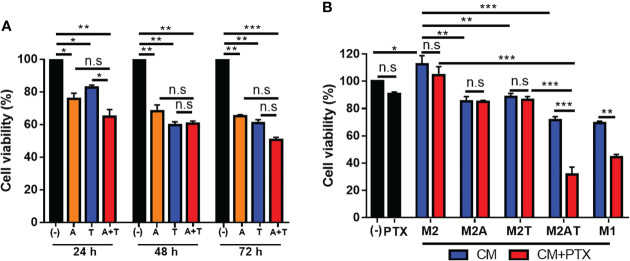
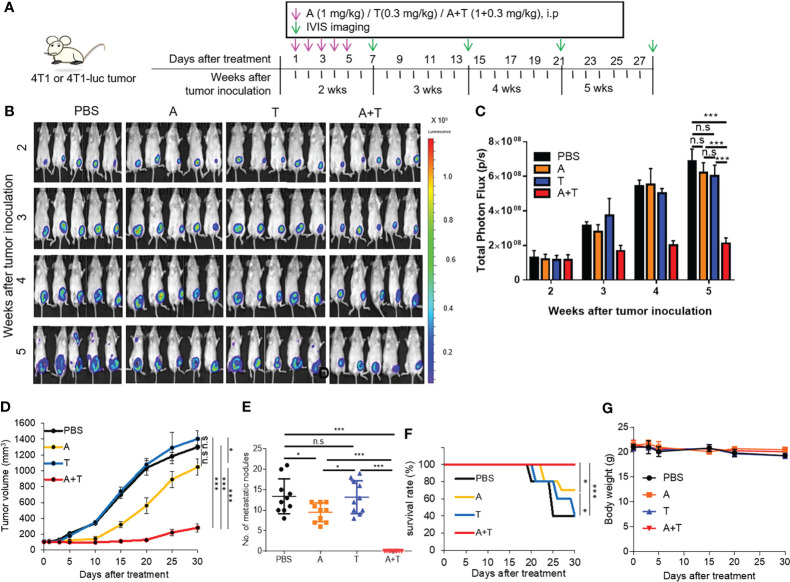
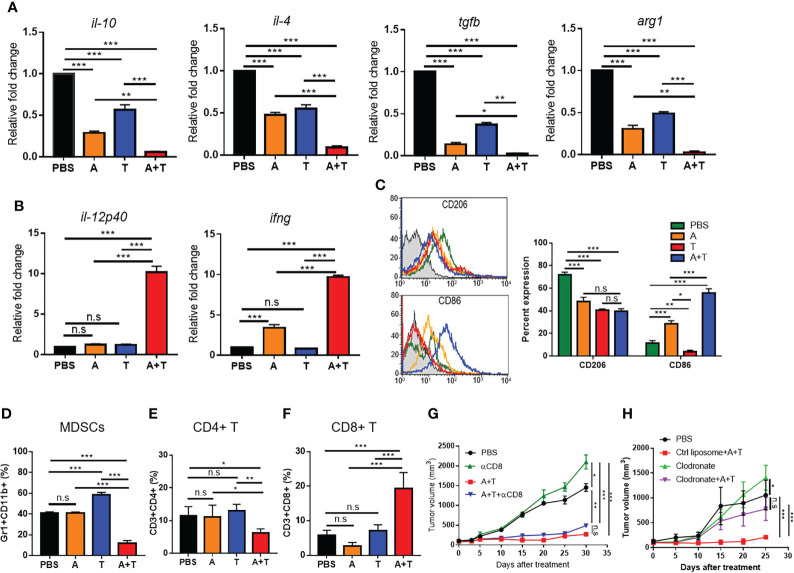
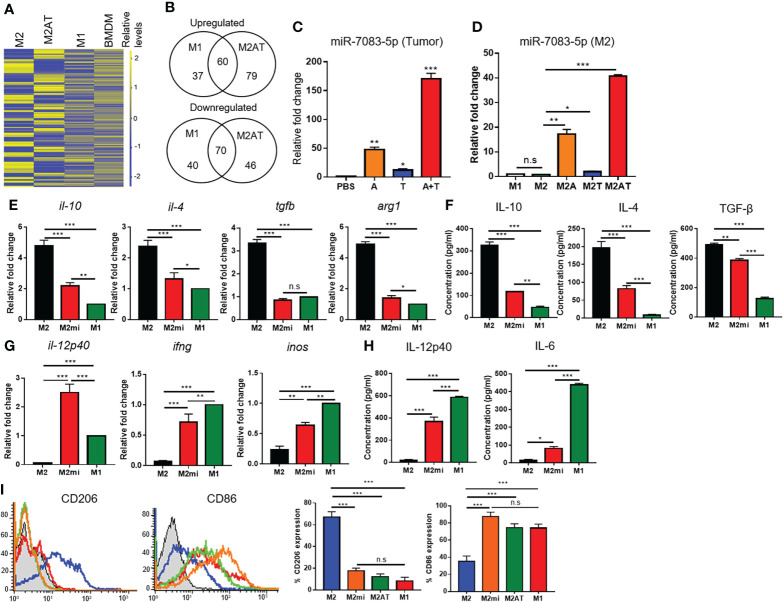
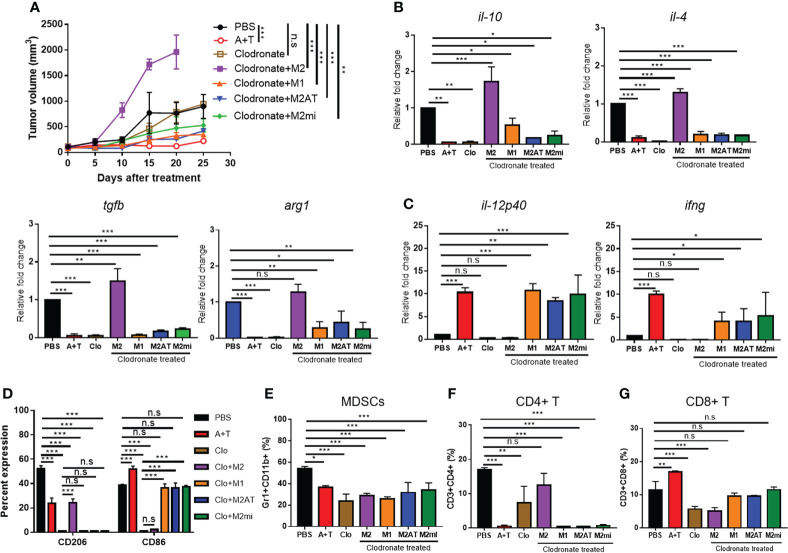
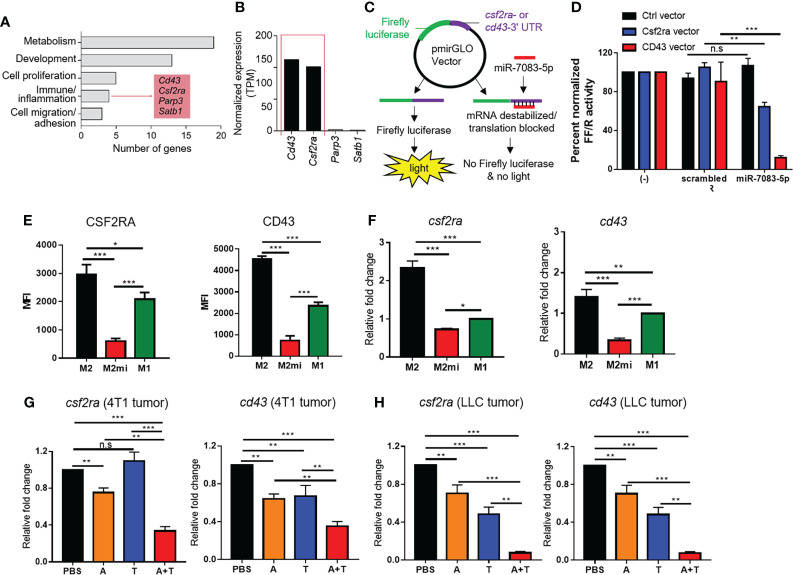
Reprogramming M2-type, pro-tumoral tumor-associated macrophages (TAMs) into M1-type, anti-tumoral macrophages is a key strategy in cancer therapy. In this study, we exploited epigenetic therapy using the DNA methylation inhibitor 5-aza-2'-deoxycytidine (5-aza-dC) and the histone deacetylation inhibitor trichostatin A (TSA), to reprogram M2-type macrophages into an M1-like phenotype. Treatment of M2-type macrophages with the combination of 5-aza-dC and TSA decreased the levels of M2 macrophage cytokines while increasing those of M1 macrophage cytokines, as compared to the use of either therapy alone. Conditioned medium of M2 macrophages treated with the combination of 5-aza-dC and TSA sensitized the tumor cells to paclitaxel. Moreover, treatment with the combination inhibited tumor growth and improved anti-tumor immunity in the tumor microenvironment. Depletion of macrophages reduced the anti-tumor growth activity of the combination therapy. Profiling of miRNAs revealed that the expression of miR-7083-5p was remarkably upregulated in M2 macrophages, following treatment with 5-aza-dC and TSA. Transfection of miR-7083-5p reprogrammed the M2-type macrophages towards an M1-like phenotype, and adoptive transfer of M2 macrophages pre-treated with miR-7083-5p into mice inhibited tumor growth. miR-7083-5p inhibited the expression of colony-stimulating factor 2 receptor alpha and CD43 as candidate targets. These results show that epigenetic therapy upon treatment with the combination of 5-aza-dC and TSA skews M2-type TAMs towards the M1-like phenotype by upregulating miR-7083-5p, which contributes to the inhibition of tumor growth.

Keywords: 5-aza-2’-deoxycytidine; epigenetic therapy; macrophage reprogramming; miR-7083-5p; trichostatin A.


Conflict of interest statement

The authors declare that the research was conducted in the absence of any commercial or financial relationships that could be construed as a potential conflict of interest.

Figures

Figure 1
Figure 1
Epigenetic therapy with the combination of 5-aza-dC and TSA reprograms the M2-type macrophages towards an M1-like phenotype. (A, B) ELISA to quantify the M2-type (A) and M1-type (B) cytokines secreted into the culture medium after treatment of M2-type macrophages (M2) with 50 nM 5-aza-dC (M2A) and 25 nM TSA (M2T), alone or in combination (M2AT). M1-type macrophages (M1) were used as a control. (C, D) qRT-PCR analysis of the mRNA levels of M2-type (C) and M1-type (D) cytokines and markers after treatment of M2-type macrophages with 5-aza-dC and TSA in combination. (E) Flow cytometric analysis of the surface expression of CD206 and CD86 after treatment of M2-type macrophages with 5-aza-dC and TSA in combination. Data represent the mean ± SD of three separate experiments performed in triplicates. **, P<0.01; ***, P<0.001; n.s., not significant, as assessed using one-way ANOVA followed by Tukey’s multiple comparison post-hoc test.
Figure 2
Figure 2
Conditioned medium (CM) of M2-type macrophages treated with the combination of 5-aza-dC and TSA inhibits tumor cell survival and sensitizes tumor cells to chemotherapy. (A) Cell viability of 4T1 tumor cells after treatment with 50 nM 5-aza-dC (referred as A) and 25 nM TSA(referred as T), alone or in combination (A+T), for 24–72 (h) (B) Cell viability of 4T1 tumor cells after incubation with the CM of M2-macrophages (M2) treated with 5-aza-dC (M2A) and TSA (M2T), alone or in combination (M2AT), in the absence (blue bars) or presence of 1 μM paclitaxel (PTX, red bars), for 24 h. Black bars represent untreated (-) and PTX-treated tumor cells in the absence of CM. The CM of M1-macrophages (M1) was used as a control. Data represent the mean ± SD of three separate experiments performed in triplicates. *, P<0.05; ***, P<0.001; n.s., not significant, as assessed using one-way ANOVA followed by Tukey’s multiple comparison post-hoc test (A) or two-way ANOVA followed by Bonferroni multiple comparisons post-hoc test (B).
Figure 3
Figure 3
Epigenetic therapy with 5-aza-dC and TSA synergistically inhibits breast tumor growth in mice. (A) Experimental schemes of the tumor therapy. Mice bearing 4T1 or 4T1-luc tumors (approximately 100–150 mm3 in size) in the left and lower mammary gland were treated with 5-aza-dC and TSA, alone or in combination (1 mg/kg body weight 5-aza-dC and 0.3 mg/kg body weight TSA, once a day, for 5 d), at 2 weeks after tumor inoculation. (B) Whole-body bioluminescence images of mice bearing 4T1-luc tumors were taken 10 min after injection of D-luciferin into the mice after treatments. Scale bar represents the intensity of luminescence. (C) Quantitation of the total photon flux (the number of photons per second, p/s) obtained upon whole-body imaging. Data have been presented as the mean ± S.D. ***, P<0.001; n.s., not significant (n=5 per group), as assessed using two-way ANOVA. (D–G) Tumor volumes (D), body weight (E), number of metastatic nodules in the lung (F), and survival rates (G) after treatments. Data have been presented as the mean ± S.D. *, P<0.05; ***, P<0.001; n.s., not significant (n=10 mice per group), as assessed using one-way ANOVA followed by Tukey’s multiple comparison post-hoc test.
Figure 4
Figure 4
Epigenetic therapy with the combination of 5-aza-dC and TSA promotes reprogramming of M2-type TAMs into the M1-like phenotype in the tumor microenvironment. (A, B) qRT-PCR analysis of the relative mRNA levels of M2- (A) and M1-type (B) cytokines and markers in tumor tissues after treatment of 4T1 tumor-bearing mice with 5-aza-dC (referred as A) and TSA (referred as T), alone or in combination (A+T). (C–F) Flow cytometric analysis of the population of CD206+ M2 macrophages and CD86+ M1 macrophages (C), CD11b+Gr1+ MDSCs (D), CD4+ T cells (E), and CD8+ T cells (F) in the tumor tissues after treatments. (G, H) Tumor volumes after treatments in the absence or presence of CD8+ T cell depletion (G) and macrophage depletion using clodronate (H). Control (Ctrl) liposomes were used as control for clodronate. Data represent the mean ± SD of three separate experiments performed in triplicates (A–F) and three mice (n=3) per group (G, H). *, P<0.05; **, P<0.01; ***, P<0.001; n.s., not significant, as assessed using one-way ANOVA followed by Tukey’s multiple comparison post-hoc test.
Figure 5
Figure 5
miR-7083-5p is involved in the reprogramming of M2-type macrophage into an M1-like phenotype upon treatment with the combination of 5-aza-dC and TSA. (A) Hierarchical clustering heat map showing the relative levels of miRNAs in M2-type macrophages (M2) after treatment with the combination of 5-aza-dC and TSA (M2AT). M1 macrophages (M1) and bone marrow-derived monocytes (BMDMs) were used as controls. (B) Venn diagrams showing the number of upregulated and downregulated miRNAs in M2AT and M1, as compared to those in M2. (C, D) qRT-PCR analysis of the relative levels of miR-7083-5p in 4T1 tumor tissues, after treatments with 5-aza-dC (referred as A) and TSA (referred as T), alone or in combination (A+T), (C) and in M2 macrophages, after treatments with 5-aza-dC (M2A) and TSA (M2T), alone or in combination (D). (E, G) qRT-PCR analysis of the relative mRNA levels of M2- (E) and M1-type (G) cytokines and markers in M2 macrophages after transfection of miR-7083-5p (M2mi). (F, H) ELISA of the concentrations of M2- (F) and M1-type (H) cytokines secreted into the culture medium of M2 macrophages after transfection of miR-7083-5p. (I) Flow cytometric analysis of CD206 and CD86 expression levels in M2mi and M2AT. *, P<0.05; **, P<0.01; ***, P<0.001; n.s., not significant (n=3 per group), as assessed using one-way ANOVA. Data represent the mean ± SD of three separate experiments performed in triplicates. *, P<0.05; **, P<0.01; ***, P<0.001; n.s., not significant, as assessed using one-way ANOVA followed by Tukey’s multiple comparison post-hoc test.
Figure 6
Figure 6
Adoptive transfer of M2 macrophages pre-treated with miR-7083-5p or combination of 5-aza-dC and TSA reduces tumor growth. (A) Tumor volumes after treatment of 4T1 tumor-bearing mice with clodronate and subsequent adoptive transfer of M2 macrophages pre-treated with miR-7083-5p (M2mi) or combination of 5-aza-dC and TSA (M2AT). M1 and M2 macrophages were included as control. (B, C) qRT-PCR analysis of the relative mRNA levels of M2- (B) and M1-type (C) cytokines and markers in tumor tissues after treatments. (D–G) Flow cytometric analysis of the population of CD206+ M2 macrophages and CD86+ M1 macrophages (D), CD11b+Gr1+ MDSCs (E), CD4+ T cells (F), and CD8+ T cells (G) in the tumor tissues after treatments. A+T, combined treatment with 5-aza-dC and TSA. Clo, clodronate. Data represent the mean ± SD. *, P<0.05; **, P<0.01; ***, P<0.001; n.s., not significant (n=3 mice per group), as assessed using one-way ANOVA followed by Tukey’s multiple comparison post-hoc test.
Figure 7
Figure 7
CSF2RA and CD43 are downregulated by miR-7083-5p as candidate targets. (A) Functional categorization of 33 predicted targets of miR-7083-5p. Functional enrichment analysis were performed using DAVID software. (B) Normalized expression levels of the four immune/inflammatory response-related genes from the Human Protein Atlas. (C) Experimental schemes of reporter assays using pmirGLO dual-luciferase miRNA target expression vector inserted with CSF2RA- or CD43-3′-UTR and a control (Ctrl) vector. (D) Firefly luciferase activity normalized to Renilla luciferase activity (FF/R) of HEK293T cells transfected with the pmirGLO luciferase reporter in the absence or presence of miR-7083-5p or a scrambled control. (E) Flow cytometric analysis of CSF2RA and CD43 expression levels in M2 macrophages (M2) after transfection with miR-7083-5p (M2mi). M1 macrophages (M1) were used as control. (F) qRT-PCR analysis of relative mRNA levels of csf2ra and cd43 in M2 macrophages after transfection with miR-7083-5p. (G, H) qRT-PCR analysis of the relative mRNA levels of csf2ra and cd43 in 4T1 (G) and LLC (H) tumor tissues after treatments with 5-aza-dC (referred as A) and TSA (referred as T), alone or in combination (A+T). Data have been presented as the mean ± S.D. of three separate experiments performed in five replicates. *, P<0.05; **, P<0.01; ***, P<0.001; n.s., not significant, as assessed using two-way ANOVA followed by Bonferroni multiple comparisons post-hoc test (B) and one-way ANOVA followed by Tukey’s multiple comparison post-hoc test (C–F).

References

    1. Pollard JW. Tumour-educated macrophages promote tumour progression and metastasis. Nat Rev Cancer (2004) 4:71–8. doi: 10.1038/nrc1256 - DOI - PubMed
    1. Lewis CE, Pollard JW. Distinct role of macrophages in different tumor microenvironments. Cancer Res (2006) 66:605–12. doi: 10.1158/0008-5472.CAN-05-4005 - DOI - PubMed
    1. Noy R, Pollard JW. Tumor-associated macrophages: from mechanisms to therapy. Immunity. (2014) 41:49–61. doi: 10.1016/j.immuni.2014.06.010 - DOI - PMC - PubMed
    1. Colegio OR, Chu N-Q, Szabo AL, Chu T, Rhebergen AM, Jairam V, et al. . Functional polarization of tumour-associated macrophages by tumour-derived lactic acid. Nature. (2014) 513:559–63. doi: 10.1038/nature13490 - DOI - PMC - PubMed
    1. Kusmartsev S, Gabrilovich DI. STAT1 signaling regulates tumor-associated macrophage-mediated T cell deletion. J Immunol (2005) 174:4880–91. doi: 10.4049/jimmunol.174.8.4880 - DOI - PubMed

Publication types