

A novel signature based on CeRNA and immune status predicts prognostic risk and drug sensitivity in gastric cancer patients
- PMID: 36483555
- PMCID: PMC9723231
- DOI: 10.3389/fimmu.2022.951135
A novel signature based on CeRNA and immune status predicts prognostic risk and drug sensitivity in gastric cancer patients
Abstract
Background: At present, there is increasing evidence that both competitive endogenous RNAs (ceRNAs) and immune status in the tumor microenvironment (TME) can affect the progression of gastric cancer (GC), and are closely related to the prognosis of patients. However, few studies have linked the two to jointly determine the prognosis of patients with GC. This study aimed to develop a combined prognostic model based on ceRNAs and immune biomarkers.
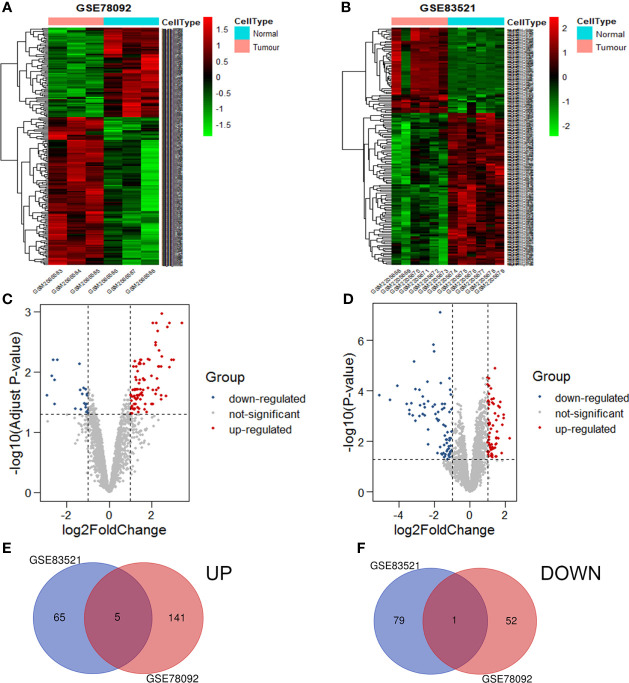
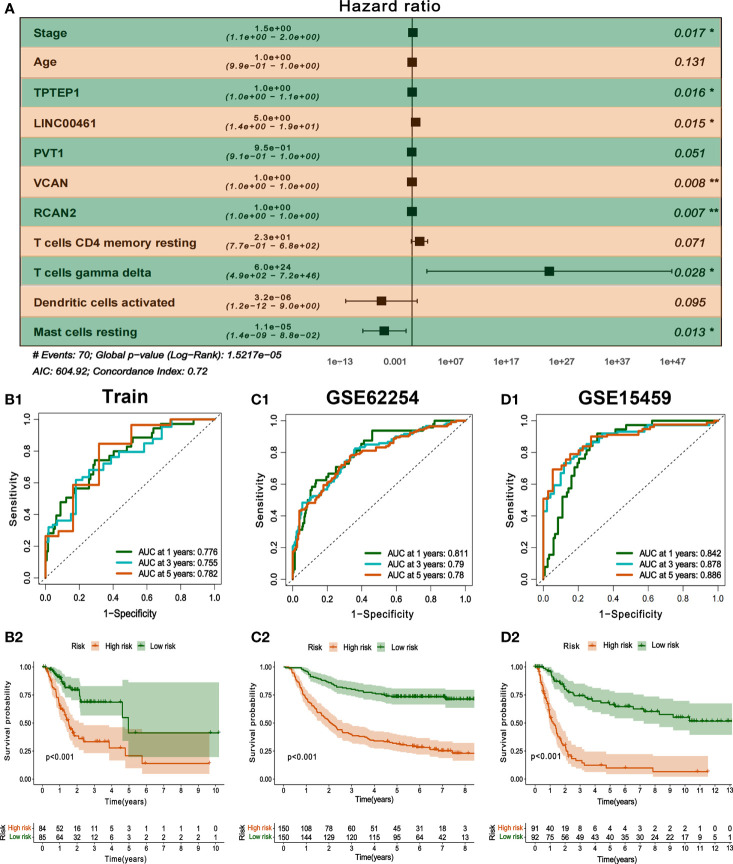
Methods: First, the gene expression profiles and clinical information were downloaded from TCGA and GEO databases. Then two ceRNA networks were constructed on the basis of circRNA. Afterwards, the key genes were screened by univariate Cox regression analysis and Lasso regression analysis, and the ceRNA-related prognostic model was constructed by multivariate Cox regression analysis. Next, CIBERSORT and ESTIMATE algorithms were utilized to obtain the immune cell infiltration abundance and stromal/immune score in TME. Furthermore, the correlation between ceRNAs and immunity was found out through co-expression analysis, and another immune-related prognosis model was established. Finally, combining these two models, a comprehensive prognostic model was built and visualized with a nomogram.
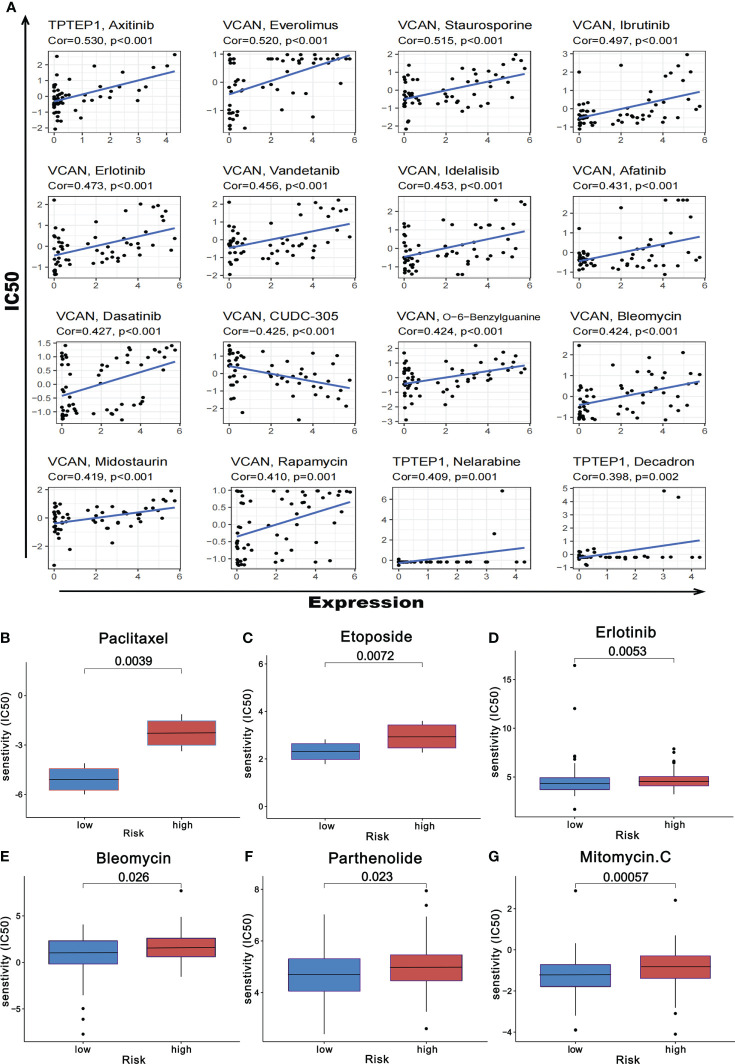
Results: The (circRNA, lncRNA)-miRNA-mRNA regulatory network of GC was constructed. The predictive power of ceRNA-related and immune-related prognosis models was moderate. Co-expression analysis showed that the ceRNA network was correlated with immunity. The integrated model of combined ceRNAs and immunity in the TCGA training set, the AUC values of 1, 3, and 5-year survival rates were 0.78, 0.76, and 0.78, respectively; in the independent external validation set GSE62254, they were 0.81, 0.79, and 0.78 respectively; in GSE15459, they were 0.84, 0.88 and 0.89 respectively. Besides, the prognostic score of the comprehensive model can predict chemotherapeutic drug resistance. Moreover, we found that plasma variant translocation 1 (PVT1) and infiltrating immune cells (mast cells) are worthy of further investigation as independent prognostic factors.
Conclusions: Two ceRNA regulatory networks were constructed based on circRNA. At the same time, a comprehensive prognosis model was established, which has a high clinical significance for prognosis prediction and chemotherapy drug selection of GC patients.
Keywords: CircRNA; competing endogenous RNA network; gastric cancer; immunocyte infiltration; mast cell; plasma variant translocation 1; prognostic model.
Copyright © 2022 Cao, Zhou, Li, Zhang, Zhang, Yang, Yang, Cao, Chen and Xiong.
Conflict of interest statement
The authors declare that the research was conducted in the absence of any commercial or financial relationships that could be construed as a potential conflict of interest.
Figures


Similar articles
-
Comprehensive analysis of the competing endogenous circRNA-lncRNA-miRNA-mRNA network and identification of a novel potential biomarker for hepatocellular carcinoma.Aging (Albany NY). 2021 May 28;13(12):15990-16008. doi: 10.18632/aging.203056. Epub 2021 May 28. Aging (Albany NY). 2021. PMID: 34049287 Free PMC article.
-
The exploration of new biomarkers for oral cancer through the ceRNA network and immune microenvironment analysis.Medicine (Baltimore). 2022 Dec 9;101(49):e32249. doi: 10.1097/MD.0000000000032249. Medicine (Baltimore). 2022. PMID: 36626444 Free PMC article.
-
The prognostic value of circular RNA regulatory genes in competitive endogenous RNA network in gastric cancer.Cancer Gene Ther. 2021 Nov;28(10-11):1175-1187. doi: 10.1038/s41417-020-00270-9. Epub 2021 Jan 29. Cancer Gene Ther. 2021. PMID: 33514881
-
The hidden messengers: Tumor microenvironment-derived exosomal ceRNAs in gastric cancer progression.Pathol Res Pract. 2025 May;269:155905. doi: 10.1016/j.prp.2025.155905. Epub 2025 Mar 8. Pathol Res Pract. 2025. PMID: 40073646 Review.
-
The role of ceRNAs in breast cancer microenvironmental regulation and therapeutic implications.J Mol Med (Berl). 2025 Jan;103(1):33-49. doi: 10.1007/s00109-024-02503-y. Epub 2024 Dec 6. J Mol Med (Berl). 2025. PMID: 39641797 Review.
Cited by
-
Identification of GNG7 as a novel biomarker and potential therapeutic target for gastric cancer via bioinformatic analysis and in vitro experiments.Aging (Albany NY). 2023 Feb 24;15(5):1445-1474. doi: 10.18632/aging.204545. Epub 2023 Feb 24. Aging (Albany NY). 2023. PMID: 36863706 Free PMC article.
-
Integrated bioinformatics and validation reveal SOX12 as potential biomarker in colon adenocarcinoma based on an immune infiltration-related ceRNA network.J Cancer Res Clin Oncol. 2023 Nov;149(17):15737-15762. doi: 10.1007/s00432-023-05316-7. Epub 2023 Sep 5. J Cancer Res Clin Oncol. 2023. PMID: 37668799 Free PMC article.
-
Novel role of circRNAs in the drug resistance of gastric cancer: regulatory mechanisms and future for cancer therapy.Front Pharmacol. 2024 Sep 9;15:1435264. doi: 10.3389/fphar.2024.1435264. eCollection 2024. Front Pharmacol. 2024. PMID: 39314750 Free PMC article. Review.
-
Integrated multiomics machine learning and mediated Mendelian randomization investigate the molecular subtypes and prognosis lung squamous cell carcinoma.Transl Lung Cancer Res. 2025 Mar 31;14(3):857-877. doi: 10.21037/tlcr-24-891. Epub 2025 Mar 18. Transl Lung Cancer Res. 2025. PMID: 40248728 Free PMC article.
References
Publication types
MeSH terms
Substances
LinkOut - more resources
Full Text Sources
Medical
Miscellaneous