. 2022 Nov 22:13:1015182.
doi: 10.3389/fimmu.2022.1015182. eCollection 2022.

IL-17A and TNF-α inhibitors induce multiple molecular changes in psoriasis

Affiliations

IL-17A and TNF-α inhibitors induce multiple molecular changes in psoriasis

Qiang Dong et al. Front Immunol. .

Abstract

Adalimumab and secukinumab are commonly used for moderate to severe psoriasis vulgaris (PV). Although distinct individual responses to and impaired effectiveness of these biological agents occur occasionally, little is known about the underlying reasons. Here, we report a proteomic analysis of psoriatic lesions from patients treated with these drugs using data-independent acquisition mass spectrometry (DIA-MS). Thousands of differentially expressed proteins (DEPs) changed over 12 weeks of treatment. Network analysis showed that DEPs could interact and induce transformation in matrix components, metabolic regulation, and immune response. The results of parallel reaction monitoring (PRM) analysis suggested that S100s, STAT1, KRT2, TYMP, SOD2, HSP90AB1, TFRC, and COL5A1 were the most significantly changed proteins in both groups. There was a positive association between the Psoriasis Area and Severity Index (PASI) score and three proteins (TFRC, IMPDH2, KRT2). Our study findings suggest that inhibition of IL-17A and TNF-α can induce changes in multiple molecules in psoriatic lesions and have an overlapping influence on the immune response and process through direct or indirect effects.

Keywords: adalimumab; biological agent; data-independent acquisition mass spectrometry; ingenuity pathway analysis; parallel reaction monitoring; proteomics; psoriasis; secukinumab.


Conflict of interest statement

The authors declare that the research was conducted in the absence of any commercial or financial relationships that could be construed as a potential conflict of interest.

Figures

Figure 1
Figure 1
Expression patterns of differentially expressed proteins (DEPs) in the three groups. Expression patterns of DEPs in the adalimumab group (A), secukinumab group (B), and control group (C). Coloured models enriched a statistically significant number of proteins. The number on the top left corner indicates the serial number of models, and the bottom left corner reveals the number of proteins enriched. (D) Representative protein expression pattern of Model 13 (AD represent baseline, week 1, week 4, and week 12, respectively) in the adalimumab group.
Figure 2
Figure 2
Six clusters of molecular functions in the two biological agent groups according to the GO enrichment analysis. The DEPs are labelled with circles (solid, upregulated proteins; hollow, downregulated proteins). Different colours represent different clusters. The size of the circle indicates |log2 (FC)|. The cut-off was set at p value<0.05 and |log2 (FC)| >log2 (1.2).
Figure 3
Figure 3
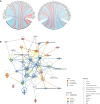
(A) Correlation between DEPs and clinical improvement. Circos plot presenting the Pearson correlation between DEPs and the PASI score (|cor|>0.6, p value<0.05). Red ribbons indicate positive Pearson correlation coefficients, namely, the downregulation of protein. Blue represents negative Pearson correlation coefficients, that is, the upregulation of protein. The width of the ribbons indicates the correlation value. (B) Causal network analysis obtained by IPA of eleven proteins that changed significantly in both biological agent groups in DIA. The highest-score network (containing ten proteins, except IMPDH2) is displayed only for the secukinumab group because the relationship patterns of the proteins in the two groups were similar. The relationship among molecules is represented by lines (solid lines for direct association and dotted lines for indirect association).
Figure 4
Figure 4
(A) Networks of enriched pathways. Nodes represent different pathways, and edges represent interrelation between pathways. Edge width corresponds to the score of a specific pathway pair. The degree of a pathway was represented by node size. The red nodes represent the enriched pathway in the adalimumab group. The blue nodes are enriched in the secukinumab group. (B) Separate and overlapped pathways and processes in the two biological agent groups. A Venn diagram was used to screen the skin-related signalling pathways and processes obtained from IPA. The term “ADM” represents adalimumab, while “BJS” represents secukinumab in the picture.
Figure 5
Figure 5
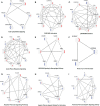
DEP networks in nine significantly enriched pathways. They are actin cytoskeleton signalling (A), FXR_RXR activation (B), LXR_RXR activation (C), acute phase response signalling (D), MSP-RON signalling in macrophages pathway (E), Role of IL-17A in psoriasis (F), hepatic fibrosis signalling Pathway (G), hepatic fibrosis_ hepatic stellate cell activation (H), and pulmonary fibrosis idiopathic signalling pathway (I). Each protein is depicted as a radar chart. Different groups are labelled with different colours. Red area represents the adalimumab group, and blue area represents the secukinumab group. The shadow area covering the circles indicates the FC values for each protein.
Figure 6
Figure 6
Causal network analysis obtained from ingenuity pathway analysis. Each protein is depicted with a radar chart that is made up of four rings; from the inside to out, it represents |log2FC|<=1, |log2FC|<=1.5, |log2FC|<=2, and |log2FC|>2. Red area represents the adalimumab group, and blue area represents the secukinumab group. The relation between two proteins is shown in lines (the arrow indicates predictive activation). Green colour for protein names indicates downregulation, and red colour indicates upregulation. Then, we applied Cytoscape (Version 3.9.1) to visualize the networks. The cut-off was set at p value<0.05 and |log 2(FC)| >log2(1.2).
Figure 7
Figure 7
PRM identifies dynamic changes in DEPs during treatment. (A) Heatmap shows dynamic changes in fourteen proteins at the different time points and in diverse groups based on the proteomic data of PRM. (B) Six proteins with the most significant change in both biological groups and their expression trends at different times. The ordinate represents the log2 FC values. (C) Causal network analysis obtained by IPA of eleven proteins that changed significantly in both biological agent groups in PRM. The highest-score network (containing ten proteins, except KRT2) is displayed only for the secukinumab group because the relationship patterns of the proteins in the two groups were similar. The relationship among molecules is represented by lines (solid lines for direct association and dotted lines for indirect association).
Figure 8
Figure 8
Key DEPs represent multiple molecule changes in psoriasis posttreatment. The figure shows only DEPs with FC>1.5. Proteins are involved in KC function, matrix components, metabolism and immune response based on their corresponding expression levels in the two biological agent groups. Red colour for protein names indicates the adalimumab group. Purple colour indicates the secukinumab group, and blue colour indicates the DEPs in both groups.

References

    1. Armstrong AW, Read C. Pathophysiology, clinical presentation, and treatment of psoriasis: A review. JAMA (2020) 323(19):1945–60. doi: 10.1001/jama.2020.4006 - DOI - PubMed
    1. Armstrong AW, Puig L, Joshi A, Skup M, Williams D, Li J, et al. . Comparison of biologics and oral treatments for plaque psoriasis: A meta-analysis. JAMA Dermatol (2020) 156(3):258–69. doi: 10.1001/jamadermatol.2019.4029 - DOI - PMC - PubMed
    1. Silfvast-Kaiser A, Paek SY, Menter A. Anti-Il17 therapies for psoriasis. Expert Opin Biol Ther (2019) 19(1):45–54. doi: 10.1080/14712598.2019.1555235 - DOI - PubMed
    1. Amin M, No DJ, Egeberg A, Wu JJ. Choosing first-line biologic treatment for moderate-to-Severe psoriasis: What does the evidence say? Am J Clin Dermatol (2018) 19(1):1–13. doi: 10.1007/s40257-017-0328-3 - DOI - PubMed
    1. Egeberg A, Ottosen MB, Gniadecki R, Broesby-Olsen S, Dam TN, Bryld LE, et al. . Safety, efficacy and drug survival of biologics and biosimilars for moderate-to-Severe plaque psoriasis. Br J Dermatol (2018) 178(2):509–19. doi: 10.1111/bjd.16102 - DOI - PubMed

Substances