. 2023 Jul;41(7):1449-1463.
doi: 10.1002/jor.25505. Epub 2022 Dec 25.

Evaluation of lesion and overlying articular cartilage in patients with juvenile osteochondritis dissecans of the knee using quantitative diffusion MRI

Affiliations

Evaluation of lesion and overlying articular cartilage in patients with juvenile osteochondritis dissecans of the knee using quantitative diffusion MRI

Štefan Zbýň et al. J Orthop Res. 2023 Jul.

Abstract

Current clinical MRI of patients with juvenile osteochondritis dissecans (JOCD) is limited by the low reproducibility of lesion instability evaluation and inability to predict which lesions will heal after nonoperative treatment and which will later require surgery. The aim of this study is to verify the ability of apparent diffusion coefficient (ADC) to detect differences in lesion microstructure between different JOCD stages, treatment groups, and healthy, unaffected contralateral knees. Pediatric patients with JOCD received quantitative diffusion MRI between January 2016 and September 2020 in this prospective research study. A disease stage (I-IV) and stability of each JOCD lesion was evaluated. ADCs were calculated in progeny lesion, interface, parent bone, cartilage overlying lesion, control bone, and control cartilage regions. ADC differences were evaluated using linear mixed models with Bonferroni correction. Evaluated were 30 patients (mean age, 13 years; 21 males), with 40 JOCD-affected and 12 healthy knees. Nine patients received surgical treatment after MRI. Negative Spearman rank correlations were found between ADCs and JOCD stage in the progeny lesion (ρ = -0.572; p < 0.001), interface (ρ = -0.324; p = 0.041), and parent bone (ρ = -0.610; p < 0.001), demonstrating the sensitivity of ADC to microstructural differences in lesions at different JOCD stages. We observed a significant increase in the interface ADCs (p = 0.007) between operative (mean [95% CI] = 1.79 [1.56-2.01] × 10-3 mm2 /s) and nonoperative group (1.27 [0.98-1.57] × 10-3 mm2 /s). Quantitative diffusion MRI detects microstructural differences in lesions at different stages of JOCD progression towards healing and reveals differences between patients assigned for operative versus nonoperative treatment.

Keywords: juvenile osteochondritis dissecans; knee joint; magnetic resonance imaging; osteochondral lesion; quantitative diffusion MRI.


Figures

Figure 1:
Figure 1:
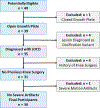
Flowchart of study population.
Figure 2:
Figure 2:
An example diffusion-weighted imaging data of a 13-year-old boy with a stable, stage II JOCD lesion situated on the medial femoral condyle (between arrows). (a) A short echo time gradient echo image with inverted (CT-like) contrast showing stage II lesion (between arrows) with the progeny rim ossification (high signal) and cartilaginous areas (low signal) within the lesion. (b) The proton density-weighted turbo spin echo image with fat suppression depicts stable lesion with a mild hyper-intense edema in the parent bone. (c) The proton density-weighted turbo spin echo image is depicting the replacement of normal fatty marrow in the JOCD lesion. (d - f) The diffusion-weighted images after postprocessing with b-values of 50, 500 and 1000 s/mm2, respectively, show increased signal intensity in the lesion. Note the higher signal intensities in the bone when compared to the noise levels outside of the knee, especially in the images with b-values of 50 and 500 s/mm2. (g) A plot depicting a representative fit of the mono-exponential function used to determine ADC values (red line) from the diffusion weighted data (black points) from a single pixel situated in the cartilage of the medial femoral condyle (fitted apparent diffusion coefficient (ADC) = 1.91×10⁻³ mm2/s; goodness of fit (adjusted R2) = 0.998). (h) A representative mono-exponential fit (blue line) from a single pixel situated in the trabecular bone of the medial femoral condyle (fitted ADC = 0.58×10⁻³ mm2/s; adjusted R2 = 0.971). (i) The corresponding color-coded ADC map shows higher ADC values, and therefore less restricted water diffusivity, in the lesion (between arrows) compared to trabecular bone on the opposite, JOCD-free femoral condyle.
Figure 3:
Figure 3:
An example of manual segmentations of the six evaluated regions on coronal MR images of a 14-year-old boy with a stable, stage III juvenile osteochondritis dissecans (JOCD) lesion on the medial femoral condyle assigned for non-operative treatment. (a) The T1-weighted turbo spin echo image is depicting the replacement of normal fatty marrow in the whole JOCD lesion complex (i.e., progeny lesion + interface + parent bone) (between arrows). (b) The T2-weighted turbo spin echo image with fat suppression shows the position of progeny lesion and its interface to parent bone (between arrows) as well as mild hyper-intense edema in the parent bone (asterisks). (c) The short echo time gradient echo image illustrates the ossified portion of the progeny lesion (arrowhead) and the parent bone region (between arrows). (d) All six evaluated regions were selected on the short echo time gradient echo image registered and matched for the resolution to diffusion-weighted images. Three regions were part of the JOCD lesion complex: progeny lesion (green), interface (red) and parent bone (cyan). Additionally, a cartilage overlying lesion region (blue), as well as a control bone (yellow) and control cartilage (magenta) regions were selected.
Figure 4:
Figure 4:
Box plots of median ADC values of all evaluated regions from all juvenile osteochondritis dissecans (JOCD) stages. All statistical evaluations were calculated using linear mixed models, with age and region area as covariates, and corrected for multiple comparisons with Bonferroni correction. Statistically significant differences are marked with asterisk (*). The picture in the center shows the typical position of segmented regions on the JOCD affected femoral condyle (regions 1–4) and on the opposite, JOCD-free condyle (control regions 5 and 6). In each box plot, the central horizontal line is the median ADC value for the given region and JOCD stage. The upper and lower whiskers extend to the maximum and minimum ADC values, respectively. The upper and lower borders of the box represent the third quartile (i.e., 75th percentile) and the first quartile (i.e., 25th percentile) of the ADC data, respectively. Circles represents values that are more than 1.5-times of interquartile range above the third quartile or below the first quartile which are considered outliers.
Figure 5:
Figure 5:
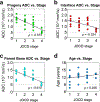
Regression analysis plots. (a) Spearman rank correlation (ρ) showed a significant negative correlation between ADC values in the progeny lesion and the Juvenile Osteochondritis Dissecans (JOCD) stages I to III (ρ = −0.497; 95% confidence interval (CI) = −0.761, −0.092; p= 0.014). (b) However, no significant correlation was found between the interface ADC values and the JOCD stages I to III (ρ = −0.039; 95% CI = −0.364, 0.370; p= 0.855). (c) Similarly, ADC values in the parent bone were also not significantly correlated with the JOCD stages I-III (ρ = −0.276; 95% CI = −0.616, −0.151; p= 0.192). (d) We did not find any significant association between the patient’s age and the JOCD stage (ρ = 0.186; 95% CI = −0.190, 0.514; p = 0.325).
Figure 6:
Figure 6:
An example of a healed, stage IV JOCD lesion situated on the medial femoral condyle (between arrows) of a 13-year-old boy. (a) The T1-weighted turbo spin echo image is showing a hypointense JOCD lesion area with the replacement of normal fatty marrow. (b) The short echo time gradient echo image with CT-like contrast showing healed, ossified JOCD lesion (between arrows). (c) The corresponding color-coded apparent diffusion coefficient (ADC) map with six segmented regions in white or black contours: progeny lesion, interface, parent bone, and overlying cartilage on the JOCD-affected condyle, as well as control bone and control cartilage on the opposite condyle. ADC values in the lesion regions and in the underlying cartilage are similar to the values in the control bone and cartilage on the contralateral condyle. A higher magnification image of the JOCD lesion area is shown in the lower right corner of each image. The color bars represent ADC values in 10−3 mm2/s.
Figure 7:
Figure 7:
A comparison of stable and unstable stage II juvenile osteochondritis dissecans (JOCD) lesions. (a) A 13-year-old girl with a stable JOCD lesion on the medial femoral condyle assigned for non-operative treatment. From left to right: (i) a T2-weighted turbo spin echo image with fat suppression depicts the lesion location (between arrows) and a mild, hyper-intense area of edema in the parent bone; (ii) a short echo time gradient echo image with CT-like contrast showing the progeny rim ossification (high signal) and cartilaginous areas within the progeny lesion and interface (low signal); (iii); a diffusion-weighted image (b=50 s/mm2) demonstrates increased signal in the parent bone due to bone marrow edema that induces longer T2 relaxation time than in normal bone marrow; and (iv) a color-coded ADC map with four evaluated regions in the JOCD-affected condyle (black contours) and two regions in the opposite healthy femoral condyle (black and white contours). (b) A 12-year-old girl with an unstable JOCD lesion on the medial femoral condyle assigned for operative treatment. From left to right: (i) a T2-weighted turbo spin echo image with fat suppression depicts the lesion location (between arrows), a hyper-intense area of edema in the parent bone, a fluid-like high signal rim in the interface, and a break in the articular cartilage and the subchondral bone plate; (ii) a short echo time gradient echo image with CT-like contrast showing the rim ossification of progeny lesion (high signal) and cartilaginous areas within the progeny lesion and interface (low signal); (iii) a diffusion-weighted image (b=50 s/mm2) depicts very high signal in the interface likely due to presence of fluid with long T2 relaxation and increased signal in the parent bone caused by bone marrow edema; and (iv) a color-coded ADC map with four evaluated regions in the JOCD-affected condyle (black contours), two regions in the opposite healthy femoral condyle (black and white contours) and a high ADC values in the parent bone and the interface. A higher magnification image of the lesion area is shown in the lower right corner of each image. The color bar represents ADC values (×10−3 mm2/s).

References

    1. Laor T, Zbojniewicz AM, Eismann EA, et al. 2012. Juvenile osteochondritis dissecans: is it a growth disturbance of the secondary physis of the epiphysis? AJR Am J Roentgenol. 199:1121–1128. - PubMed
    1. Ellermann J, Johnson CP, Wang L, et al. 2017. Insights into the Epiphyseal Cartilage Origin and Subsequent Osseous Manifestation of Juvenile Osteochondritis Dissecans with a Modified Clinical MR Imaging Protocol: A Pilot Study. Radiology. 282:798–806. - PubMed
    1. Kijowski R, Blankenbaker DG, Shinki K, et al. 2008. Juvenile versus adult osteochondritis dissecans of the knee: appropriate MR imaging criteria for instability. Radiology. 248:571–578. - PubMed
    1. Kessler JI, Nikizad H, Shea KG, et al. 2014. The demographics and epidemiology of osteochondritis dissecans of the knee in children and adolescents. Am J Sports Med. 42:320–326. - PubMed
    1. Olstad K, Ekman S, Carlson CS. 2015. An Update on the Pathogenesis of Osteochondrosis. Vet Pathol. 52:785–802. - PubMed

Publication types

LinkOut - more resources