

Cryo-EM structures of human ABCA7 provide insights into its phospholipid translocation mechanisms
- PMID: 36484366
- PMCID: PMC9890230
- DOI: 10.15252/embj.2022111065
Cryo-EM structures of human ABCA7 provide insights into its phospholipid translocation mechanisms
Abstract
Phospholipid extrusion by ABC subfamily A (ABCA) exporters is central to cellular physiology, although the specifics of the underlying substrate interactions and transport mechanisms remain poorly resolved at the molecular level. Here we report cryo-EM structures of lipid-embedded human ABCA7 in an open state and in a nucleotide-bound, closed state at resolutions between 3.6 and 4.0 Å. The former reveals an ordered patch of bilayer lipids traversing the transmembrane domain (TMD), while the latter reveals a lipid-free, closed TMD with a small extracellular opening. These structures offer a structural framework for both substrate entry and exit from the ABCA7 TMD and highlight conserved rigid-body motions that underlie the associated conformational transitions. Combined with functional analysis and molecular dynamics (MD) simulations, our data also shed light on lipid partitioning into the ABCA7 TMD and localized membrane perturbations that underlie ABCA7 function and have broader implications for other ABCA family transporters.
Keywords: ABCA7; Alzheimer's disease; cryo-EM; exporter; flippase.
© 2022 The Authors. Published under the terms of the CC BY NC ND 4.0 license.
Figures
- A, B
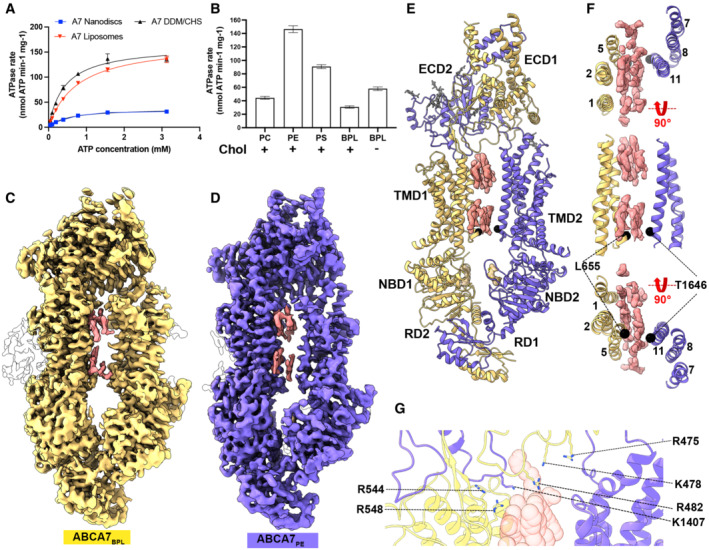
(A) ATPase activity of ABCA7 at different ATP concentrations and (B) different nanodisc phospholipid/cholesterol compositions. Cholesterol (20%) presence is indicated by + or −. Experimental replicates (n) = 3 and error bars represent standard deviation (s.d.).
- C, D
(C) Cryo‐EM map of ABCA7BPL (yellow) at 3.6 Å resolution and (D) ABCA7PE at 4.0 Å resolution (purple). Density for protein is shown in yellow (0.025 contour) and that for modeled lipid acyl chains (0.035 contour) shown in pink (TMD luminal lipids) and white (peripherally associated lipids).
- E
ABCA7PE shown in ribbon format with half 1 colored yellow and half 2 purple, along with density for TMD lipids (pink 0.025 contour) and bound nucleotide (yellow 0.035 contour). Acyl chains and glycans are shown as pink and gray sticks, respectively.
- F
TMD lumen with density for TMD lipids (pink 0.025 contour) viewed from the extracellular side (top), membrane plane (middle) and cytoplasmic side (bottom). Cα atoms for the cytoplasmic gate are shown as black spheres.
- G
View of the TMD‐ECD interface with select residues oriented toward lipids (transparent red spheres) shown.
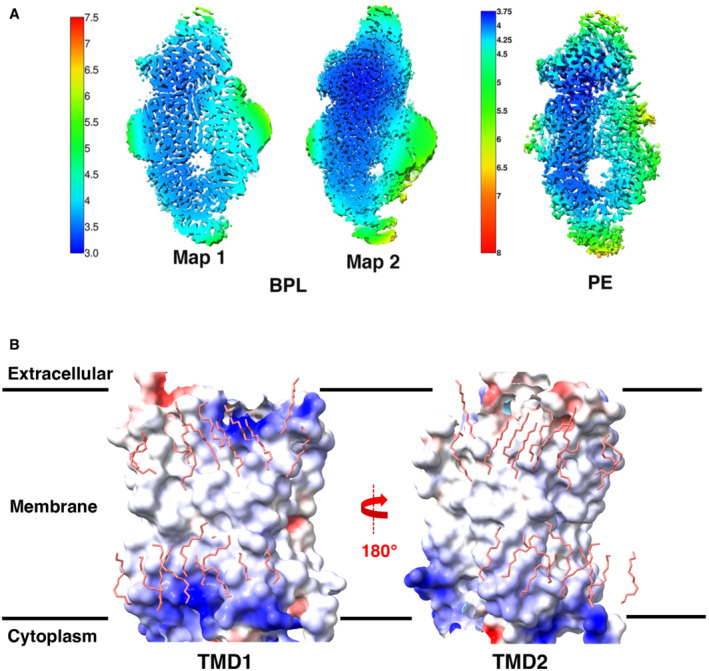
Local resolution maps of ABCA7BPL and ABCA7PE structures. Color keys are indicated on the left of each set of maps with numbers representing resolution (Å).
Analysis of TMD electrostatics of ABCA7PE with electrostatic potential maps for TMD1 (left) and TMD2 (right) shown along with modeled lipids (pink sticks).
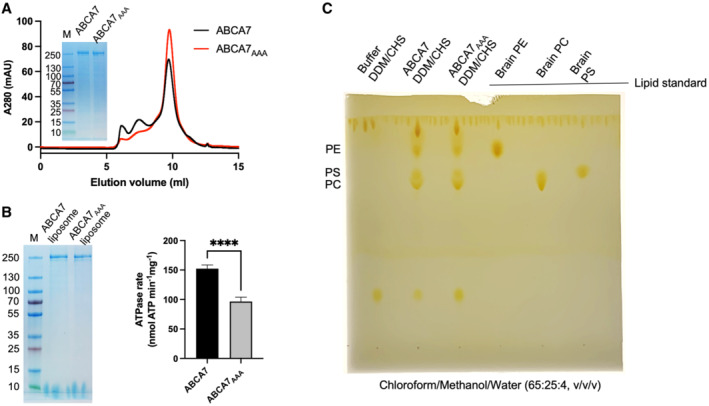
SEC chromatograms and SDS‐PAGE analysis of ABCA7 and ABCA7AAA in DDM/CHS.
SDS‐PAGE gel and ATPase activity comparison of ABCA7 and ABCA7AAA reconstituted in liposomes. Experimental replicates (n) = 6 and error bars represent standard deviation (s.d.). Statistical significance by unpaired, two‐tailed t‐test P‐value of < 0.0001 is indicated by ****.
Detection of endogenous lipids co‐purified with ABCA7 and ABCA7AAA by thin‐layer chromatography (TLC).
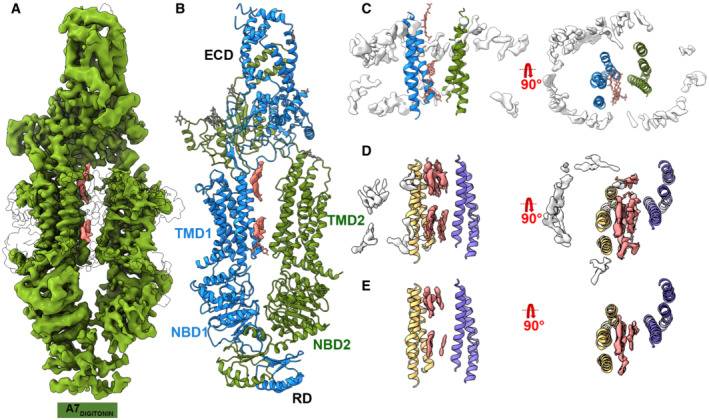
Cryo‐EM map of human ABCA7DIGITONIN at 3.9 Å with density for protein shown in green (0.013 contour) and extraneous density likely belonging to detergent shown in pink (0.013 contour).
Cryo‐EM structure of human ABCA7DIGITONIN shown in ribbon format with each half colored differently (blue and green).
TMD lumen of ABCA7DIGITONIN with density for bulk micelle shown in white at 0.015 contour where detergent density inside TMDs disappears. Sticks for unmodeled detergent molecules are shown for which density is visible at the lower contour of 0.013.
TMD lumen of ABCA7PE with density (0.035 contour) for TMD lipids (pink) and peripherally associated ordered lipids (white) shown.
Same as (D) with higher density contour of 0.046 where density of peripherally associated lipids is absent but that of luminal lipids remains.
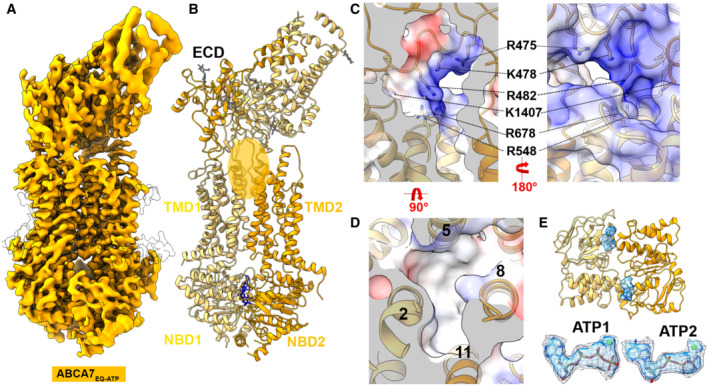
Cryo‐EM map of human ABCA7EQ‐ATP in BPL/Chol nanodiscs at 3.7 Å resolution (orange density, 0.02 contour).
Cryo‐EM structure of ABCA7EQ‐ATP shown in ribbon format with half 1 and half 2 colored yellow and orange, respectively. The transparent orange oval demarcates the observed exit pocket.
Central slice of electrostatic surface map showing surface details of exit pocket in two different orientations.
4‐TM bundle forming the exit pocket.
NBDs viewed from the extracellular side with density for bound nucleotide (sticks colored by element) shown in blue (0.02 contour). Two ATP molecules are shown with the density at two different contours 0.02 (mesh) and 0.035 (blue) at the bottom.
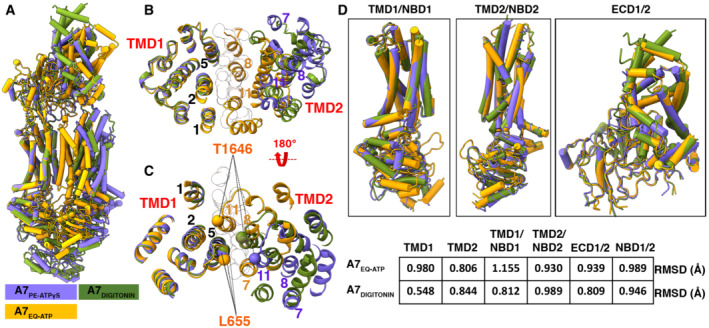
Overall structural alignment of the three ABCA7 conformations.
Overall alignment of the three ABCA7 conformations showing only TMD1 and TMD2 viewed from the extracellular side using the TMD1‐NBD1 pair as an alignment reference. TMs lining the TMD pathway are numbered, and modeled lipid acyl chains are shown as outlined white spheres.
Same as panel (B), viewed from the cytoplasmic side with Cα atoms of gate forming residues shown as spheres.
Individual alignments of rigid body pairs TMD1‐NBD1, TMD2‐NBD2, and ECD along with the Root mean square deviations (RMSD) of aligned atoms of ABCA7PE versus ABCA7EQ‐ATP and ABCA7DIGITONIN.
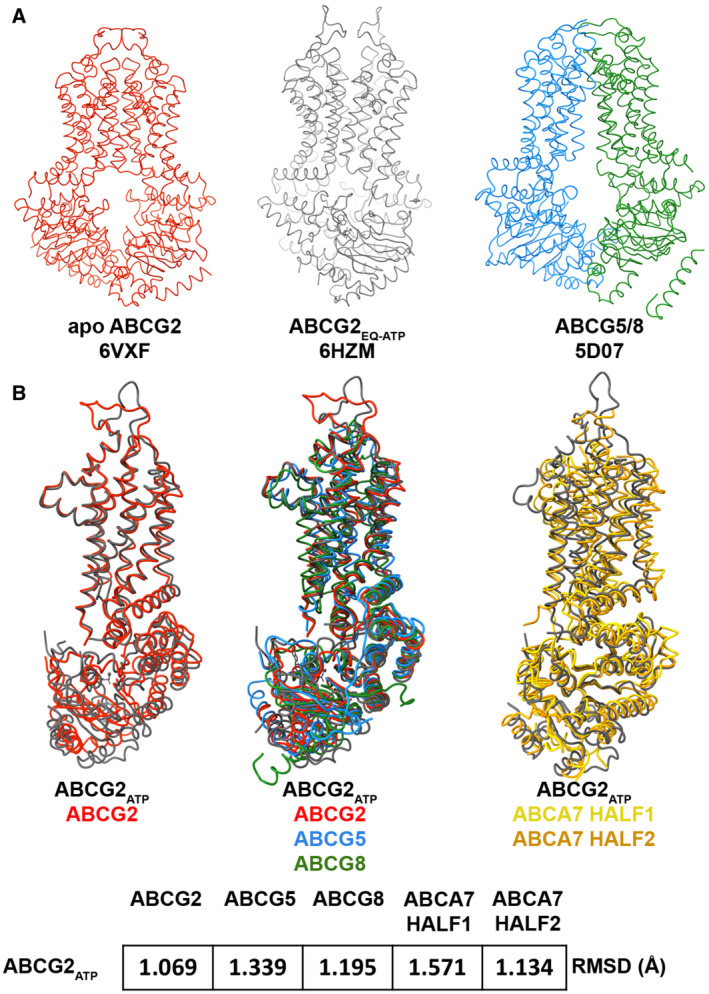
Ribbon representation of select ABCG family transporter structures and their respective PDB IDs including apo open ABCG2 (red), closed ATP‐bound structure of ABCG2EQ (black), and ABCG5/G8 (blue and green, respectively).
Alignment of NBD‐TMD pairs from open and closed conformations of ABCG2 (left), ABCG2 and ABCG5/G8 (center), and closed ABCG2 with TMD‐NBD pairs from ABCA7 half 1 (gold) and half 2 (orange) along with the root mean square deviations (RMSD) of aligned atoms shown at the bottom.
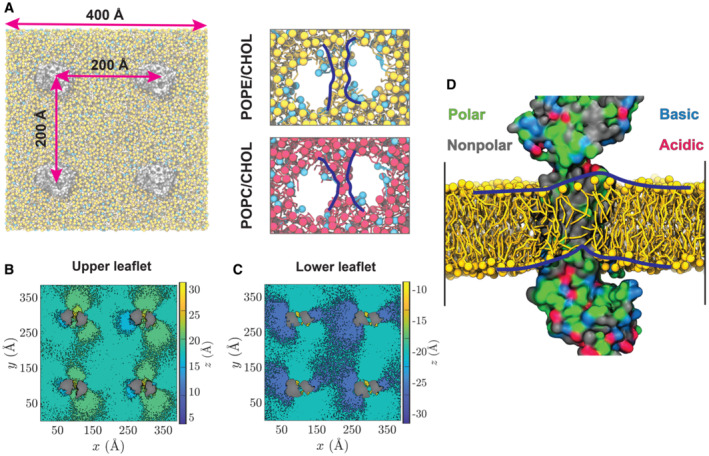
- A
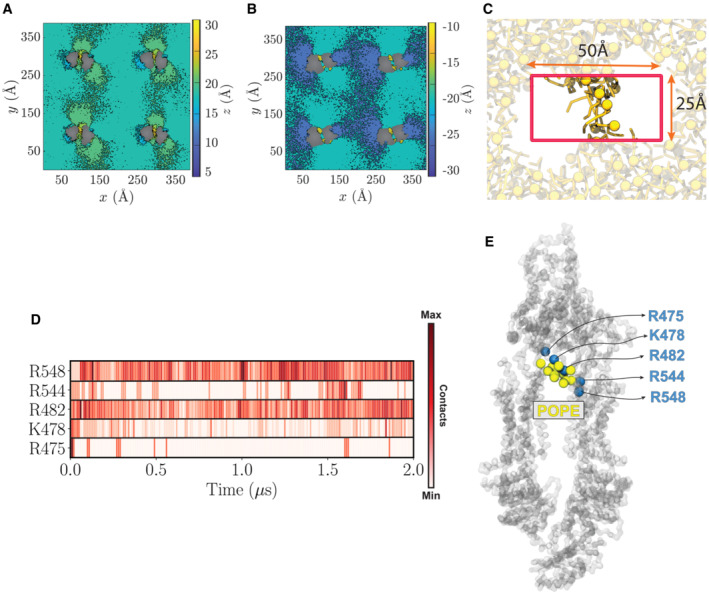
Left: A representative simulation system with four copies of ABCA7 (silver), taken from the POPE/cholesterol (yellow/cyan) lipid patch. Right: the phospholipid belt (blue lines) formed in (top) the POPE/cholesterol (yellow/cyan) and (bottom) POPC/cholesterol (red/cyan) membranes (t = 2 μs).
- B, C
Heatmaps representing the average height (z values) of POPC headgroups with respect to the membrane midplane in the extracellular/upper (B) and cytoplasmic/lower (C) leaflets. Phospholipids are observed to climb the protein and form an elevated configuration within the TMD lumen.
- D
Snapshot of lipids partitioned in the TMD lumen at t = 2 μs. Polar, nonpolar, basic, and acidic residues are colored green, gray, blue, and red, respectively. TMD2 is hidden for a clearer view of the luminal dome‐like lipid configuration (outlined by blue lines).
- A, B
POPE headgroup height calculated for extracellular (A) and cytoplasmic (B) leaflets.
- C
Dimension and position of the box used to calculate the number of phospholipids (yellow) partitioned in the TMD leaflets. The box is centered at the protein center and has dimensions of 50 and 25 Å in x and y directions, respectively. The ABCA7 transporter is hidden for clarity.
- D
Contact map, based on the number of POPE headgroups in proximity of each residue throughout the simulation.
- E
Accumulation of POPE headgroups (yellow spheres) in close proximity of most frequently contacted residues (blue spheres) throughout the simulation. All protein residues are represented as spheres (Cα atoms).
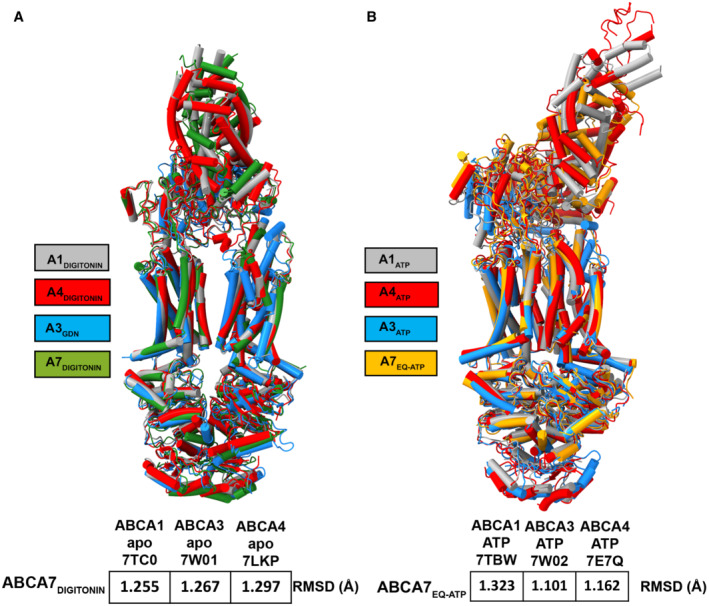
- A, B
Superposition of (A) ABCA7 (green, this manuscript), ABCA1 (gray, PDB: 7TC0), ABCA3 (blue, PDB: 7W01), and ABCA4 (red, PDB: 7LKP) structures in detergent and (B) ABCA7 (orange, this manuscript), ABCA1 (gray, PDB: 7TBW), ABCA3 (blue, PDB: 7W02), and ABCA4 (red, PDB: 7E7Q) structures in ATP‐bound states. Color keys are indicated on the left and the RMSD of aligned atoms of ABCA7 versus ABCA1, ABCA3, and ABCA4 are displayed at the bottom of each set of structures.
References
-
- Abe‐Dohmae SYS (2012) ABCA7: a potential mediator between cholesterol homeostasis and the host defense system. Clin Lipidol 7: 677–687
-
- Albrecht C, Viturro E (2007) The ABCA subfamily—gene and protein structures, functions and associated hereditary diseases. Pflugers Arch 453: 581–589 - PubMed
Publication types
MeSH terms
Substances
Grants and funding
LinkOut - more resources
Full Text Sources
