Editorial
. 2023 Feb 3;11(2):171-183.
doi: 10.1158/2326-6066.CIR-22-0333.

LEF1 Drives a Central Memory Program and Supports Antitumor Activity of Natural Killer T Cells

Affiliations
Editorial

LEF1 Drives a Central Memory Program and Supports Antitumor Activity of Natural Killer T Cells

Ho Ngai et al. Cancer Immunol Res. .

Abstract

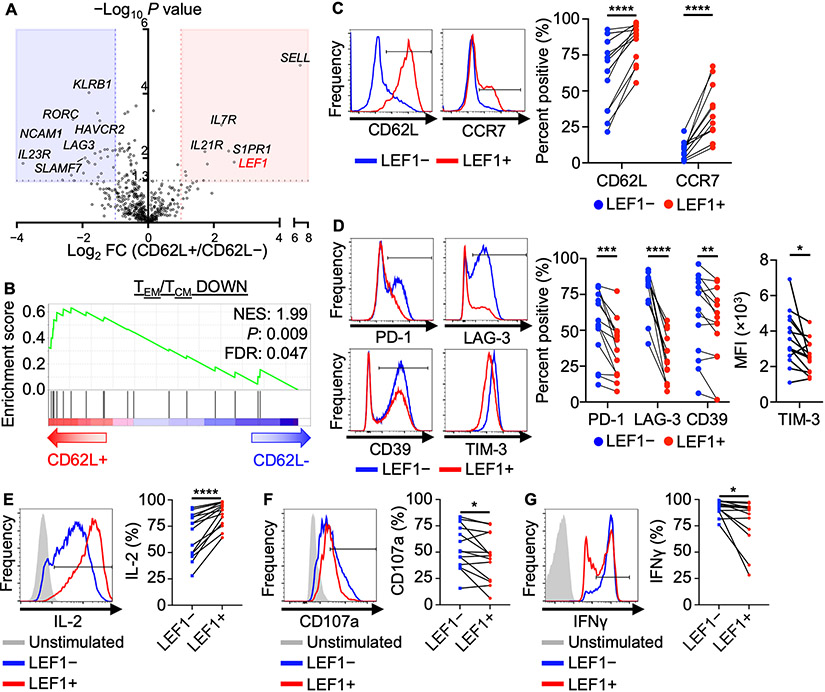
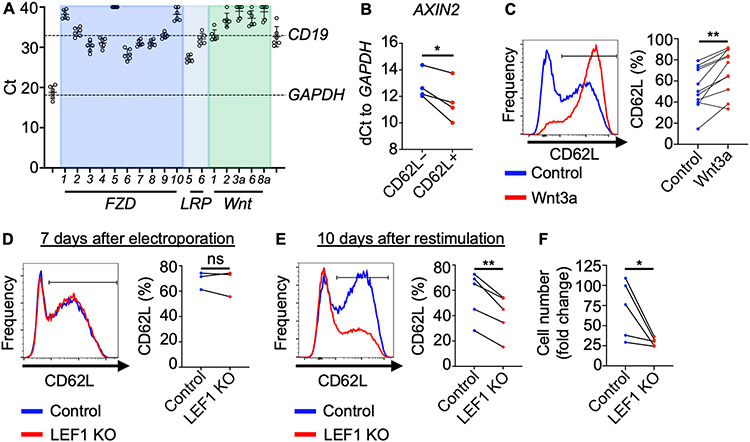
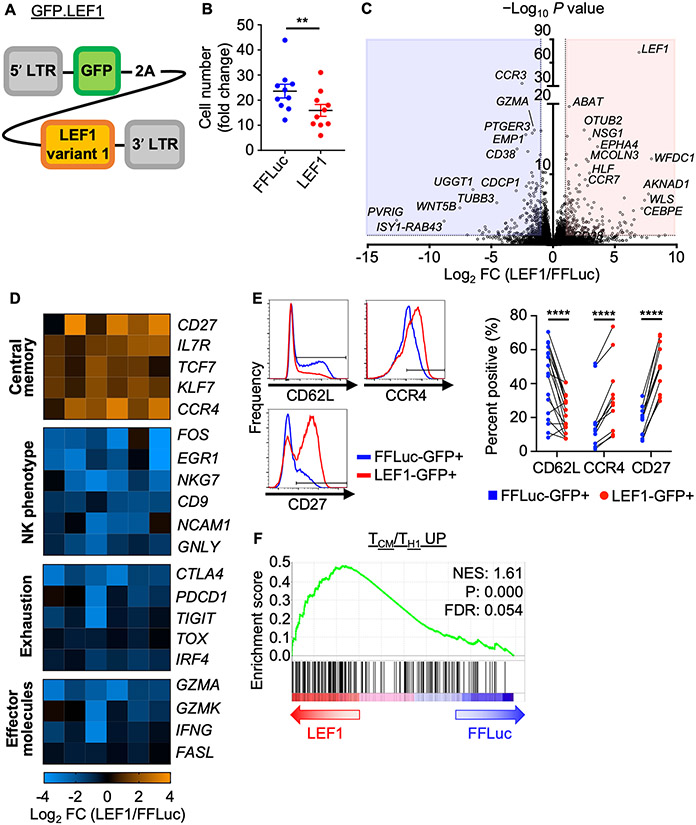
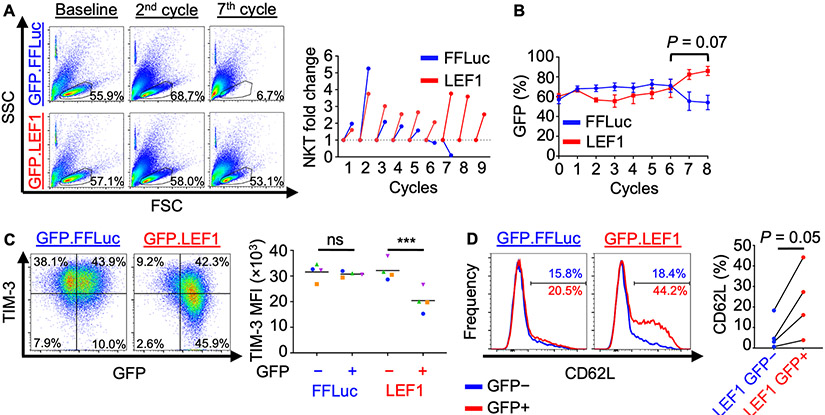
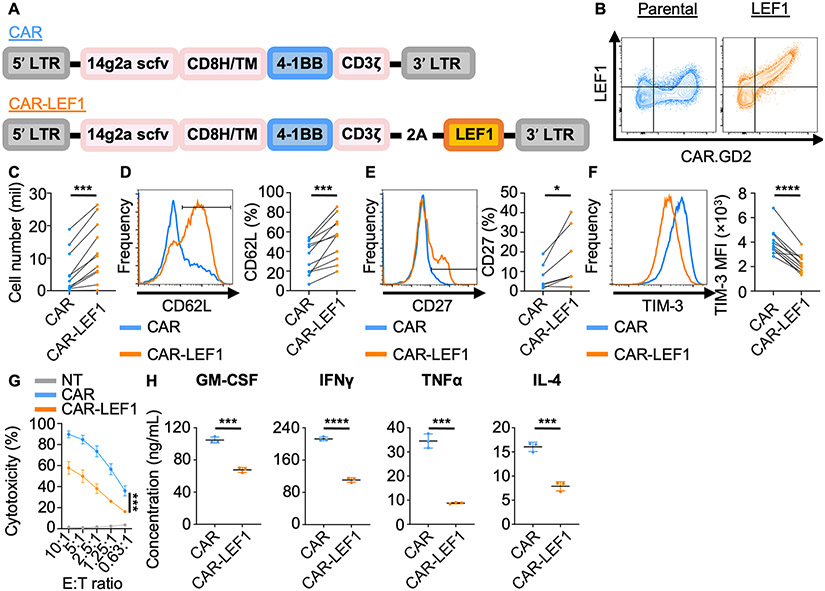
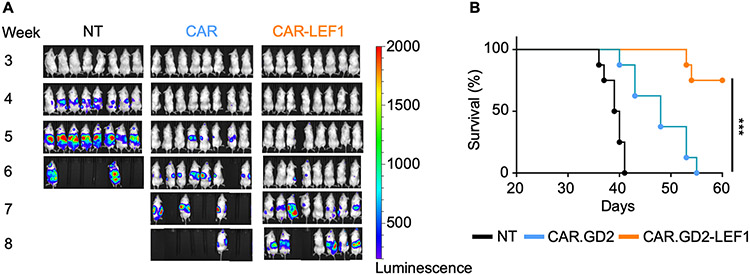
Vα24-invariant natural killer T cells (NKT) possess innate antitumor properties that can be exploited for cancer immunotherapy. We have shown previously that the CD62L+ central memory-like subset of these cells drives the in vivo antitumor activity of NKTs, but molecular mediators of NKT central memory differentiation remain unknown. Here, we demonstrate that relative to CD62L- cells, CD62L+ NKTs express a higher level of the gene encoding the Wnt/β-catenin transcription factor lymphoid enhancer binding factor 1 (LEF1) and maintain active Wnt/β-catenin signaling. CRISPR/Cas9-mediated LEF1 knockout reduced CD62L+ frequency after antigenic stimulation, whereas Wnt/β-catenin activator Wnt3a ligand increased CD62L+ frequency. LEF1 overexpression promoted NKT expansion and limited exhaustion following serial tumor challenge and was sufficient to induce a central memory-like transcriptional program in NKTs. In mice, NKTs expressing a GD2-specific chimeric-antigen receptor (CAR) with LEF1 demonstrated superior control of neuroblastoma xenograft tumors compared with control CAR-NKTs. These results identify LEF1 as a transcriptional activator of the NKT central memory program and advance development of NKT cell-based immunotherapy. See related Spotlight by Van Kaer, p. 144.


Figures

Figure 1:
Figure 1:. CD62L+ NKTs express elevated levels of Wnt transcription factor LEF1 and are phenotypically central memory–like.
A, Twelve days after primary stimulation with αGalCer-pulsed autologous PBMCs, NKTs were magnetically sorted into CD62L+ and CD62L subsets and processed for RNA isolation and Nanostring gene expression analysis. Volcano plot shows differential gene expression in CD62L+ versus CD62L NKTs with P value cutoff at 0.05. B, Gene set enrichment analysis (GSEA) plot showing enrichment for a central memory CD4+ T-cell signature (GSE11057) in CD62L+ NKTs. C-D, Twelve days after stimulation, NKTs were gated into LEF1 (blue) and LEF1+ (red) populations, and surface expression of (C) central memory markers and (D) activation/exhaustion markers were measured by flow cytometry. Representative donor histograms and paired percent positive or MFI (n = 16 donors) are shown. E–G, Ten days after stimulation, NKTs were activated by 50 ng/ml PMA and 500 ng/ml ionomycin in the presence of GolgiPlug and GolgiStop and analyzed for (E) IL2, (F) CD107a, and (G) IFNγ expression by flow cytometry. Representative histograms and paired percent positive (n = 12 donors) are shown. *P < 0.05, **P < 0.01, ***P < 0.001, ****P < 0.0001, ns: not significant, paired Student’s t test for paired result from each donor.
Figure 2:
Figure 2:. CD62L+ NKTs undergo elevated Wnt/β-catenin signaling, favoring formation of central memory-like NKTs.
A, NKTs were expanded ex vivo for 10 days and qRT-PCR was performed on isolated RNA to determine expression levels of Wnt receptor, co-receptor, and ligand mRNA. GAPDH (positive control) and CD19 (negative control) expression were used to set a range of significant Ct values. Mean ± SD are from a total of six donors. B, On day 10 of ex vivo expansion, NKTs were magnetically sorted into CD62L+ and CD62L subsets and expression of AXIN2 as Wnt target gene was determined from isolated RNA using qRT-PCR and the dCt method (n = 4 donors). C, NKTs were treated with 500 ng/mL human recombinant Wnt3a or PBS for three days following stimulation. CD62L expression was determined 10–12 days after initial TCR stimulation. Representative donor histogram and paired CD62L+ percentage (n = 11 donors) are shown. D–F, NKTs were electroporated with Cas9 only (control) or Cas9 with LEF1 gRNA. CD62L expression was analyzed by flow cytometry (D) seven days after electroporation, prior to secondary stimulation with αGalCer-pulsed B-8-2 cells (n = 3 donors), and (E) 10 days after secondary stimulation. Representative donor histograms and mean ± SEM CD62L+ percentage (n = 5 donors) are shown. (F) NKT number was measured 10 days after secondary stimulation, and expansion fold change was calculated from day 0. Mean fold change ± SEM (n = 5 donors) is shown. *P < 0.05, **P < 0.01, ns: not significant, paired Student’s t test for paired result from each donor.
Figure 3:
Figure 3:. LEF1 overexpression promotes a central memory–like program in human NKTs.
A, Design of the GFP.LEF1 gammaretroviral construct for overexpression of LEF1 long isoform. B–F, NKTs underwent 10 days of primary expansion followed by restimulation with αGalCer-pulsed B-8-2 cells. They were then transduced with the GFP.LEF1 construct or GFP.FFLuc two days after secondary stimulation and phenotypes were studied eight days later. (B) Cell number was determined and fold change was calculated relative to input cell number. Mean ± SEM (n = 10 donors) are shown. **P < 0.01, paired Student’s t test. (C) GFP+ cells were FACS sorted from GFP.FFluc and GFP.LEF1 NKTs. RNA isolated from the sorted cells was processed for bulk RNAseq analysis. Volcano plot shows differential gene expression (LEF1/FFLuc) with P value cutoff at 0.05 and fold change ≤ −2 / ≥ 2. (D) Differentially expressed genes of interest from (C) were grouped by shared phenotype/function. Heat maps show fold change in expression (LEF1/FFLuc). Each column represents a donor with a total of six donors tested; false discovery rate (FDR) < 0.05 (FDR < 0.20 for PDCD1) in LEF1-GFP+ and FFLuc-GFP+ cells. (E) Surface expression of central memory markers on GFP+ cells from FFLuc- or LEF1-transduced NKTs were measured by flow cytometry. Representative donor histograms and paired percent positive (n ≥ 11 donors) are shown. **P < 0.01, ****P < 0.0001, paired Student’s t test for paired result from each donor. (F) GSEA plot showing enrichment for a central memory T–cell signature in LEF1-overexpressing NKTs.
Figure 4:
Figure 4:. Overexpression of LEF1 improves NKT expansion and tumor control and reduces exhaustion following serial tumor challenge.
A–E, NKTs transduced with GFP.FFLuc or GFP.LEF1 were repeatedly challenged with CD1d+ J32 leukemia cells at a 1:1 ratio every three days. (A) NKT cell number was determined using counting beads and flow cytometry following each challenge cycle. FSC-SSC dot plots show approximate live cell gate representing NKTs at early (2nd) and late (7th) co-culture cycles. Results from a representative donor (n = 4 donors, two independent experiments) and NKT fold-change at each cycle are shown. (B) GFP expression was monitored over time using flow cytometry as a proxy for transduced cells. Mean GFP+ NKT percentage ± SEM is shown at each cycle (n = 4 donors). P = 0.07 for AUC analysis for cycles 6 to 8. C, D, Following cycle 5, NKTs were rested for six days following antigenic stimulation and (C) TIM-3 and (D) CD62L expression were assessed by flow cytometry. Representative results and mean TIM-3 MFI or CD62L percentage (n = 4 donors) are shown. ***P < 0.001, ns: not significant, one-way ANOVA with Sidak’s post-test.
Figure 5:
Figure 5:. Incorporation of LEF1 into CAR.GD2 construct mitigates exhaustion and suppresses immediate effector function of transduced NKTs.
A, CAR constructs containing the anti-GD2 14g2a scFv, CD8 hinge and transmembrane domains, 4-1BB co-stimulatory domain, and CD3 zeta domain, with LEF1 following a 2A sequence (CAR-LEF1) or without (CAR). B–G, Two days after secondary stimulation with αGalCer-pulsed aAPCs, NKTs were transduced with parental or LEF1-containing CAR.GD2 constructs and phenotypes were studied eight days after. (B) Surface CAR and intracellular LEF1 expression were determined by flow cytometry. Representative dot plots show LEF1 expression relative to CAR expression from one of two donors. (C) NKT cell number was determined by trypan blue exclusion assay. Mean cell count ± SEM (n = 11 donors) is shown. (D) CD62L, (E) CD27, and (F) TIM-3 expression were assessed by flow cytometry in CAR+-gated NKTs. Representative histograms and mean ± SEM of CD62L, CD27 percentage or TIM-3 MFI (n = 11 donors) are shown. *P < 0.05, ***P < 0.001, ****P < 0.0001, paired Student’s t test for paired result from each donor. (G) Luciferase-transduced GD2+ CHLA-255 cells were co-cultured with CAR or CAR-LEF1 NKTs for four hours. Cytotoxicity was calculated from luminescence intensity using non-transduced (NT) NKTs as control. Results are from five donors tested in two independent experiments. Mean ± SEM is shown. ***P < 0.001 for AUC analysis between CAR and CAR-LEF1 groups. H, CAR and CAR-LEF1 NKTs were stimulated with GD2+ CHLA-255 cells, and supernatants were collected at 24 hours. GM-CSF, IFNγ, TNFα, and IL4 levels were measured by Luminex assay. Results are from one of two donors tested with similar results. ***P < 0.001, ****P < 0.0001, unpaired Student’s t test.
Figure 6:
Figure 6:. CAR-LEF1 NKTs have superior in vivo therapeutic activity versus parental CAR.GD2 NKTs.
A, NKTs were expanded with IL2 and transduced with either CAR.GD2 (CAR) or CAR.GD2-LEF1 (CAR-LEF1), with a non-transduced (NT) control group. NSG mice (n = 8 mice per group) were i.v. injected with 1 x 10⁶ luciferase-transduced CHLA-255 cells on day 0. On day 7, mice received an i.v. injection of NT, CAR, or CAR-LEF1 NKT preparations (4 x 10⁶ CAR+ cells per mouse). IL2 was injected i.p. three times a week for two weeks after NKT injection. Tumor growth was monitored using bioluminescence imaging once per week. One experiment was performed. B, A survival plot was generated using the Kaplan–Meier method. Differences in survival probability were compared using the log-rank test. ***P < 0.001.

Comment in

Similar articles

Cited by

References

    1. Godfrey DI, MacDonald HR, Kronenberg M, Smyth MJ, Van Kaer L. NKT cells: what's in a name? Nat Rev Immunol 2004;4(3):231–7 doi 10.1038/nri1309. - DOI - PubMed
    1. Metelitsa LS, Wu HW, Wang H, Yang Y, Warsi Z, Asgharzadeh S, et al. Natural killer T cells infiltrate neuroblastomas expressing the chemokine CCL2. J Exp Med 2004;199(9):1213–21 doi 10.1084/jem.20031462. - DOI - PMC - PubMed
    1. Song L, Asgharzadeh S, Salo J, Engell K, Wu HW, Sposto R, et al. Valpha24-invariant NKT cells mediate antitumor activity via killing of tumor-associated macrophages. J Clin Invest 2009;119(6):1524–36 doi 10.1172/jci37869. - DOI - PMC - PubMed
    1. Cortesi F, Delfanti G, Grilli A, Calcinotto A, Gorini F, Pucci F, et al. Bimodal CD40/Fas-Dependent Crosstalk between iNKT Cells and Tumor-Associated Macrophages Impairs Prostate Cancer Progression. Cell Rep 2018;22(11):3006–20 doi 10.1016/j.celrep.2018.02.058. - DOI - PubMed
    1. Tachibana T, Onodera H, Tsuruyama T, Mori A, Nagayama S, Hiai H, et al. Increased intratumor Valpha24-positive natural killer T cells: a prognostic factor for primary colorectal carcinomas. Clin Cancer Res 2005;11(20):7322–7 doi 10.1158/1078-0432.Ccr-05-0877. - DOI - PubMed

Publication types