. 2022 Dec 20;23(1):168-181.
doi: 10.1039/d2lc00686c.

Multiplexed fluidic circuit board for controlled perfusion of 3D blood vessels-on-a-chip

Affiliations

Multiplexed fluidic circuit board for controlled perfusion of 3D blood vessels-on-a-chip

Mees N S de Graaf et al. Lab Chip. .

Abstract

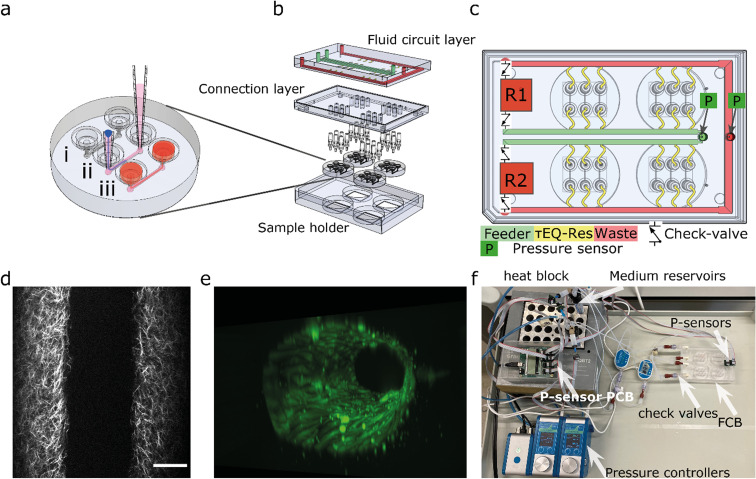
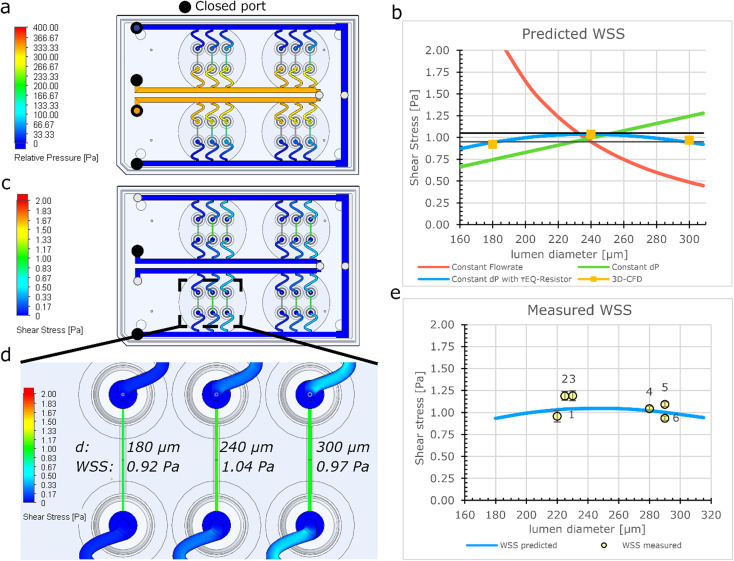
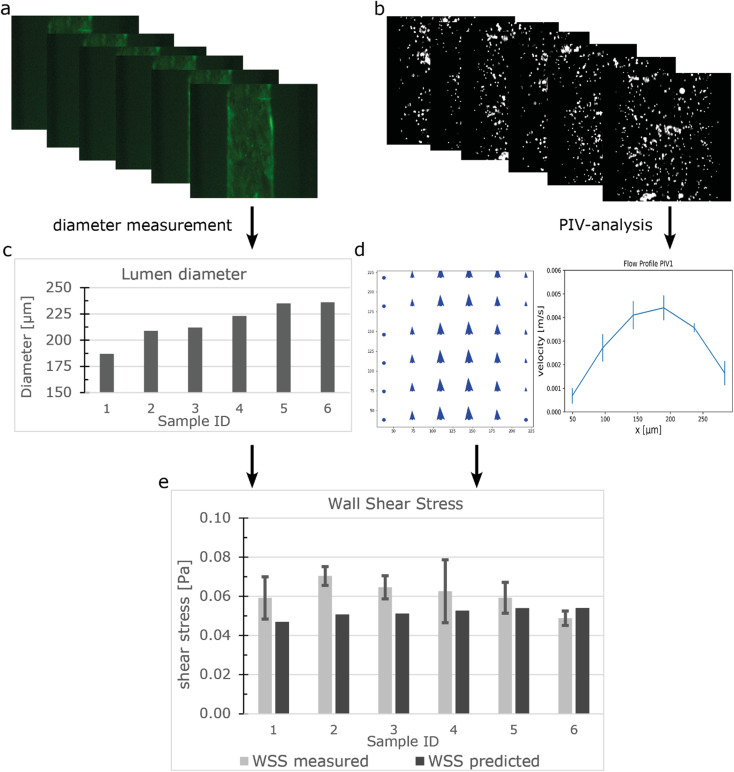
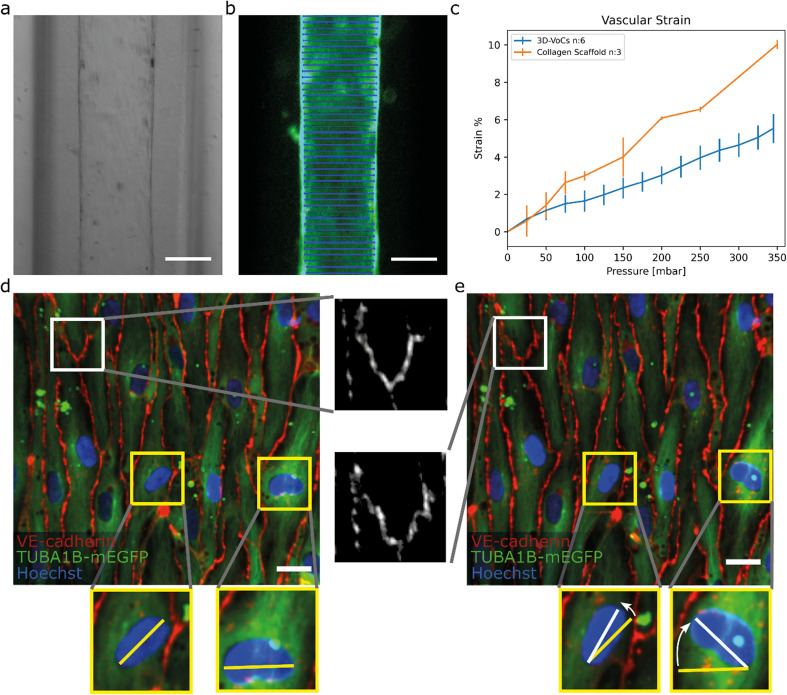
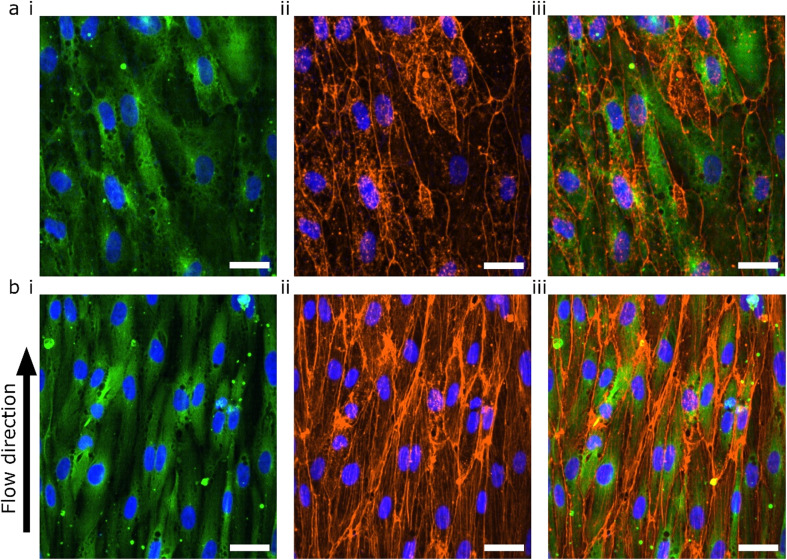
Three-dimensional (3D) blood vessels-on-a-chip (VoC) models integrate the biological complexity of vessel walls with dynamic microenvironmental cues, such as wall shear stress (WSS) and circumferential strain (CS). However, these parameters are difficult to control and are often poorly reproducible due to the high intrinsic diameter variation of individual 3D-VoCs. As a result, the throughput of current 3D systems is one-channel-at-a-time. Here, we developed a fluidic circuit board (FCB) for simultaneous perfusion of up to twelve 3D-VoCs using a single set of control parameters. By designing the internal hydraulic resistances in the FCB appropriately, it was possible to provide a pre-set WSS to all connected 3D-VoCs, despite significant variation in lumen diameters. Using this FCB, we found that variation of CS or WSS induce morphological changes to human induced pluripotent stem cell (hiPSC)-derived endothelial cells (ECs) and conclude that control of these parameters using a FCB is necessary to study 3D-VOCs.


Conflict of interest statement

The authors declare no conflict of interest.

Figures

Fig. 1
Fig. 1. Design of the microfluidic system (a) the round microfluidic devices contain 3 microfluidic channels: (i) microfluidic channels are 1.1 cm long and 500 × 500 μm (wxh); (ii) VFP consists of injection of a viscous collagen mixture (pink) into the channel followed by a droplet of PBS; (iii) pipette-tips are removed and cells can be seeded. (b) Expanded view of the fluidic circuit board, which consists of a fluidic circuit top-layer, a connection layer housing the luer-to-1/16′ barb connectors to four individual devices. (c) The fluidic circuit contains two medium reservoirs (R1,R2) connected to pressure controllers (not shown), a feeder channel (green), τEQ-resistors (yellow) and a waste channel (red) check valves are located at the medium reservoirs so recirculation can be achieved by switching high- and low pressure between the reservoirs. (d) 2p-SHG image shows the collagen fibrillar structure that reveals the lumen. (e) 3D reconstruction of TUBA1B-eGFP-ECs used for this study. (f) Photograph of the tested fluidic circuit board, connected to the external medium reservoirs in a heat block. Scalebar 100 μm.
Fig. 2
Fig. 2. Numerical model of fluidic parameters on a FCB (a) CFD- simulation of the pressure distribution indicates an equal pressure difference over the feeder channel and waste channel along the full length. (b) Modelling WSS using electrical circuit analogy shows high diameter dependence of WSS to flow rate (red plot), linear relationship with fixed pressure (green plot), parabolic relationship when using τEQ-resistance and a fixed pressure (blue plot). This parabolic behaviour narrows the variation over a wide diameter range to 10% difference between the minimum and maximum values compared to a 4-fold or 60% in the other situations. (c) 3D-CFD-simulation of WSS demonstrates that all 3D-VoCs on the fluidic board show similar WSS distribution. (d) Detailed CFD-model of the individual 3D-VoCs having 180 μm (left) 240 μm (middle) and 300 μm (right) shows similar values for WSS across the extremes of diameter. (e) Measured WSS using an optimum τEQ resistor and a ΔP of 3.3 mbar shows a comparable trend as the model value error bars show standard deviation of a 5 second average.
Fig. 3
Fig. 3. Measuring the flow distribution and WSS using μPIV (a) GFP signal from hiPSC-ECs in the lumens was captured using widefield microscopy. (b) Fluorescent beads were perfused and beads displacement was captured with 286 fps. (c) Luminal diameter was measured. (d) Vector fields were constructed using the beads displacements and the maximum velocity was determined at the Centre of the lumen. (e) WSS was calculated using the diameter and velocity profile. Error bars show 99% confidence interval of a vector field.
Fig. 4
Fig. 4. TUBA1B-hiPSC-ECs under circumferential strain (a) brightfield image of a 3D-VoCs in a 500 μm wide fluidic channel. (b) GFP-fluorescent signal of a lumen measured using the VasoTracker software (blue lines). (c) Strain curve of the 2p-SHG scaffold only and seeded scaffolds using the widefield fluorescent signal shows a significant effect of the endothelial monolayer, bars are 99% ci. (d) Confocal reconstruction of live TUBA1B-eGFP-ECs (green) co-stained for adherens junctional marker (VE-cadherin, in red) and nuclei (Hoechst, in blue) at pressure = 0 mbar, white zoomed panel show continuous adherens junctions and yellow zoomed-panels show non-aligned nuclei. (e) Confocal reconstruction of the same region at pressure = 345 mbar shows rapid alignment of unaligned cell nuclei, adherens junctions show the formation of a zig-zag pattern, implying overstretching of the cellular monolayer without rupturing. Scalebar: a and b, 150 μm; d and e 20 μm (see also Videos S5–S8 for the animated Videos).
Fig. 5
Fig. 5. Confocal microscopy of TUBA1B-hiPSC-ECs under WSS (a) hiPSC-ECs cultured in static conditions for 72 hours. (b) hiPSC-ECs cultured in static conditions for 48 hours and 24 hours under 0.3 Pa WSS. Representative images of 7 individual lumens are shown with (i) TUBA1B-eGFP-ECs (green) co-stained for (ii) F-actin (orange) and (iii) merged image. Nuclei are visualized with DAPI (blue) in all images. Scale bars 30 μm.

References

    1. Jambusaria A. Hong Z. Zhang L. Srivastava S. Jana A. Toth P. T. Dai Y. Malik A. B. Rehman J. eLife. 2020;9:e51413. doi: 10.7554/eLife.51413. - DOI - PMC - PubMed
    1. Reiterer M. Branco C. M. FEBS J. 2020;287:1088–1100. doi: 10.1111/febs.15143. - DOI - PMC - PubMed
    1. Wang K. C. Yeh Y. T. Nguyen P. Limqueco E. Lopez J. Thorossian S. Guan K. L. Li Y. J. Chien S. Proc. Natl. Acad. Sci. U. S. A. 2016;113:11525–11530. doi: 10.1073/pnas.1613121113. - DOI - PMC - PubMed
    1. Sheinberg D. L. McCarthy D. J. Elwardany O. Bryant J. P. Luther E. Chen S. H. Thompson J. W. Starke R. M. Neurosurgical focus. 2019;47:E3. - PubMed
    1. Joffre J. Hellman J. Ince C. Ait-Oufella H. Am. J. Respir. Crit. Care Med. 2020;202:361–370. doi: 10.1164/rccm.201910-1911TR. - DOI - PubMed

Publication types