

Trends in Risk Factors and Symptoms Associated With SARS-CoV-2 and Rhinovirus Test Positivity in King County, Washington, June 2020 to July 2022
- PMID: 36484987
- PMCID: PMC9856230
- DOI: 10.1001/jamanetworkopen.2022.45861
Trends in Risk Factors and Symptoms Associated With SARS-CoV-2 and Rhinovirus Test Positivity in King County, Washington, June 2020 to July 2022
Abstract
Importance: Few US studies have reexamined risk factors for SARS-CoV-2 positivity in the context of widespread vaccination and new variants or considered risk factors for cocirculating endemic viruses, such as rhinovirus.
Objectives: To evaluate how risk factors and symptoms associated with SARS-CoV-2 test positivity changed over the course of the pandemic and to compare these with the risk factors associated with rhinovirus test positivity.
Design, setting, and participants: This case-control study used a test-negative design with multivariable logistic regression to assess associations between SARS-CoV-2 and rhinovirus test positivity and self-reported demographic and symptom variables over a 25-month period. The study was conducted among symptomatic individuals of all ages enrolled in a cross-sectional community surveillance study in King County, Washington, from June 2020 to July 2022.
Exposures: Self-reported data for 15 demographic and health behavior variables and 16 symptoms.
Main outcomes and measures: Reverse transcription-polymerase chain reaction-confirmed SARS-CoV-2 or rhinovirus infection.
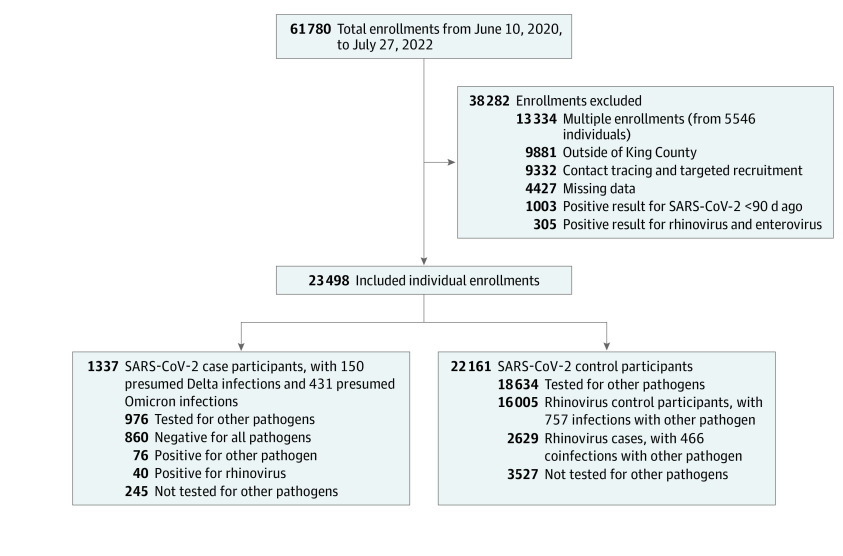
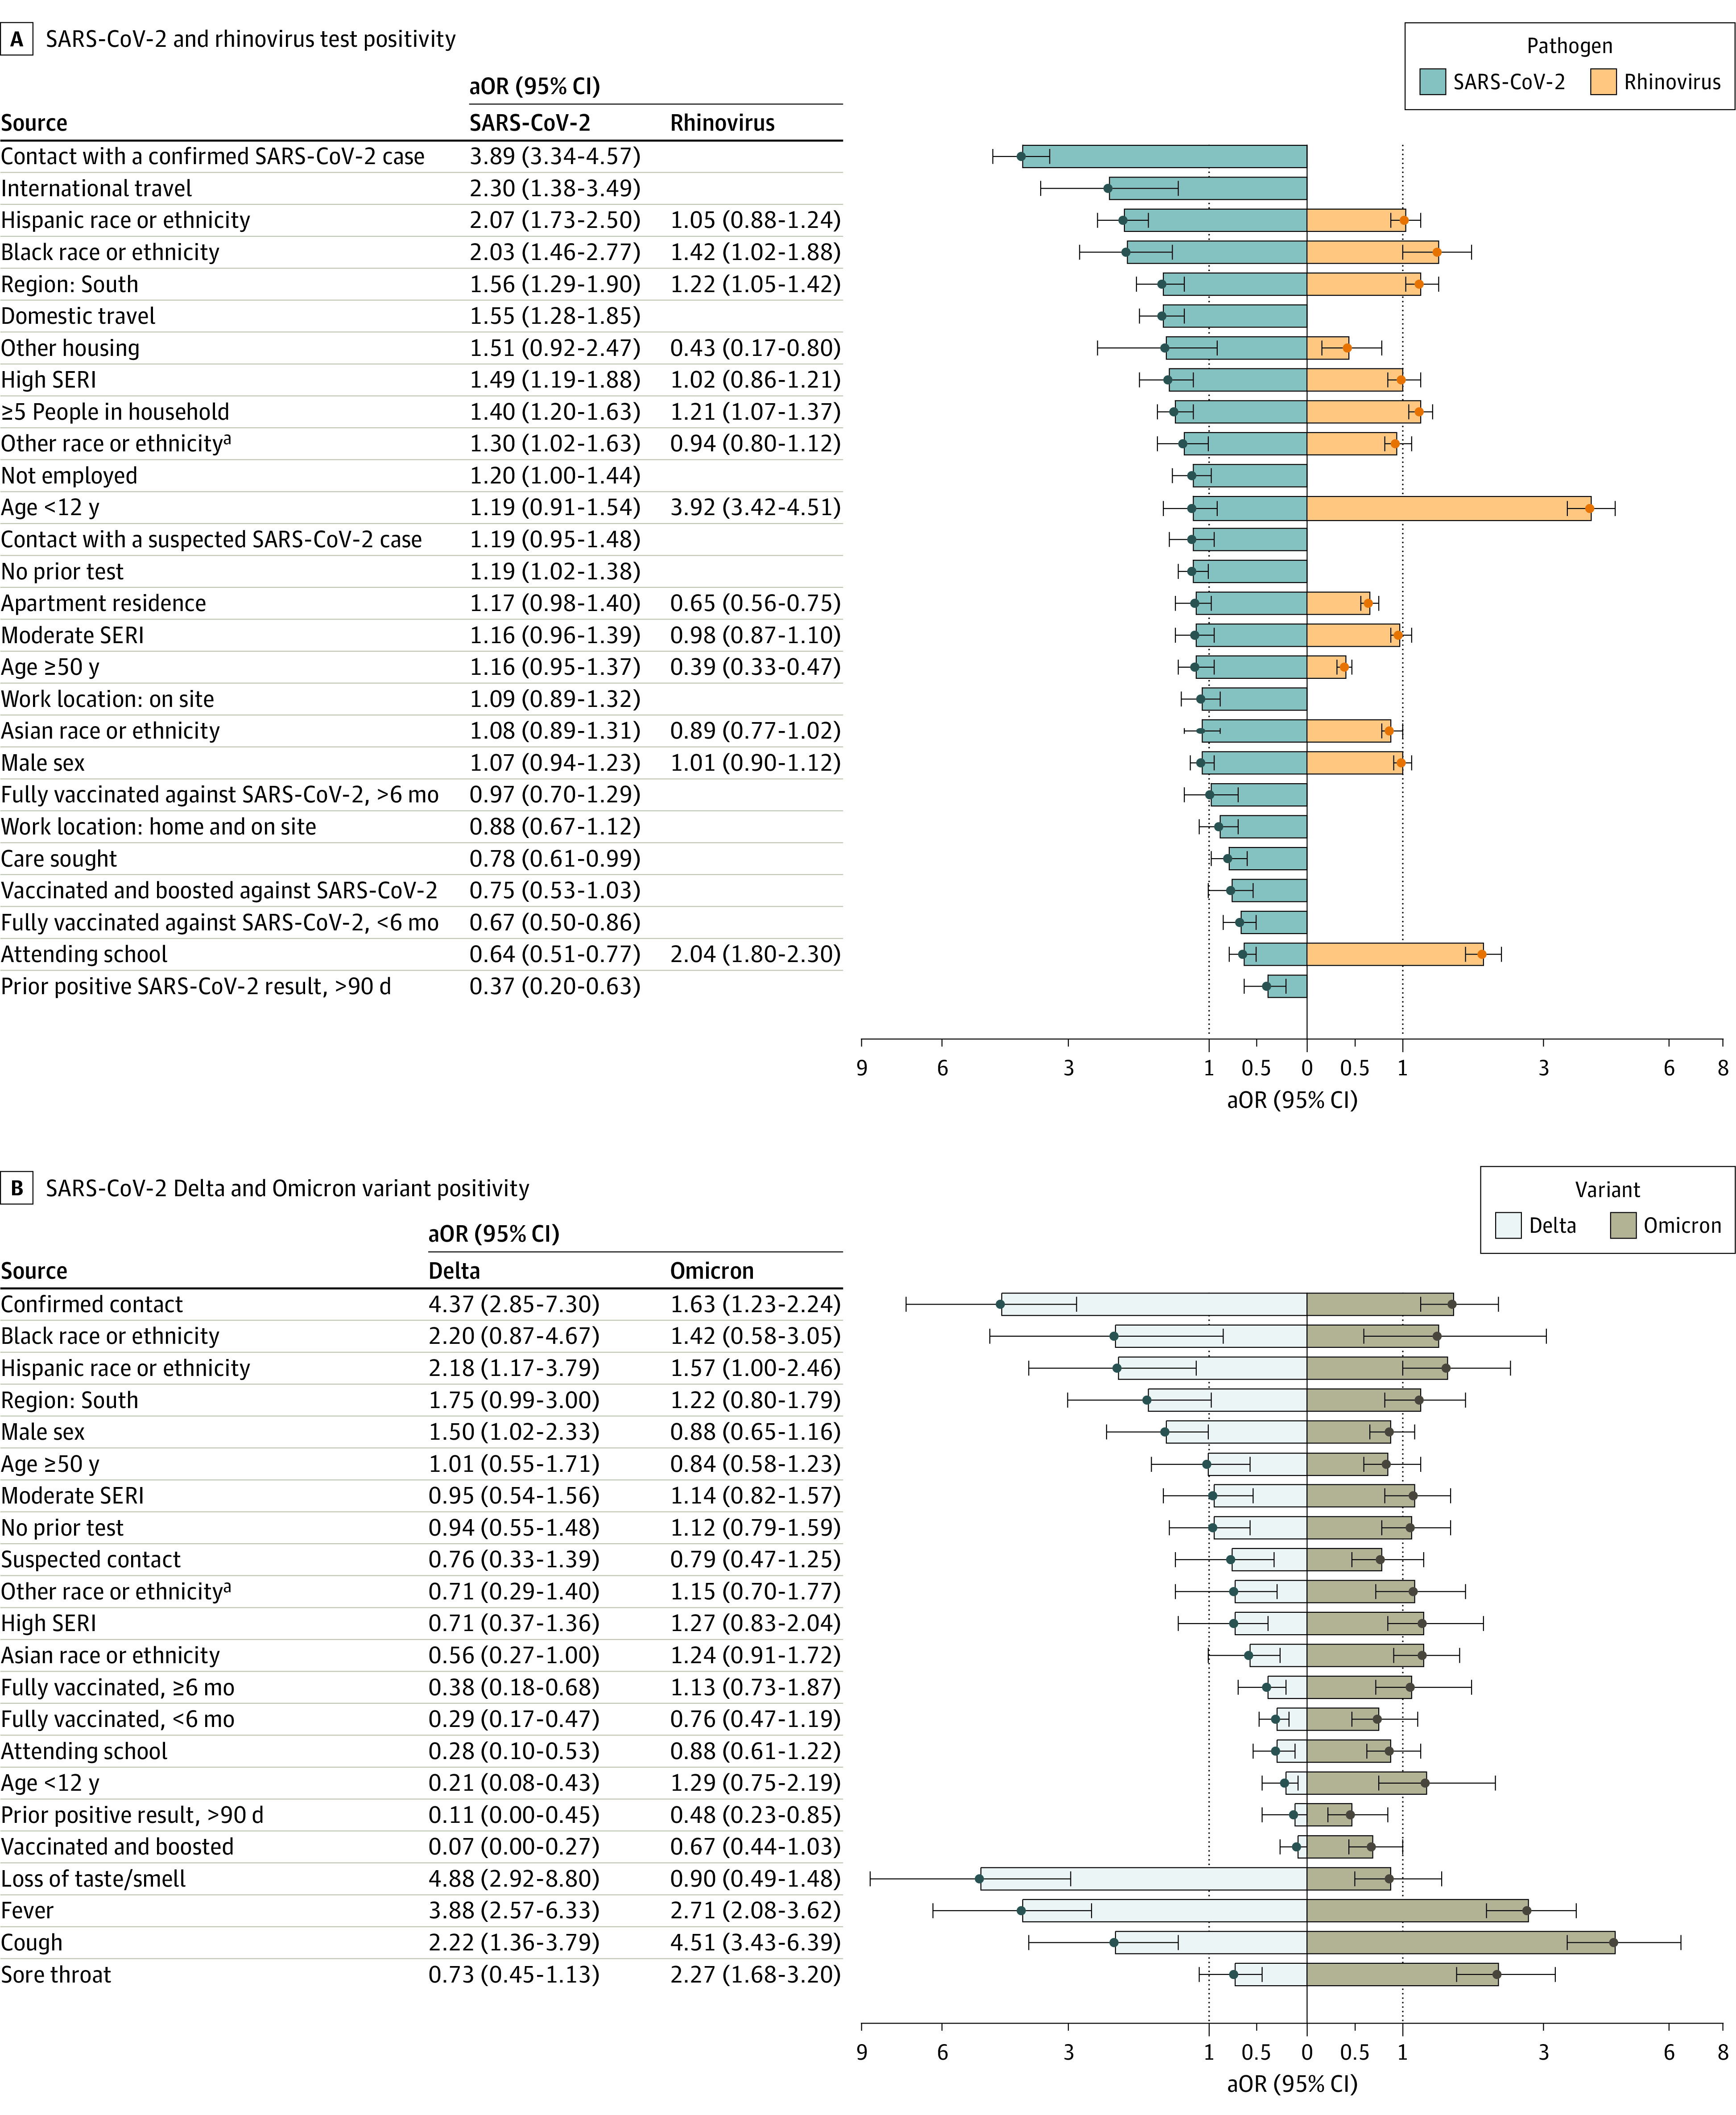
Results: Analyses included data from 23 498 individuals. The median (IQR) age of participants was 34.33 (22.42-45.08) years, 13 878 (59.06%) were female, 4018 (17.10%) identified as Asian, 654 (2.78%) identified as Black, and 2193 (9.33%) identified as Hispanic. Close contact with an individual with SARS-CoV-2 (adjusted odds ratio [aOR], 3.89; 95% CI, 3.34-4.57) and loss of smell or taste (aOR, 3.49; 95% CI, 2.77-4.41) were the variables most associated with SARS-CoV-2 test positivity, but both attenuated during the Omicron period. Contact with a vaccinated individual with SARS-CoV-2 (aOR, 2.03; 95% CI, 1.56-2.79) was associated with lower odds of testing positive than contact with an unvaccinated individual with SARS-CoV-2 (aOR, 4.04; 95% CI, 2.39-7.23). Sore throat was associated with Omicron infection (aOR, 2.27; 95% CI, 1.68-3.20) but not Delta infection. Vaccine effectiveness for participants fully vaccinated with a booster dose was 93% (95% CI, 73%-100%) for Delta, but not significant for Omicron. Variables associated with rhinovirus test positivity included being younger than 12 years (aOR, 3.92; 95% CI, 3.42-4.51) and experiencing a runny or stuffy nose (aOR, 4.58; 95% CI, 4.07-5.21). Black race, residing in south King County, and households with 5 or more people were significantly associated with both SARS-CoV-2 and rhinovirus test positivity.
Conclusions and relevance: In this case-control study of 23 498 symptomatic individuals, estimated risk factors and symptoms associated with SARS-CoV-2 infection changed over time. There was a shift in reported symptoms between the Delta and Omicron variants as well as reductions in the protection provided by vaccines. Racial and sociodemographic disparities persisted in the third year of SARS-CoV-2 circulation and were also present in rhinovirus infection. Trends in testing behavior and availability may influence these results.
Conflict of interest statement
Figures
Similar articles
-
SARS-CoV-2 infection following booster vaccination: Illness and symptom profile in a prospective, observational community-based case-control study.J Infect. 2023 Dec;87(6):506-515. doi: 10.1016/j.jinf.2023.08.009. Epub 2023 Sep 28. J Infect. 2023. PMID: 37777159
-
COVID-19 Symptoms and Duration of Rapid Antigen Test Positivity at a Community Testing and Surveillance Site During Pre-Delta, Delta, and Omicron BA.1 Periods.JAMA Netw Open. 2022 Oct 3;5(10):e2235844. doi: 10.1001/jamanetworkopen.2022.35844. JAMA Netw Open. 2022. PMID: 36215069 Free PMC article.
-
Association Between 3 Doses of mRNA COVID-19 Vaccine and Symptomatic Infection Caused by the SARS-CoV-2 Omicron and Delta Variants.JAMA. 2022 Feb 15;327(7):639-651. doi: 10.1001/jama.2022.0470. JAMA. 2022. PMID: 35060999 Free PMC article.
-
Duration of viable virus shedding and polymerase chain reaction positivity of the SARS-CoV-2 Omicron variant in the upper respiratory tract: a systematic review and meta-analysis.Int J Infect Dis. 2023 Apr;129:228-235. doi: 10.1016/j.ijid.2023.02.011. Epub 2023 Feb 18. Int J Infect Dis. 2023. PMID: 36804640 Free PMC article.
-
SARS-CoV-2 infection among Colorado adults working outside the home: Occupation, race and ethnicity and mask use.Am J Ind Med. 2024 Nov;67(11):961-970. doi: 10.1002/ajim.23639. Epub 2024 Sep 2. Am J Ind Med. 2024. PMID: 39223073 Review.
Cited by
-
Prevalence of Olfactory Dysfunction with the Omicron Variant of SARS-CoV-2: A Systematic Review and Meta-analysis.medRxiv [Preprint]. 2023 Jan 19:2022.12.16.22283582. doi: 10.1101/2022.12.16.22283582. medRxiv. 2023. Update in: Cells. 2023 Jan 28;12(3):430. doi: 10.3390/cells12030430. PMID: 36561176 Free PMC article. Updated. Preprint.
-
Prevalence of Olfactory Dysfunction with the Omicron Variant of SARS-CoV-2: A Systematic Review and Meta-Analysis.Cells. 2023 Jan 28;12(3):430. doi: 10.3390/cells12030430. Cells. 2023. PMID: 36766771 Free PMC article.
-
Changing risk factors for developing SARS-CoV-2 infection from Delta to Omicron.PLoS One. 2024 May 15;19(5):e0299714. doi: 10.1371/journal.pone.0299714. eCollection 2024. PLoS One. 2024. PMID: 38748651 Free PMC article.
-
Viral coinfection in hospitalized patients during the COVID-19 pandemic in Southern Brazil: a retrospective cohort study.Respir Res. 2024 Feb 5;25(1):71. doi: 10.1186/s12931-024-02708-2. Respir Res. 2024. PMID: 38317218 Free PMC article.
-
Genomic Epidemiology and Evolution of Rhinovirus in Western Washington State, 2021-2022.J Infect Dis. 2025 Feb 4;231(1):e154-e164. doi: 10.1093/infdis/jiae347. J Infect Dis. 2025. PMID: 38963827 Free PMC article.
References
-
- Pritchard E, Jones J, Vihta KD, et al. ; COVID-19 Infection Survey Team . Monitoring populations at increased risk for SARS-CoV-2 infection in the community using population-level demographic and behavioural surveillance. Lancet Reg Health Eur. 2022;13:100282. doi:10.1016/j.lanepe.2021.100282 - DOI - PMC - PubMed
-
- Menni C, Valdes AM, Polidori L, et al. . Symptom prevalence, duration, and risk of hospital admission in individuals infected with SARS-CoV-2 during periods of Omicron and Delta variant dominance: a prospective observational study from the ZOE COVID Study. Lancet. 2022;399(10335):1618-1624. doi:10.1016/S0140-6736(22)00327-0 - DOI - PMC - PubMed
-
- Fisher KA, Tenforde MW, Feldstein LR, et al. ; IVY Network Investigators; CDC COVID-19 Response Team . Community and close contact exposures associated with COVID-19 among symptomatic adults ≥18 years in 11 outpatient health care facilities—United States, July 2020. MMWR Morb Mortal Wkly Rep. 2020;69(36):1258-1264. doi:10.15585/mmwr.mm6936a5 - DOI - PMC - PubMed
-
- Fisher KA, Olson SM, Tenforde MW, et al. ; IVY Network Investigators; CDC COVID-19 Response Team . Telework before illness onset among symptomatic adults aged ≥18 years with and without COVID-19 in 11 outpatient health care facilities—United States, July 2020. MMWR Morb Mortal Wkly Rep. 2020;69(44):1648-1653. doi:10.15585/mmwr.mm6944a4 - DOI - PMC - PubMed
Publication types
MeSH terms
Supplementary concepts
Grants and funding
LinkOut - more resources
Full Text Sources
Medical
Miscellaneous
