. 2022 Dec 16;7(78):eabq6691.
doi: 10.1126/sciimmunol.abq6691. Epub 2022 Dec 9.

Epiregulin is a dendritic cell-derived EGFR ligand that maintains skin and lung fibrosis

Affiliations

Epiregulin is a dendritic cell-derived EGFR ligand that maintains skin and lung fibrosis

Ian D Odell et al. Sci Immunol. .

Abstract

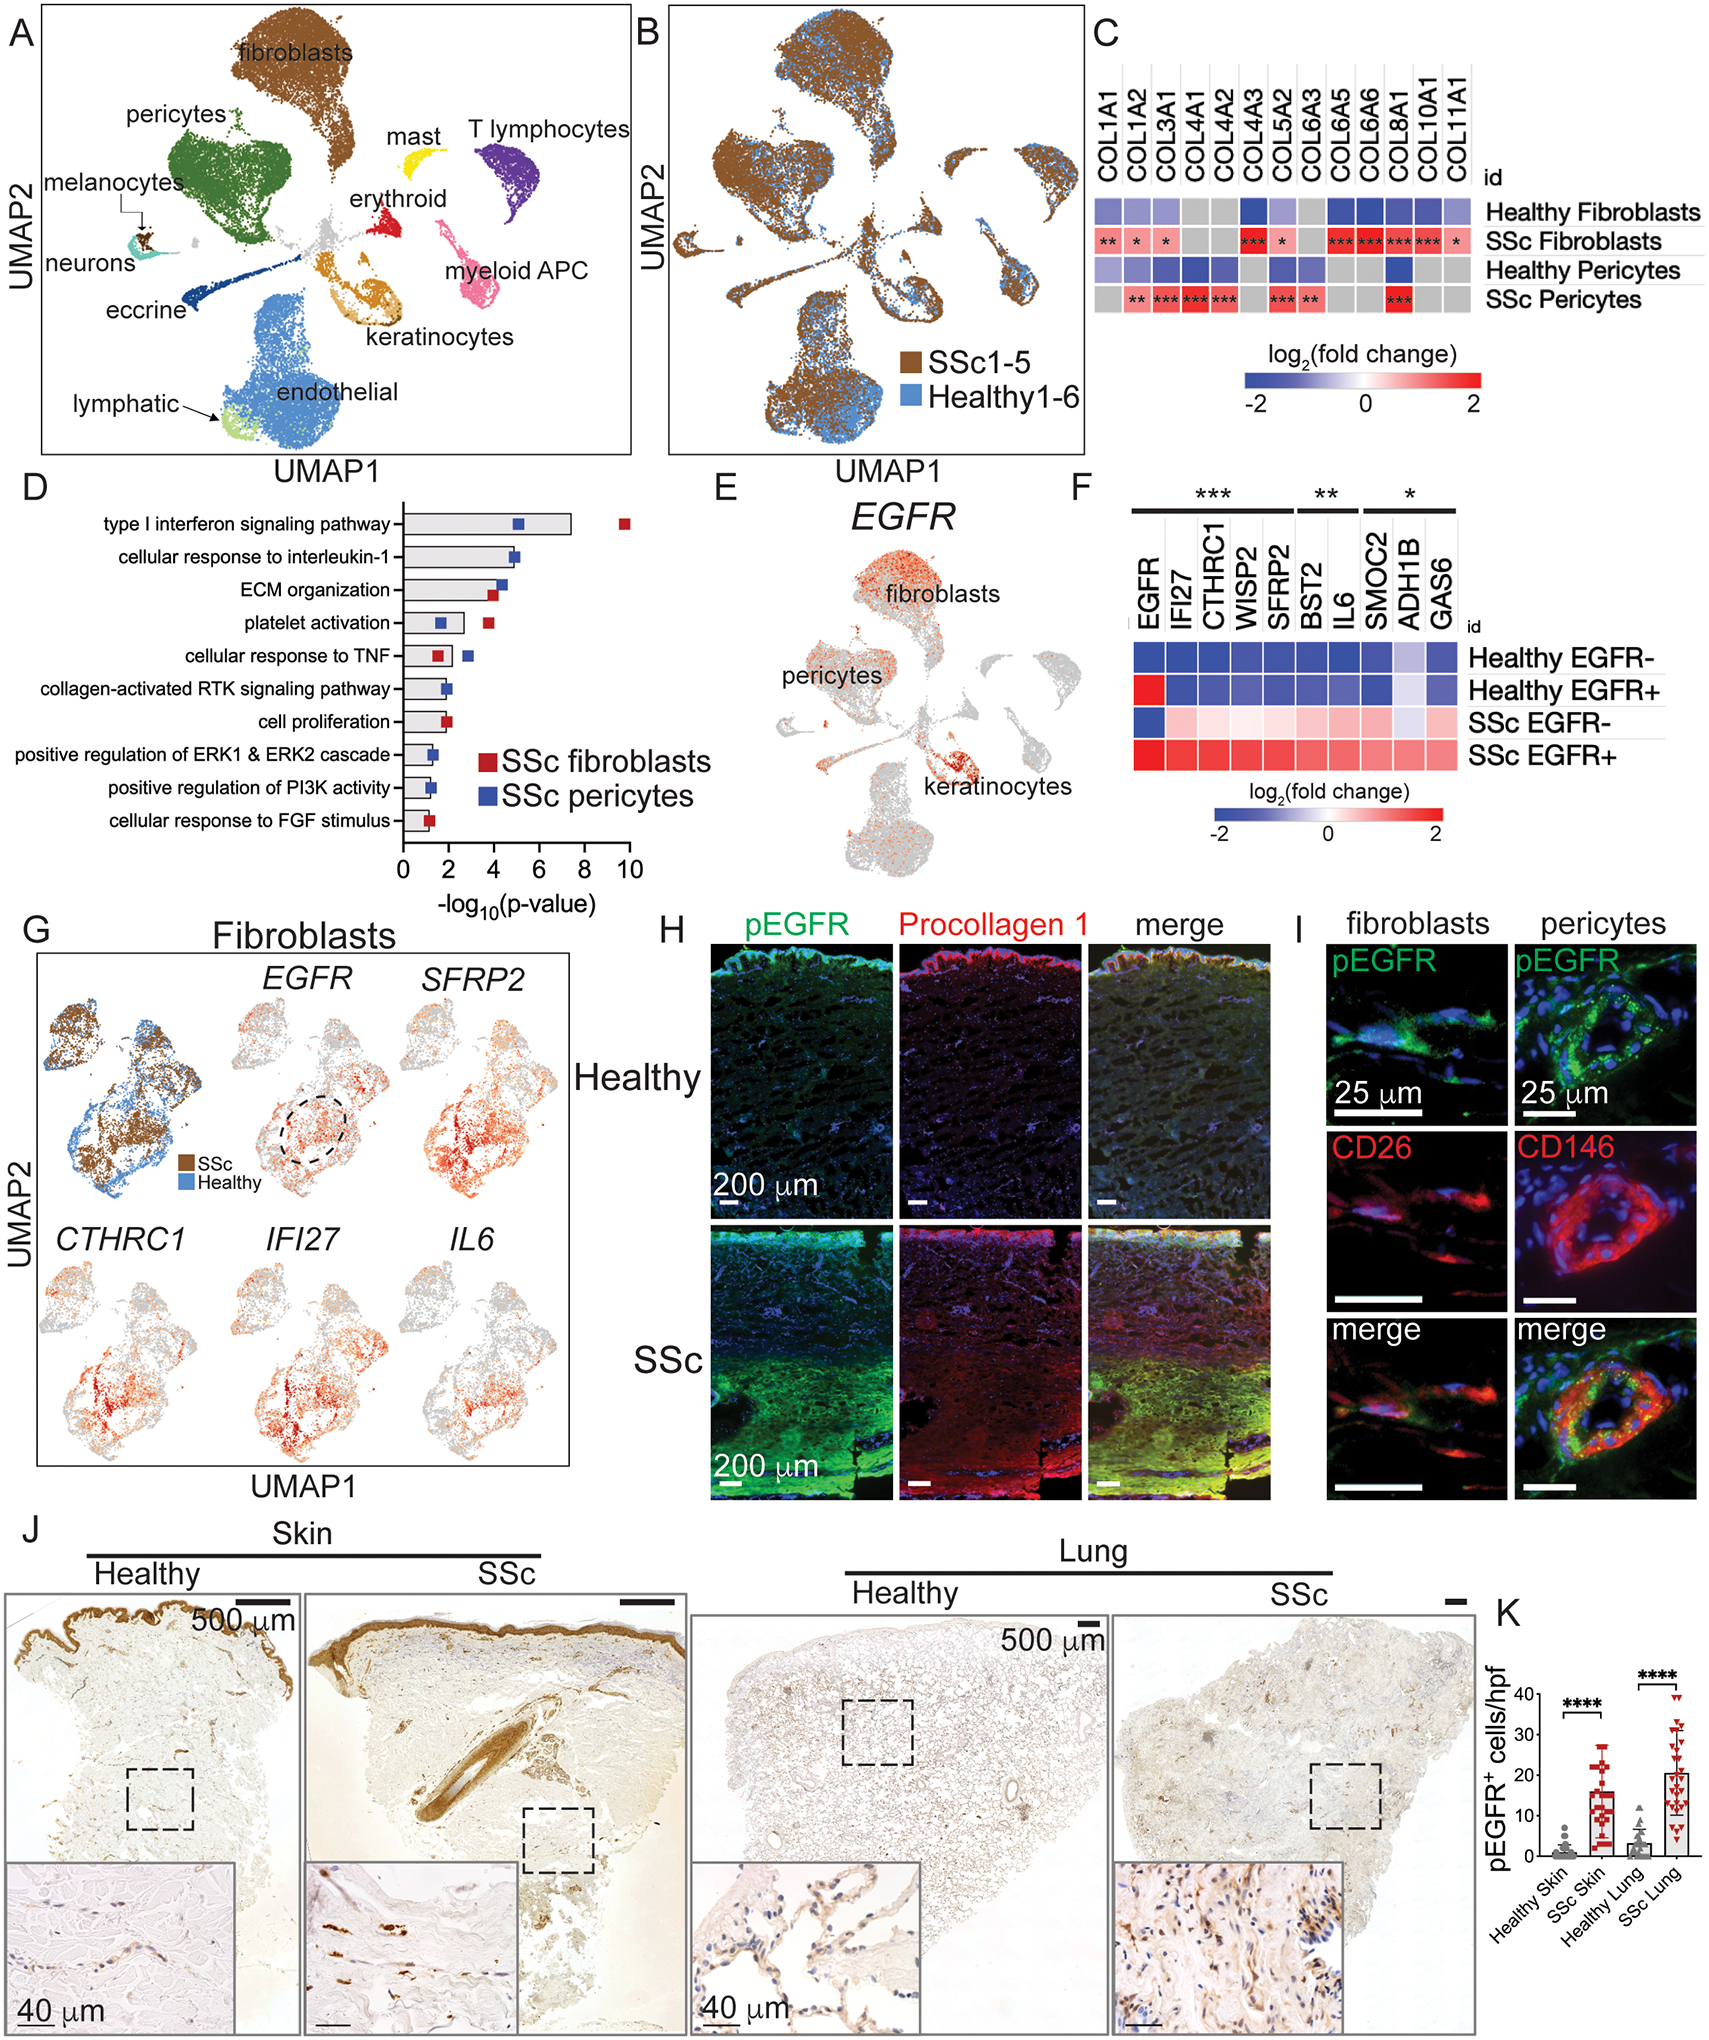
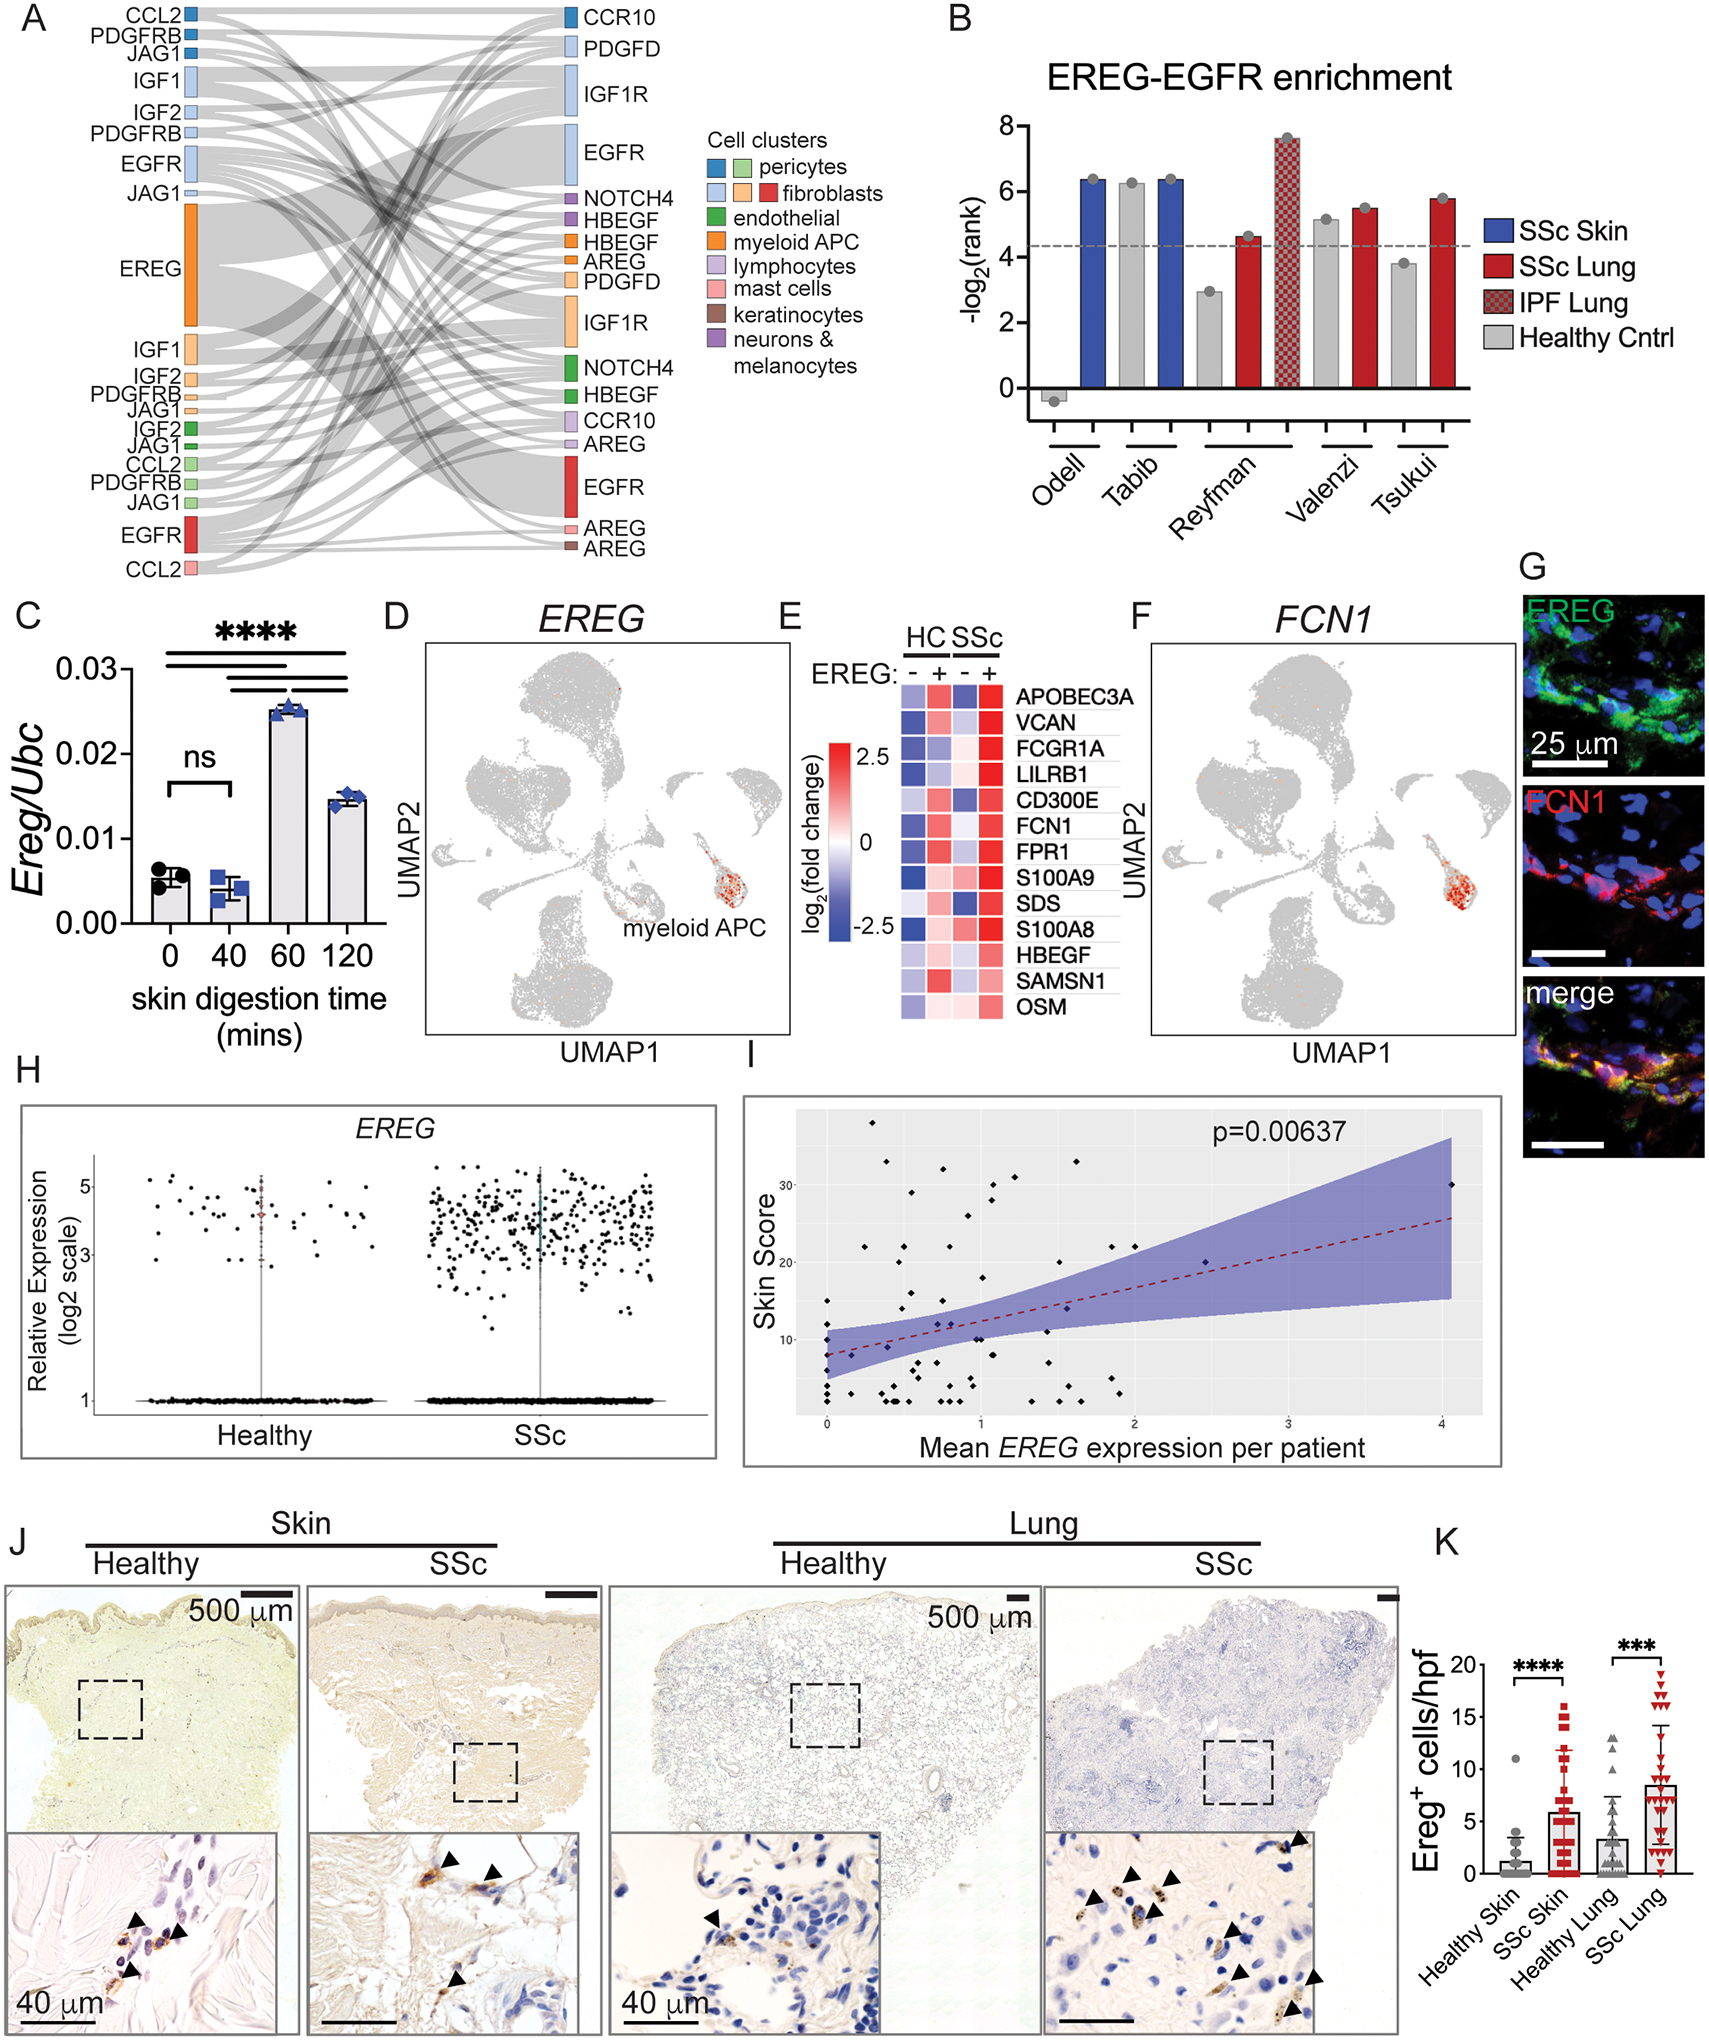
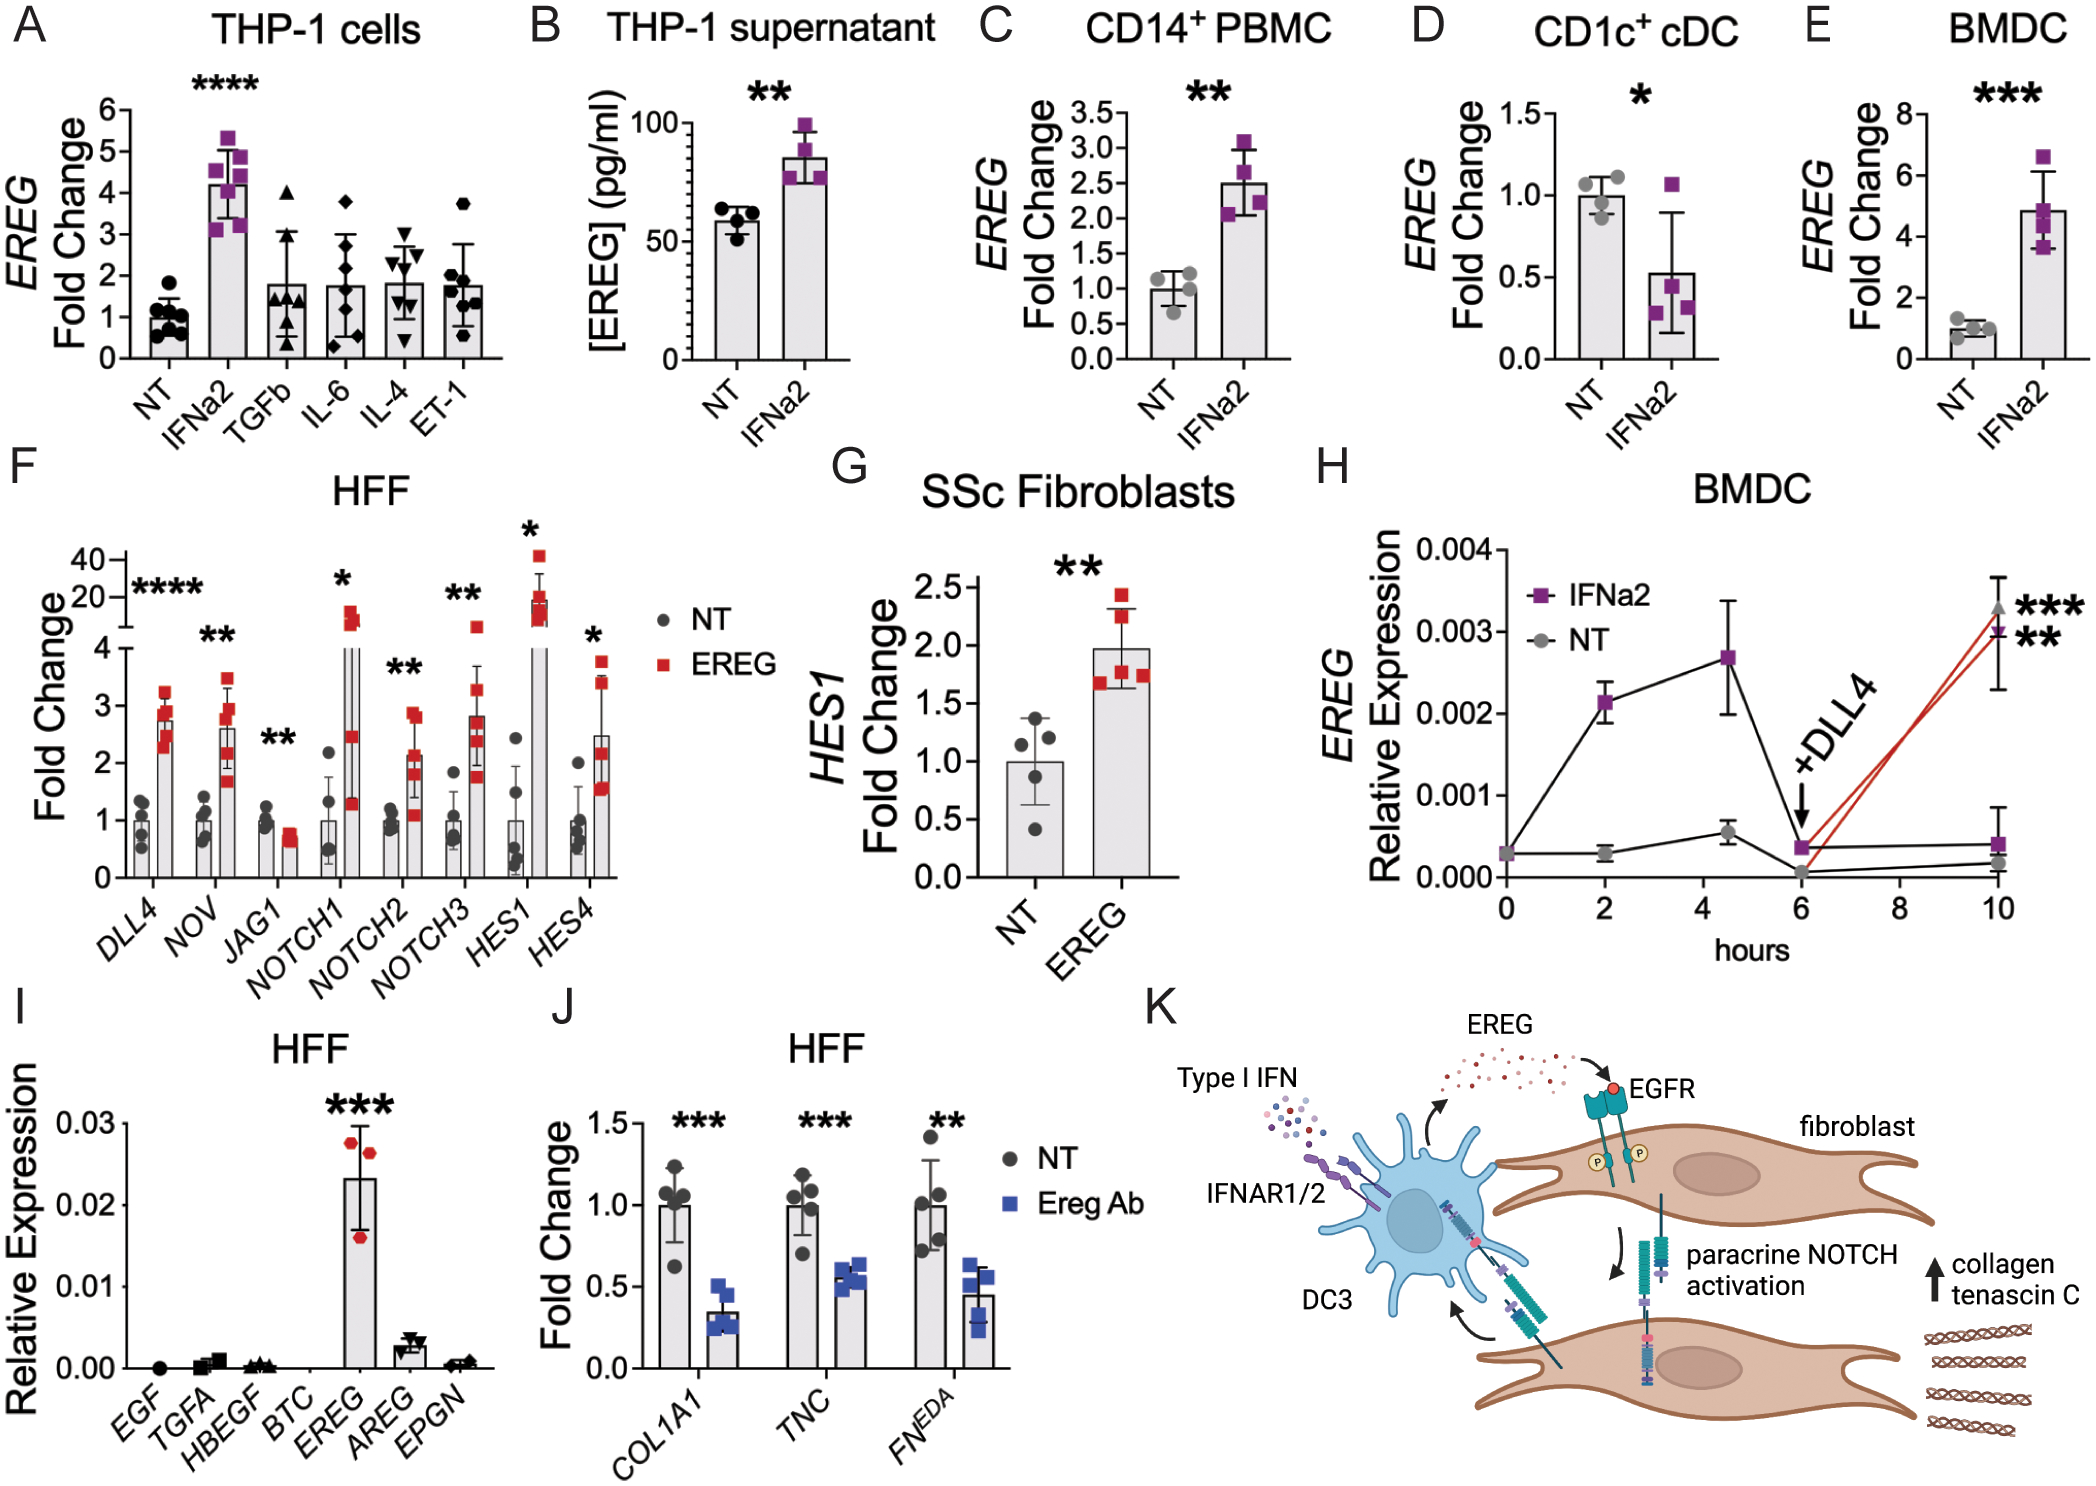
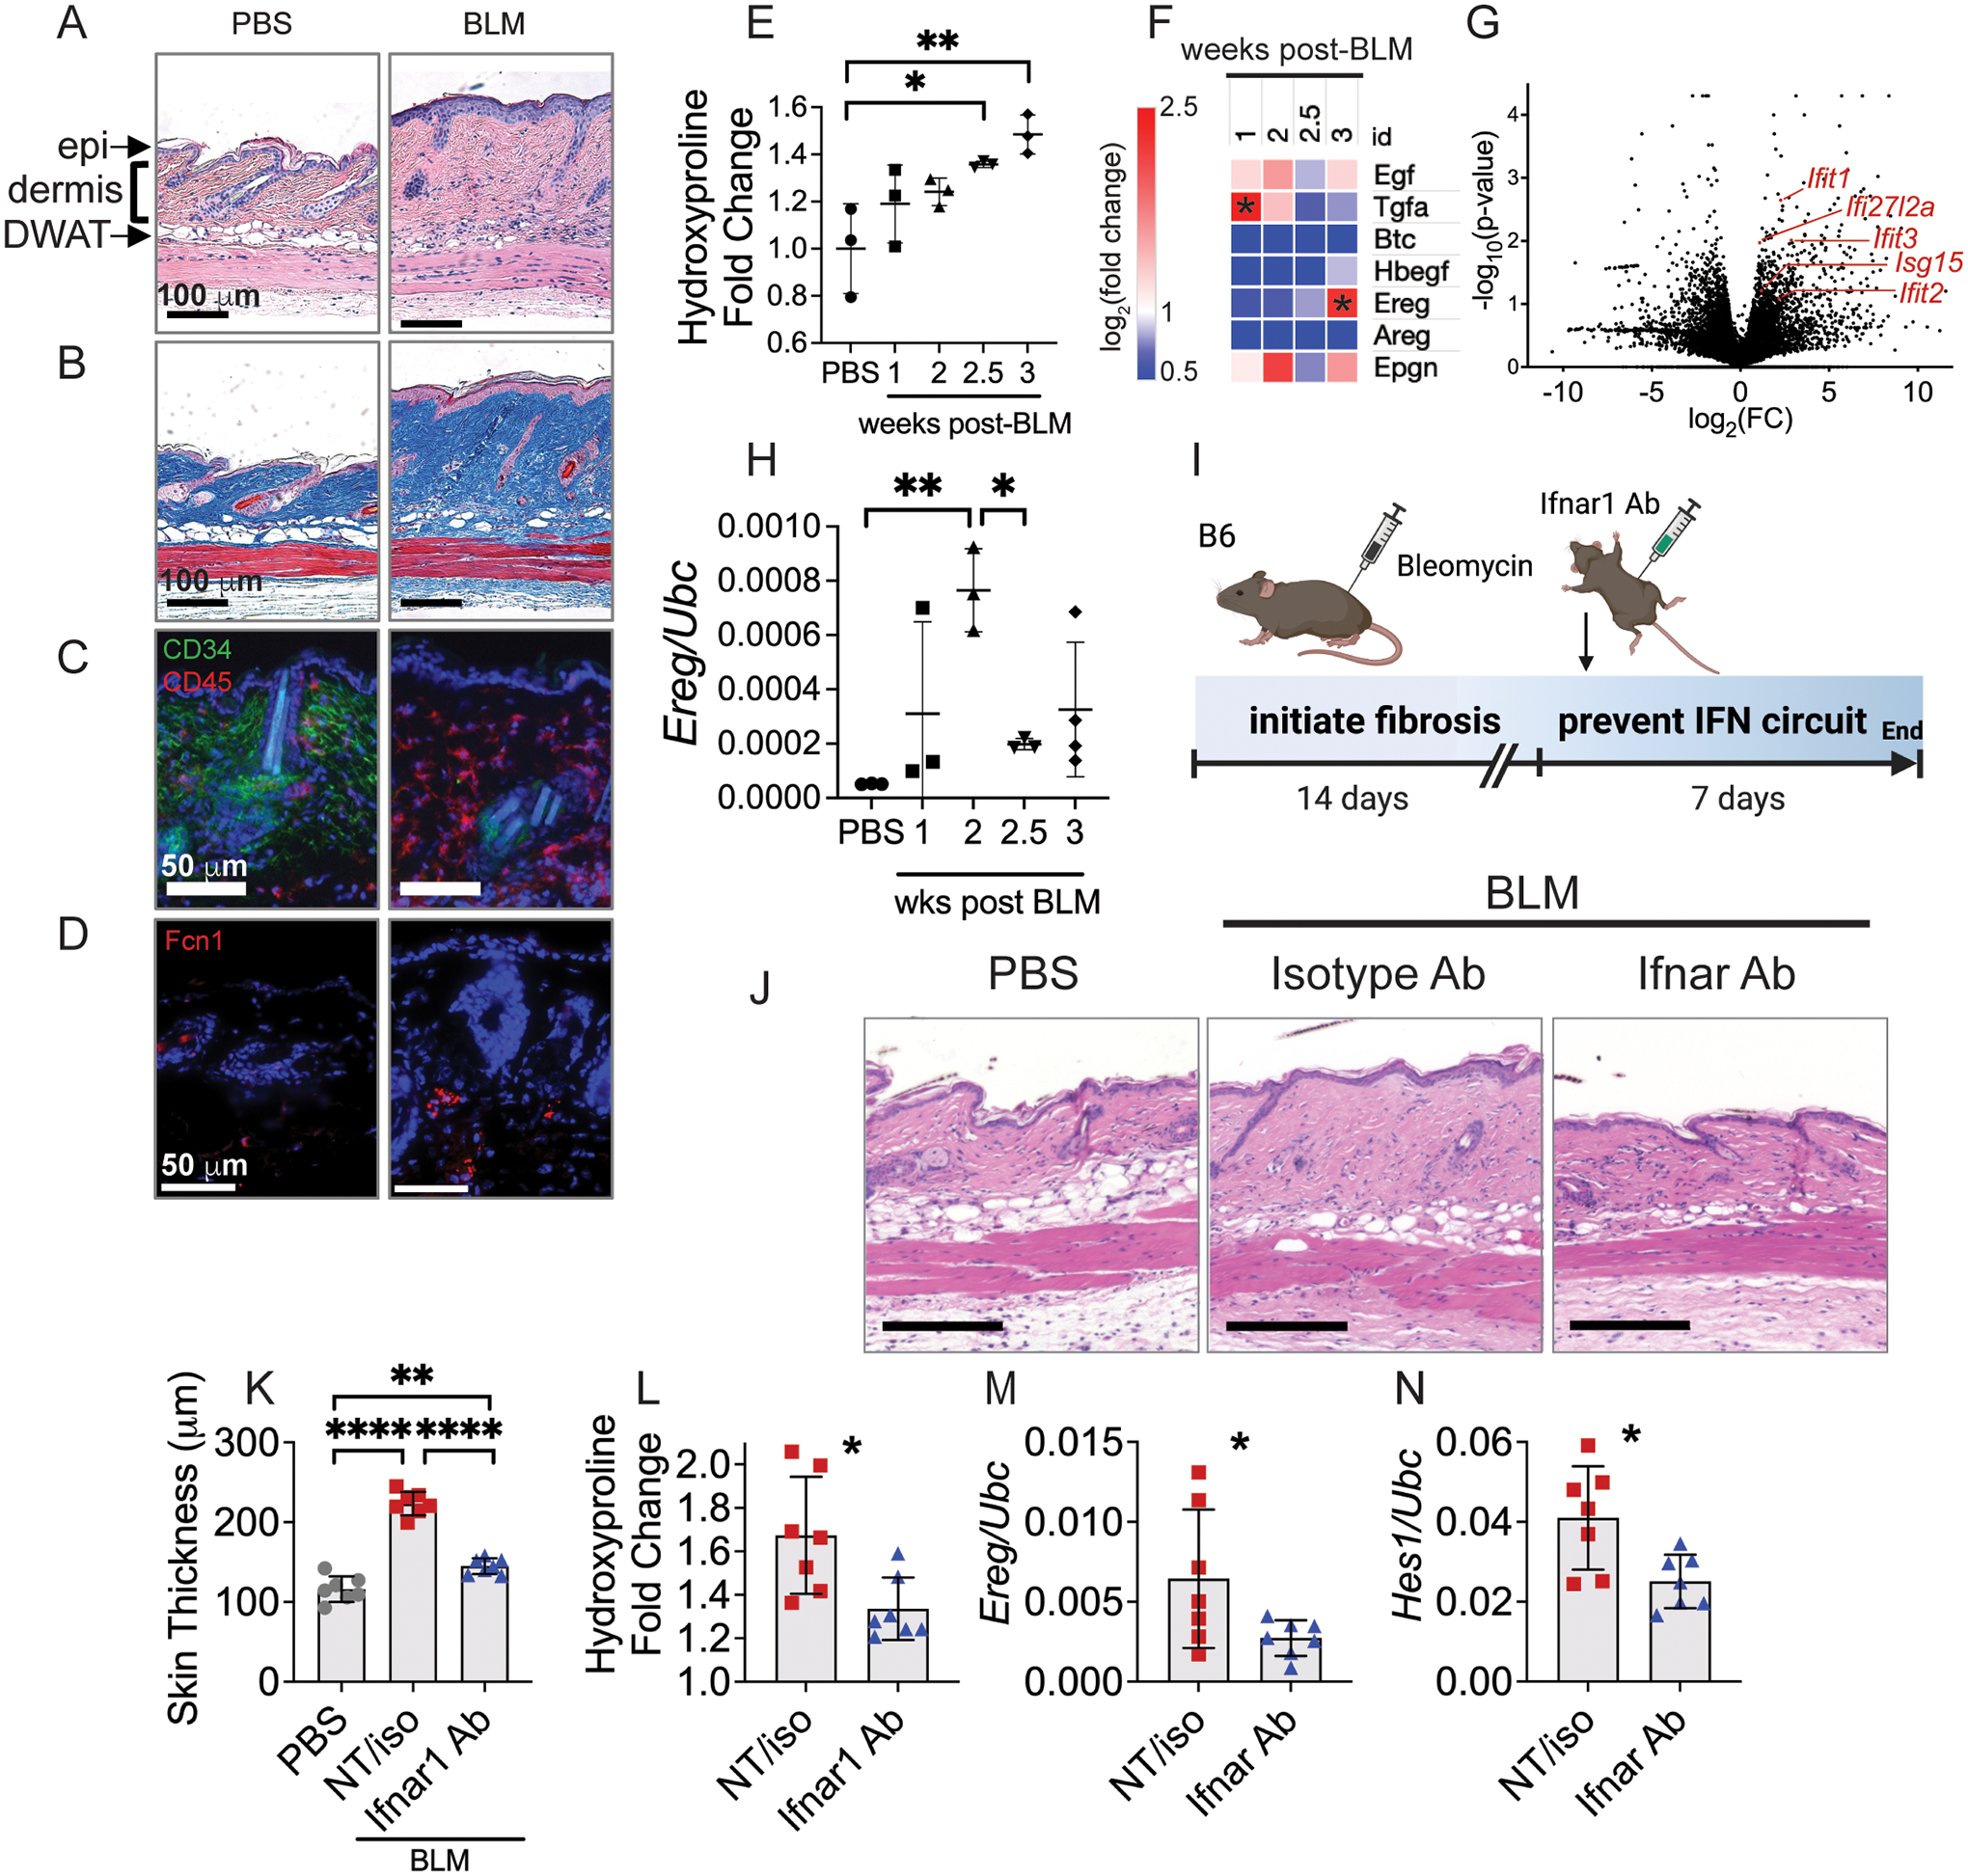
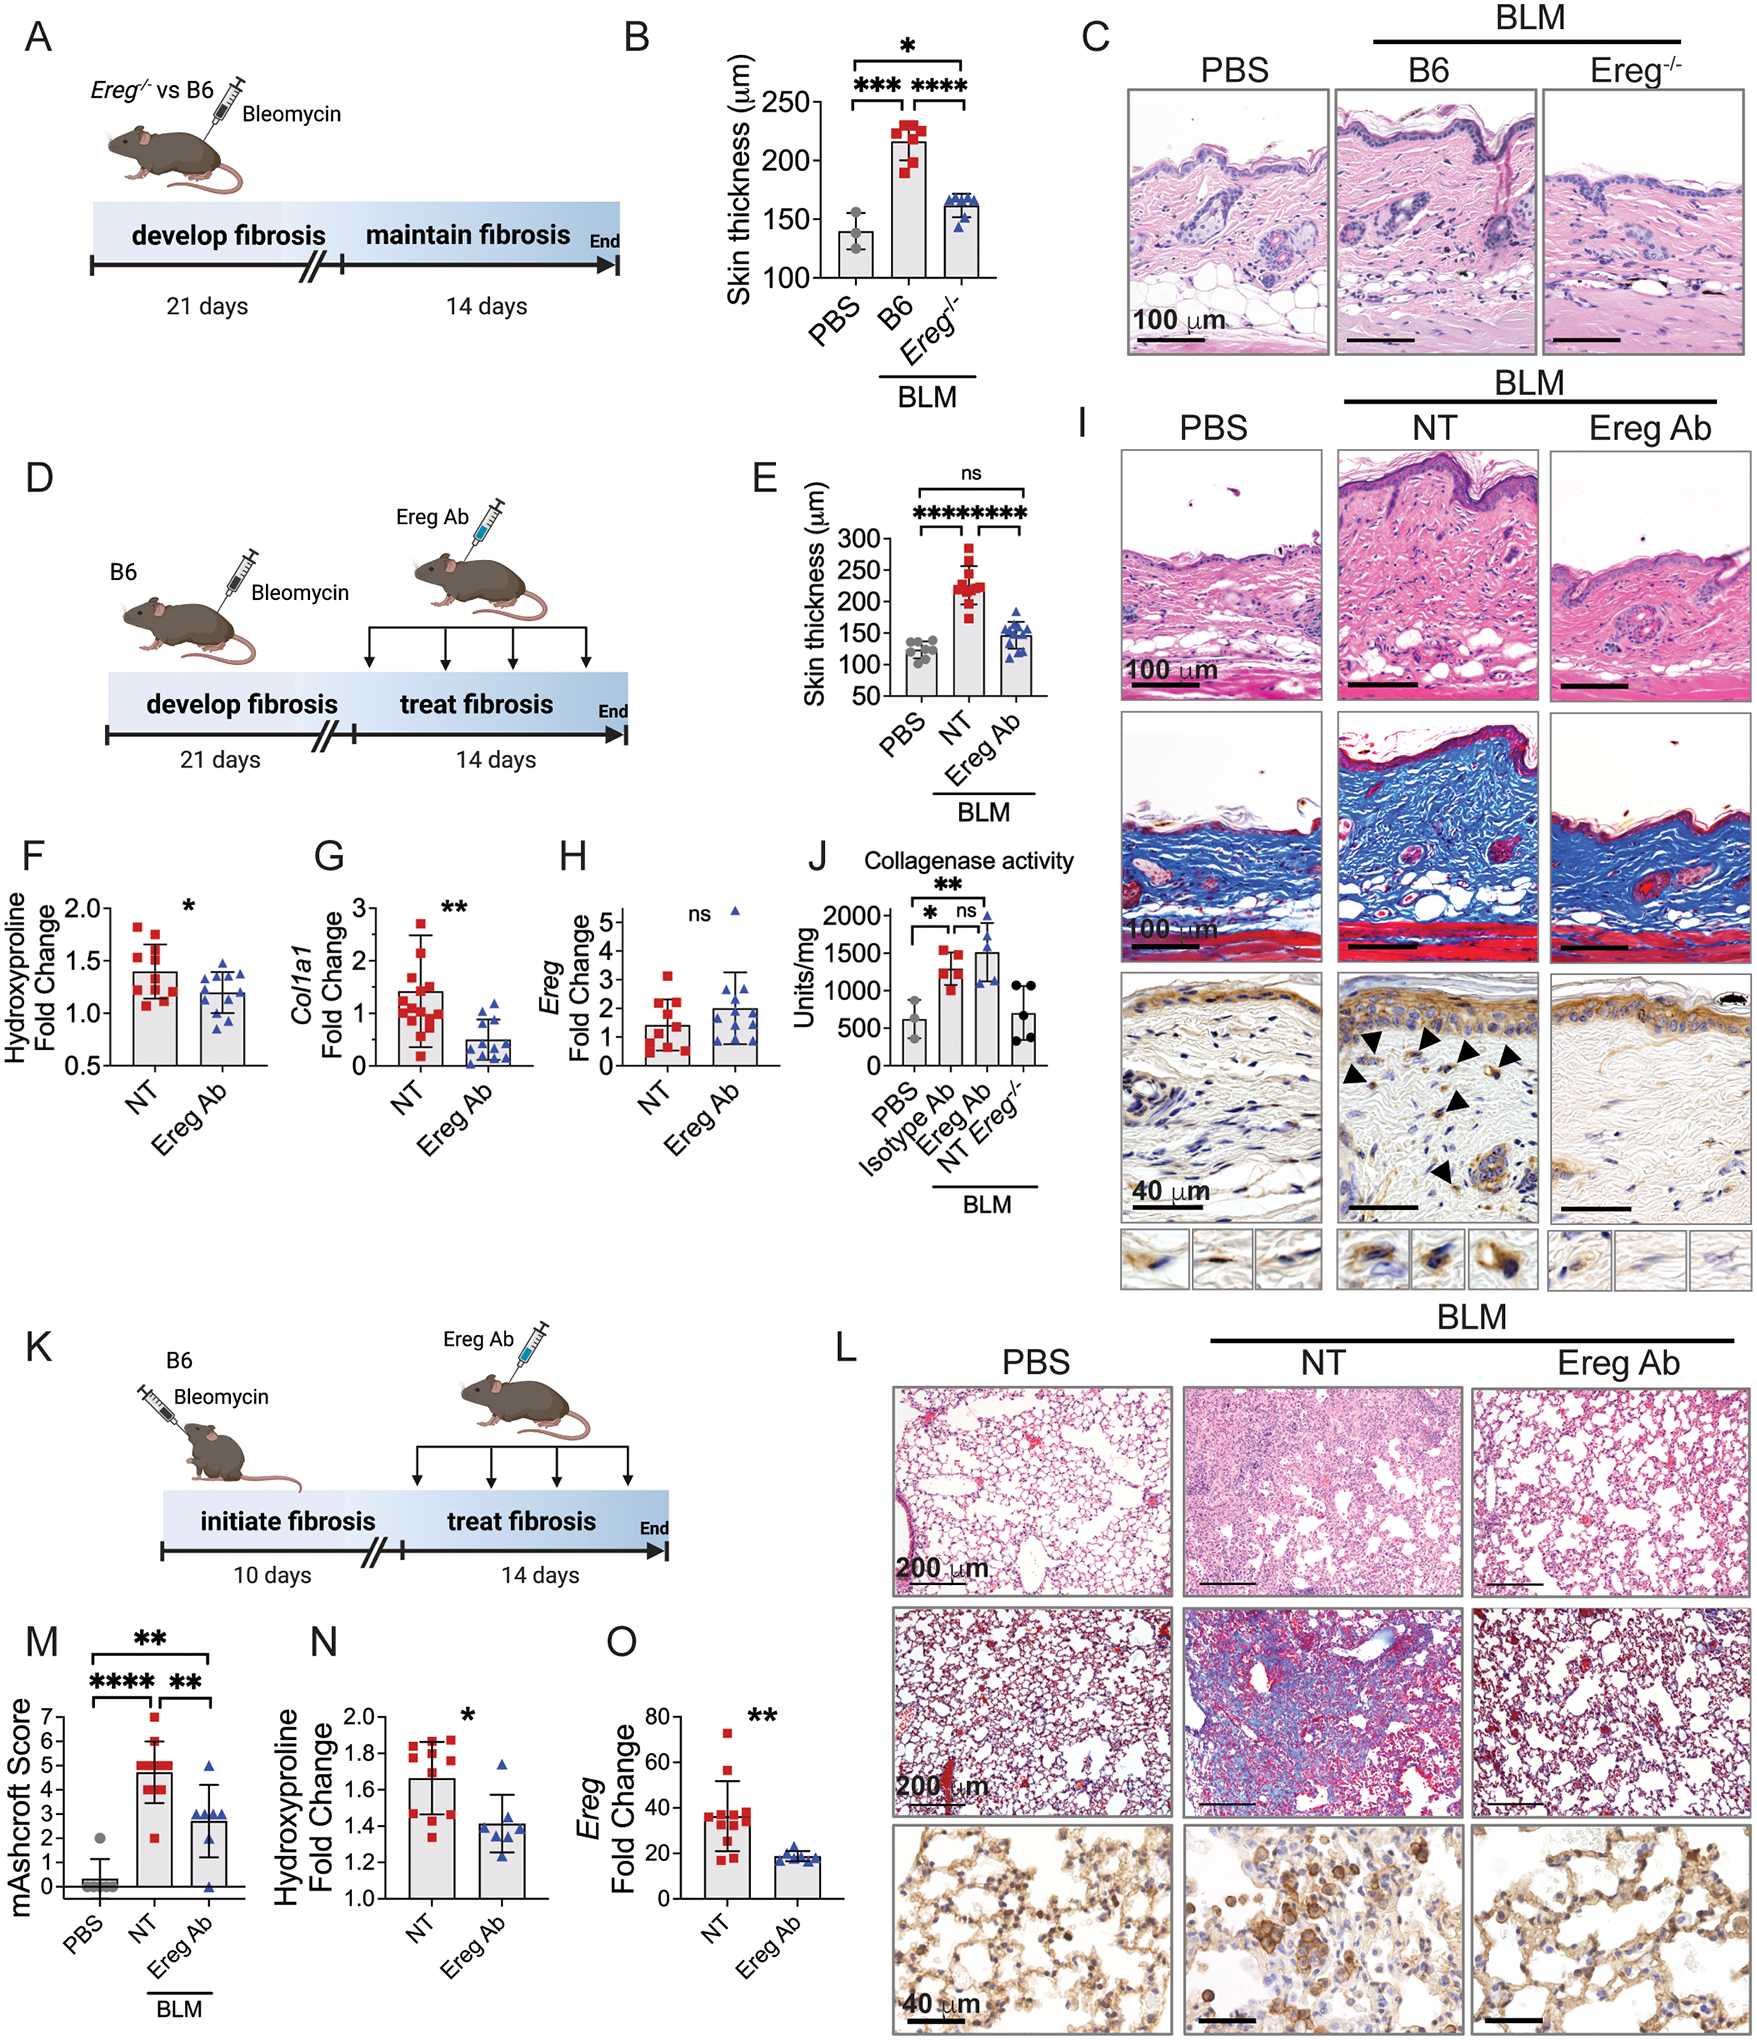
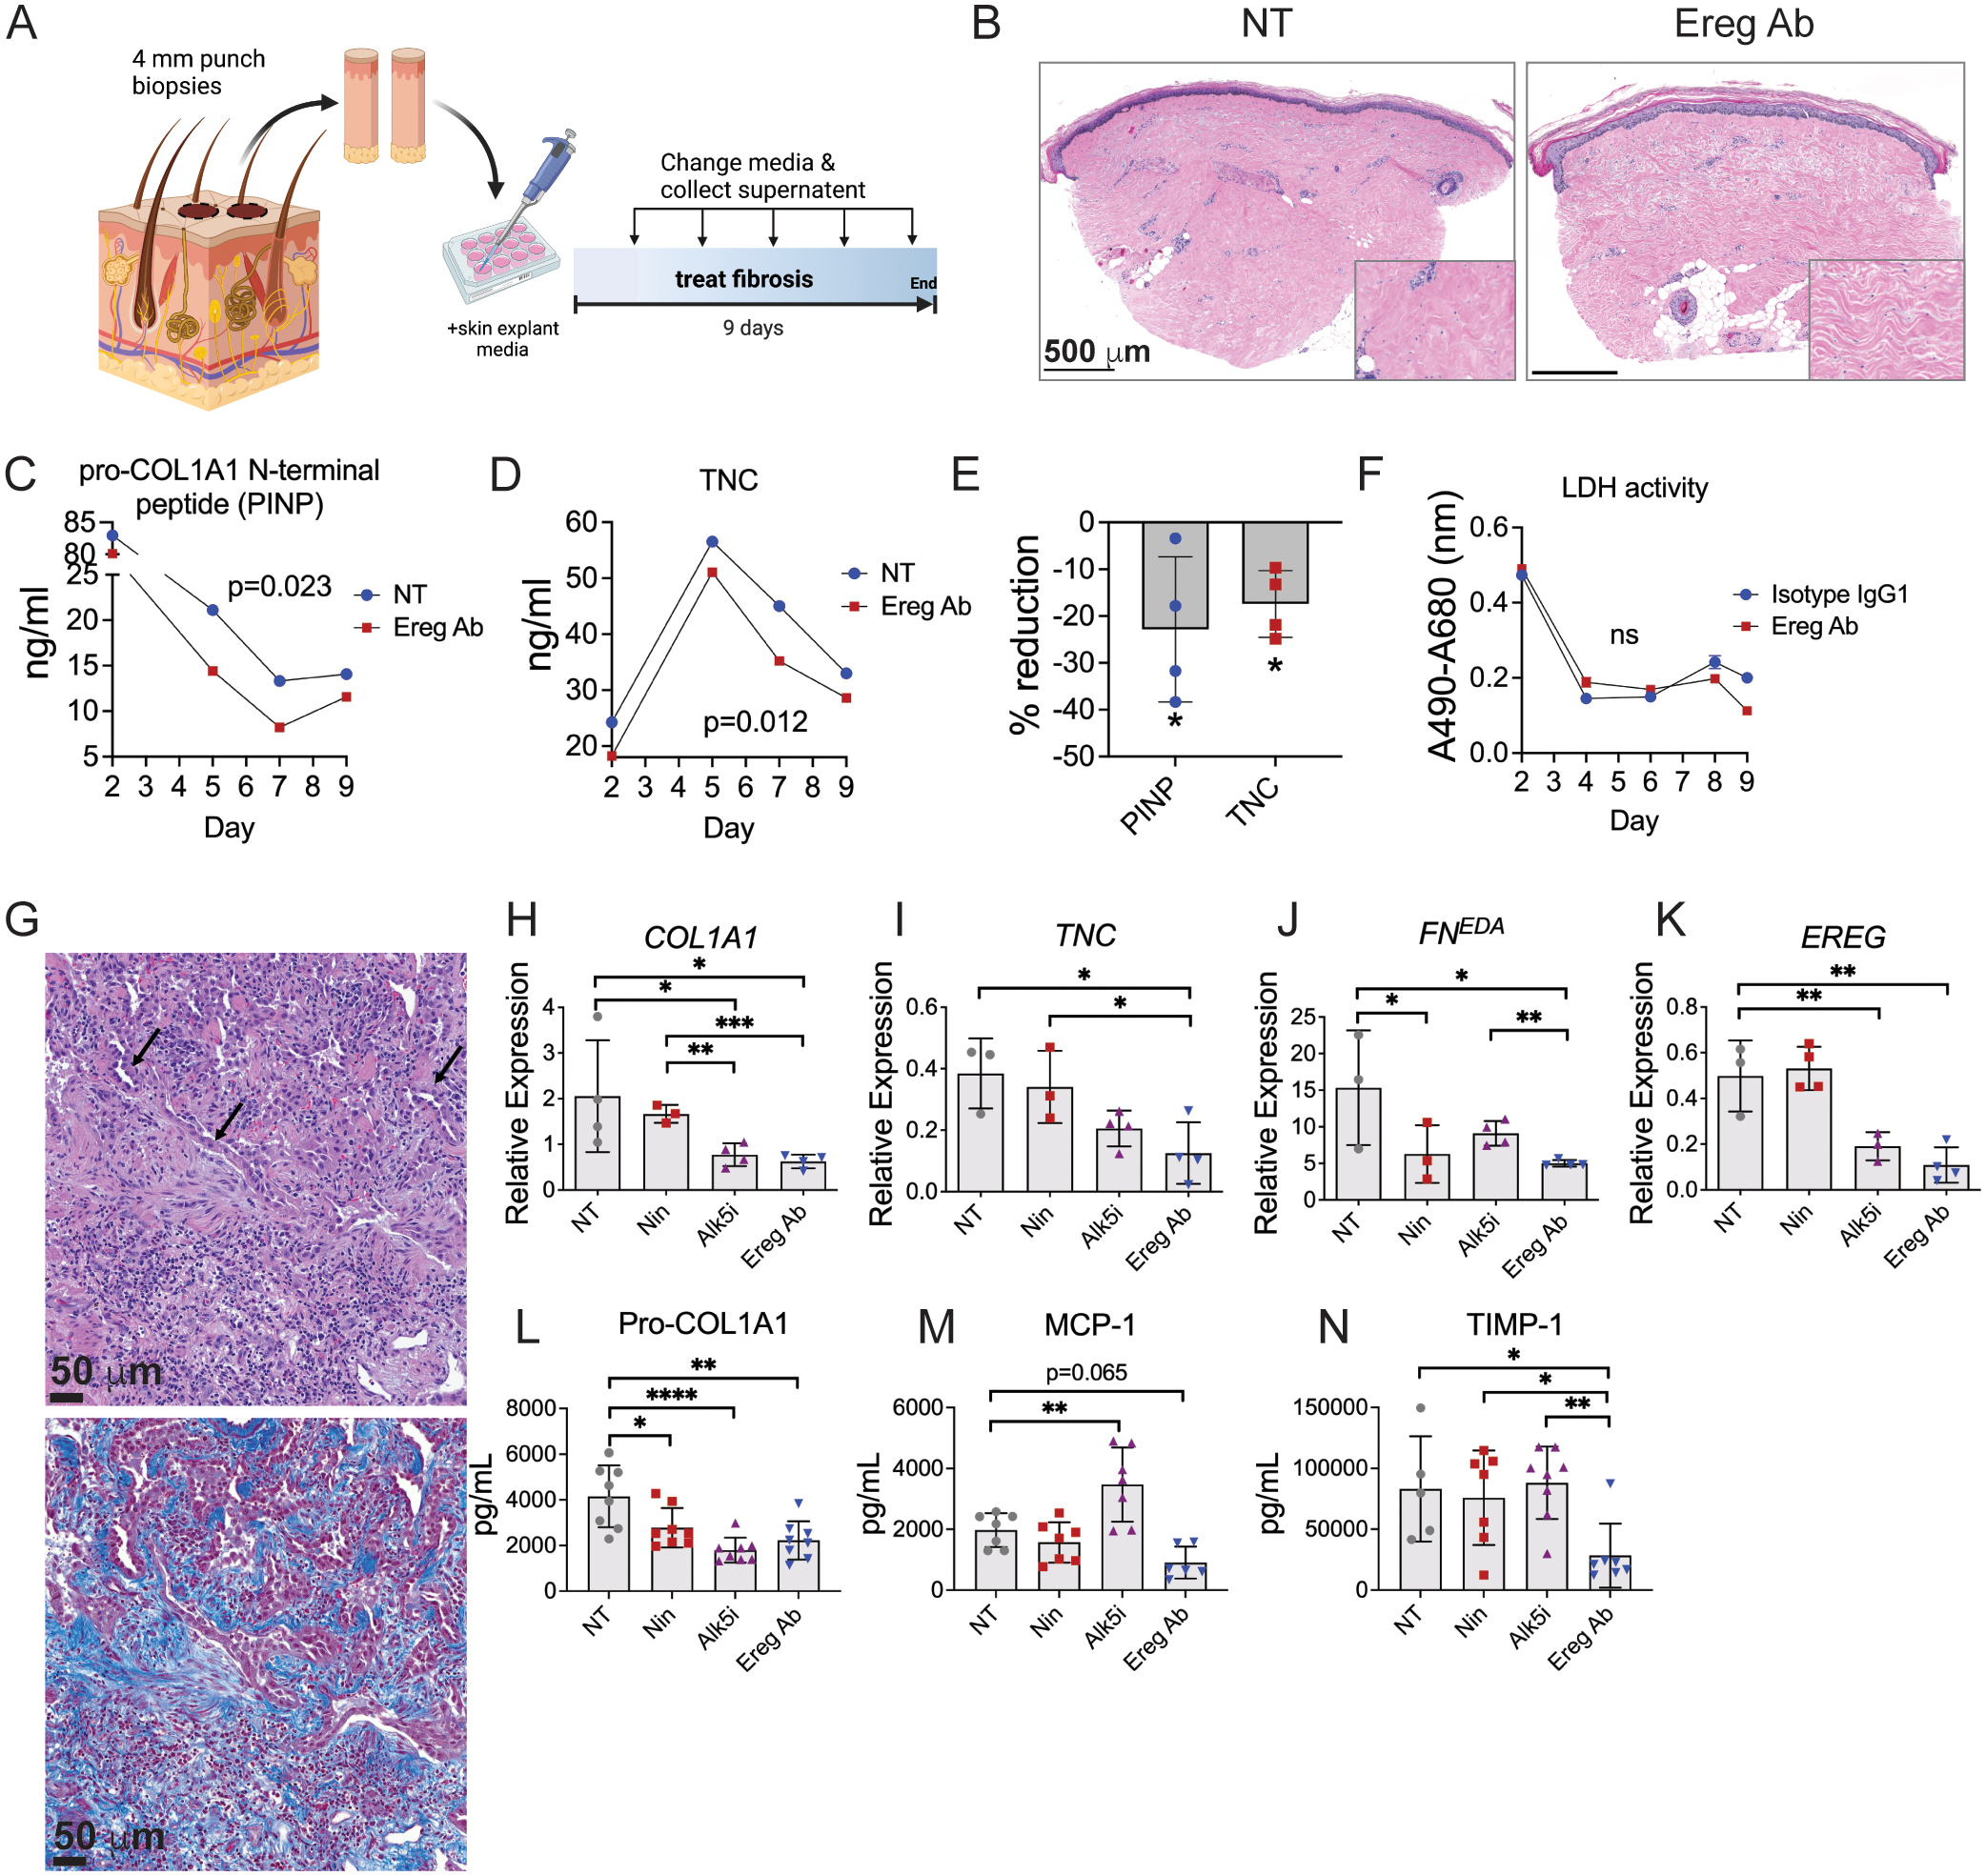
Immune cells are fundamental regulators of extracellular matrix (ECM) production by fibroblasts and have important roles in determining extent of fibrosis in response to inflammation. Although much is known about fibroblast signaling in fibrosis, the molecular signals between immune cells and fibroblasts that drive its persistence are poorly understood. We therefore analyzed skin and lung samples of patients with diffuse cutaneous systemic sclerosis, an autoimmune disease that causes debilitating fibrosis of the skin and internal organs. Here, we define a critical role of epiregulin-EGFR signaling between dendritic cells and fibroblasts to maintain elevated ECM production and accumulation in fibrotic tissue. We found that epiregulin expression marks an inducible state of DC3 dendritic cells triggered by type I interferon and that DC3-derived epiregulin activates EGFR on fibroblasts, driving a positive feedback loop through NOTCH signaling. In mouse models of skin and lung fibrosis, epiregulin was essential for persistence of fibrosis in both tissues, which could be abrogated by epiregulin genetic deficiency or a neutralizing antibody. Therapeutic administration of epiregulin antibody reversed fibrosis in patient skin and lung explants, identifying it as a previously unexplored biologic drug target. Our findings reveal epiregulin as a crucial immune signal that maintains skin and lung fibrosis in multiple diseases and represents a promising antifibrotic target.


Conflict of interest statement

COMPETING INTERESTS: RAF is a consultant for GSK and Zai Lab Ltd. MH is a consultant for AbbVie. IO and RAF are inventors on patent application (No. 63/316,691) submitted by Yale University that covers methods for treating and preventing fibrosis. The other authors have no competing interests to disclose.

Figures

Fig. 1.
Fig. 1.. EGFR activation marks pathogenic fibroblasts in SSc skin and lung.
(A,B) UMAP embedding of scRNA-seq data from five patients with diffuse cutaneous SSc and six healthy controls. (C) Heatmap of collagen gene expression in SSc fibroblasts and pericytes. (D) Gene ontology processes identified by upregulated genes in SSc fibroblasts and pericytes. (E) Expression of EGFR in UMAP embedded data. (F) Heatmap of upregulated genes in SSc EGFR-expressing fibroblasts compared to SSc EGFR-negative fibroblasts and healthy control fibroblasts. (G) UMAP plots of fibrotic gene expression by SSc and healthy fibroblasts. The dashed oval highlights EGFR+ SSc fibroblasts. (H, I) Immunofluorescence images of SSc skin co-stained with pEGFR and procollagen I, CD26 (DPP4), and CD146. (J) Low and high magnification photomicrographs of skin and lung from SSc and healthy subject samples stained with pEGFR antibody. Dashed boxes delineate regions shown in higher magnification image. (K) Enumeration of pEGFR+ cells in SSc skin dermis and lung (n=3 slides each, skin samples from patients SSc1, 3, and 4, 10 high power fields (hpf) per slide). Heatmaps in (C, F) are log2(fold change) of genes expressed by SSc vs healthy fibroblasts and pericytes (C) and SSc EGFR+ fibroblasts compared to SSc EGFR fibroblasts and EGFR+ and EGFR healthy fibroblasts (F) using sSeq and edgeR methods with p-values adjusted using the Benjamini-Hochberg correction for multiple tests. Data in (K) are means ± SD analyzed with unpaired two-tailed Student t test. For heatmaps and graphs, *=P<0.05, **=P<0.01, ***=P<0.001, ****P<0.0001. Slides were imaged with a Keyence BZ-X800 microscope. Low power images are 10x magnification and stitched together. High power images are 40x magnification.
Fig. 2.
Fig. 2.. EREG+ dendritic cells accumulate in human skin and lung fibrosis.
(A) Sankey diagram of enriched receptor-ligand pairs in SSc skin and at least two lung scRNA-Seq datasets. Ribbon width is proportional to 1/rank of the skin SSc data. (B) Plot of the CellphoneDB ranks (adjusted p-values) of the interaction of EREG with EGFR in our skin scRNA-Seq data as well as our analysis of available data from SSc skin (15) and lung (33, 41, 42). Dotted line shows rank = 0.05. (C) Ereg relative expression during a time course of tissue digestion of healthy mouse skin, n=3 per time point. (D) Expression of EREG in our UMAP embedded scRNA-Seq data. (E) Heatmap of co-expressed genes by SSc EREG-expressing APC (EREG+) compared to healthy EREG+ APC and EREG APC groups. For clarity, the raw gene list was filtered to genes primarily expressed by immune cells. (F) Expression of FCN1 in our UMAP embedded scRNA-Seq data. (G) Immunofluorescence images of EREG and FCN1 in SSc skin. (H, I) Analysis of EREG expression in SSc compared to healthy controls (H) and compared to modified Rodnan Skin Score (mRSS) (I) using data from (49). (J) Low and high magnification photomicrographs of skin and lung from SSc and healthy subject samples stained with EREG antibody. Dashed boxes delineate region shown in higher magnification image. Arrowheads label positive cells. (K) Enumeration of EREG+ cells in SSc skin dermis and lung (n=3 slides each, skin samples from patients SSc1, 3, and 4, 10 high power fields (hpf) per slide). Slides were imaged with a Keyence BZ-X800 microscope. Low power images are at 10x magnification and stitched together. High power images are 40x magnification. Data are means ± SD (***P<0.001, ****P<0.0001) analyzed with one-way analysis of variance (ANOVA) with Tukey multiple-comparisons test (C) and unpaired two-tailed Student t test (K).
Fig. 3.
Fig. 3.. Type I interferon induces EGFR-NOTCH circuit between EREG+ dendritic cells and fibroblasts.
(A) Expression fold change of EREG when THP-1 monocytes were incubated with each indicated cytokine. (B) EREG protein quantification from supernatant of THP-1 incubated with IFNa2 for 4 hours, n=4 per group, data is representative from 2 independent experiments. (C-E) EREG expression fold change from freshly isolated peripheral blood CD14+ monocytes (C) and CD1c+ dendritic cell precursors (D) or cultured human BMDC (E) after incubation with IFNα2. (F) Expression fold change of NOTCH ligands, receptors, and target genes by HFFs incubated with recombinant human EREG (n=5). (G) HES1 expression fold change in SSc fibroblasts after incubation with EREG for 4 hours, n=5 per group. (H) EREG relative expression by BMDC primed with IFNα2 prior to exposure to NOTCH ligand DLL4 (n=3–4 per time point in each group). Statistics compare each group ± DLL4. (I) Relative expression of EGFR ligands by HFF (n=3). Genes with fewer than three points were below detectable level. (J) Changes in ECM gene expression when HFF were incubated with media alone (NT) or EREG neutralizing antibody (Ereg Ab). FNEDA refers to the extra domain A-containing isoform of fibronectin (n=5 per group). (K) Model of EREG-NOTCH circuit between monocyte-derived DC3 and fibroblasts. Data are means ± SD (ns, not significant, *P < 0.05, **P < 0.01, ***P < 0.001, ****P<0.0001) analyzed with unpaired two-tailed Student t test (A-H, J) and one-way ANOVA with Tukey multiple-comparisons test (I).
Fig. 4.
Fig. 4.. Ereg has defined expression patterns during mouse skin and lung fibrosis.
(A-C) B6 mice were injected subcutaneously with 0.2 mg bleomycin (BLM) and 3 weeks later skin was stained for hematoxylin and eosin (A) and trichrome (B). Epidermis (epi), dermis (dermis) and dermal white adipose tissue (DWAT) are highlighted on histology. (C, D) Immunofluorescence images of PBS and BLM-treated skin 3 weeks post-injection. (E) Hydroxyproline content of the skin at different time points after subcutaneous bleomycin injection (n=3 per group). (F) Heatmap of mean log2(expression fold change) of ECM genes and EGFR ligands at different time points after subcutaneous bleomycin injection compared to the mean of each group and PBS controls, n=3 per time point. (G) Bulk RNA sequencing of dendritic cells isolated from fibrotic skin of Mgl2DTReGFPpANeo mice 3 weeks after subcutaneous bleomycin injection compared to PBS controls (n=3 per group). (H) Relative expression of Ereg at different time points after intratracheal bleomycin administration to B6 mice. (I) B6 mice were injected with bleomycin subcutaneously, then at 2 weeks injected intraperitoneally with Ifnar1-blocking antibody (Ifnar1 Ab), isotype control antibody (iso) or not treated (NT). No significant differences were found between NT and isotype Ab control groups, so they were combined for clarity. At 3 weeks, skin was analyzed for histology (J), dermal skin thickness (K), hydroxyproline (L), and gene expression (M, N). Data from E and F, G, and H are single independent experiments. Data in J-N are aggregated from two separate experiments. Data are means ± SD (ns, not significant, *P < 0.05, **P < 0.01, ***P < 0.001, ****P<0.0001) analyzed with one-way ANOVA with Tukey multiple-comparisons test (E, F, H, K) and unpaired two-tailed Student t test (L-N).
Fig. 5.
Fig. 5.. EREG inhibition alleviates mouse skin and lung fibrosis.
(A-C) Diagramed in (A), cohorts of B6 and Ereg−/− mice were injected with bleomycin subcutaneously and 35 days later analyzed for skin thickness (B) and histology (C). (D-I) Diagramed in (D), 21 days after bleomycin injection mice began treatment with Ereg antibody (Ereg Ab) compared to controls treated with PBS (NT) for two weeks. Skin was analyzed for dermal thickness (E), hydroxyproline (F), gene expression (G, H) and histology (I), with H&E staining on the top row, trichrome in the middle row, and pEGFR immunohistochemistry (IHC) on the bottom row, n=8 (PBS), 11 (BLM), and 12 (Ereg Ab). (J) B6 and Ereg−/− mice were injected with bleomycin or PBS and 3 weeks later B6 mice were treated for 1 week with Ereg Ab or isotype control Ab, n=3 (PBS), 5 (isotype Ab), 5 (Ereg Ab), and 5 NT Ereg−/−. (K-L) As diagramed in (K), 10 days after intratracheal bleomycin mice were treated with Ereg Ab for two weeks. Lungs were analyzed for histology (L), modified Ashcroft score (M), hydroxyproline (N) and Ereg gene expression (O), n=6 (PBS), 11 (BLM), and 7 (Ereg Ab). Histology images of skin and lung are 10x and 20x magnification, respectively. IHC images are 40x magnification. Data are means ± SD (ns, not significant, *P < 0.05, **P < 0.01, ***P<0.001, ****P<0.0001) analyzed with unpaired two-tailed Student t test (F-H, N, O) and one-way ANOVA with Tukey multiple-comparisons test (B, E, J, M). Data for J is single experiment and data for A-C, D-I, and K-O are aggregated from two independent experiments.
Fig. 6.
Fig. 6.. EREG inhibition reverses human skin and lung fibrosis.
(A) Experimental diagram depicting adjacent punch biopsies obtained from the forearm of a patient with diffuse cutaneous SSc, which were cultured for 9 days in media alone (NT) or with addition of EREG neutralizing antibody (Ereg Ab). (B) Histology of cultured skin explants, with inset showing higher magnification of dermal collagen. (C, D) Skin explant media was analyzed for pro-COL1A1 N-terminal peptide (PINP) and TNC. (E) Percent reduction of protein by Ereg Ab treatment compared to NT control. (F) LDH activity of skin explant supernatants from patient SSc7. (G-N) Fresh explanted lung tissue from a deceased patient donor with familial idiopathic pulmonary fibrosis was processed for histologic staining, which showed fibroblastic foci formation and hyperplasia of alveolar type II epithelial cells, indicated by arrows (left panel H&E, right panel trichrome). The same tissue was cut into cubes and cultured for 10 days in the presence of the multikinase inhibitor nintedanib (Nin), the Alk5 inhibitor A-1544033 (IN-1130) (Alk5i), EREG antibody (Ereg Ab) or non-treated vehicle control (NT). (H-K) Relative expression of indicated genes, n=4 per group. (L-N) Protein secretion of indicated genes measured by ELISA, n=8 per group. ELISA samples with poor signal and qPCR outliers identified by Grubbs’s test with alpha = 0.05 were excluded. Data are means ± SD (ns, not significant, *P < 0.05, **P < 0.01, ****P < 0.0001) analyzed with paired two-tailed Student t test (C-E) comparing NT and Ereg Ab treated samples. In (H-N), comparison of each inhibitor to NT control was analyzed by one-way ANOVA with Dunnett’s multiple-comparisons test whereas Ereg Ab was individually compared to Nin and Alk5i by unpaired two-tailed Student t test.

Comment in

References

    1. Gieseck RL 3rd, Wilson MS, Wynn TA, Type 2 immunity in tissue repair and fibrosis. Nat Rev Immunol, (2017). - PubMed
    1. Distler O, Highland KB, Gahlemann M, Azuma A, Fischer A, Mayes MD, Raghu G, Sauter W, Girard M, Alves M, Clerisme-Beaty E, Stowasser S, Tetzlaff K, Kuwana M, Maher TM, Investigators ST, Nintedanib for Systemic Sclerosis-Associated Interstitial Lung Disease. N Engl J Med, (2019). - PubMed
    1. Khanna D, Lin CJF, Furst DE, Goldin J, Kim G, Kuwana M, Allanore Y, Matucci-Cerinic M, Distler O, Shima Y, van Laar JM, Spotswood H, Wagner B, Siegel J, Jahreis A, Denton CP, focu S. i., Tocilizumab in systemic sclerosis: a randomised, double-blind, placebo-controlled, phase 3 trial. Lancet Respir Med 8, 963–974 (2020). - PubMed
    1. Olson LE, Soriano P, Increased PDGFRalpha activation disrupts connective tissue development and drives systemic fibrosis. Dev Cell 16, 303–313 (2009). - PMC - PubMed
    1. Chakraborty D, Zhu H, Jungel A, Summa L, Li YN, Matei AE, Zhou X, Huang J, Trinh-Minh T, Chen CW, Lafyatis R, Dees C, Bergmann C, Soare A, Luo H, Ramming A, Schett G, Distler O, Distler JHW, Fibroblast growth factor receptor 3 activates a network of profibrotic signaling pathways to promote fibrosis in systemic sclerosis. Sci Transl Med 12, (2020). - PubMed