. 2022 Dec 9;8(49):eabo5000.
doi: 10.1126/sciadv.abo5000. Epub 2022 Dec 9.

NARF is a hypoxia-induced coactivator for OCT4-mediated breast cancer stem cell specification

Affiliations

NARF is a hypoxia-induced coactivator for OCT4-mediated breast cancer stem cell specification

Yongkang Yang et al. Sci Adv. .

Abstract

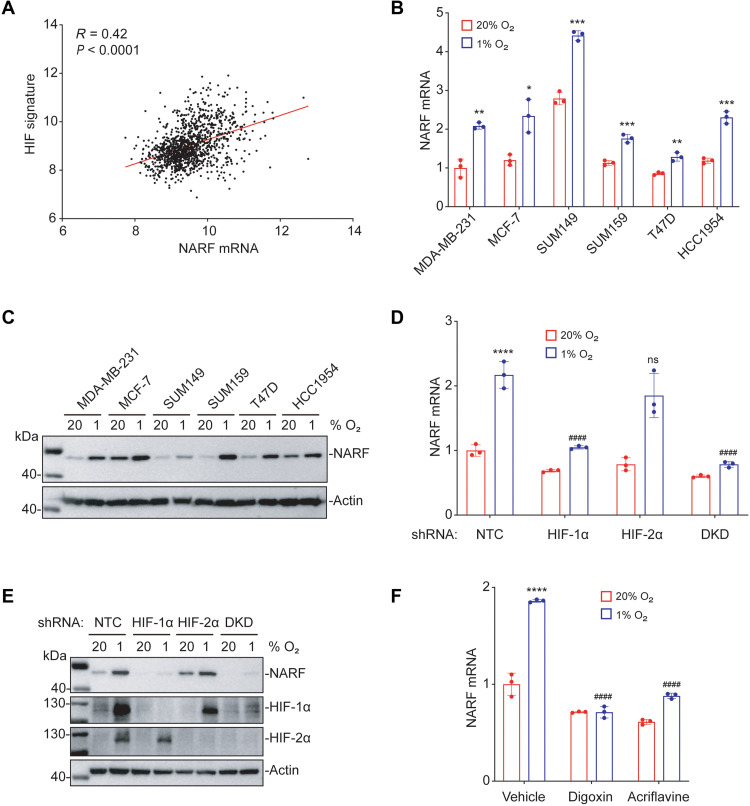
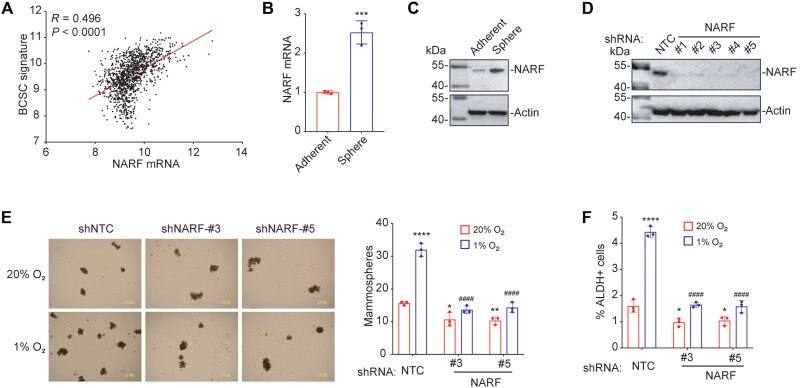
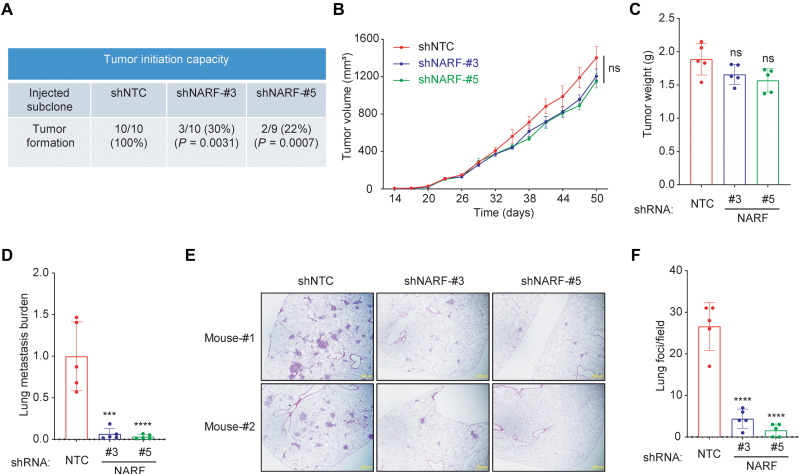
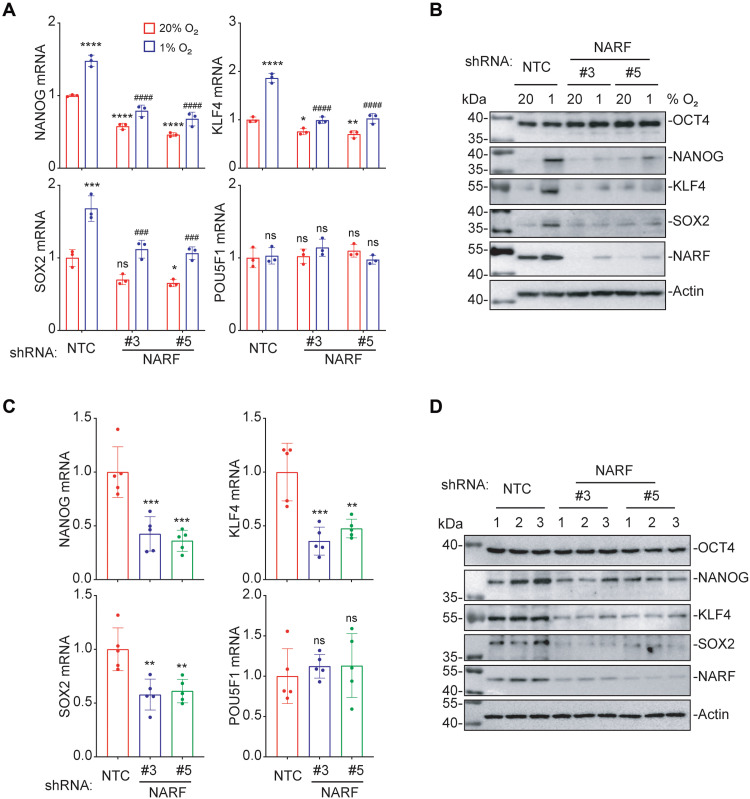
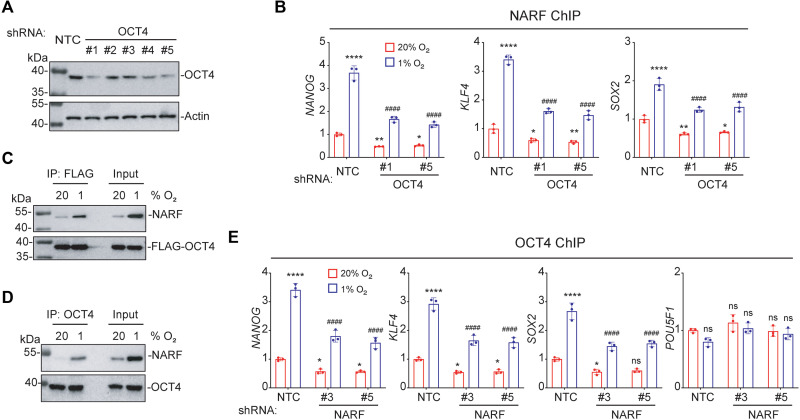
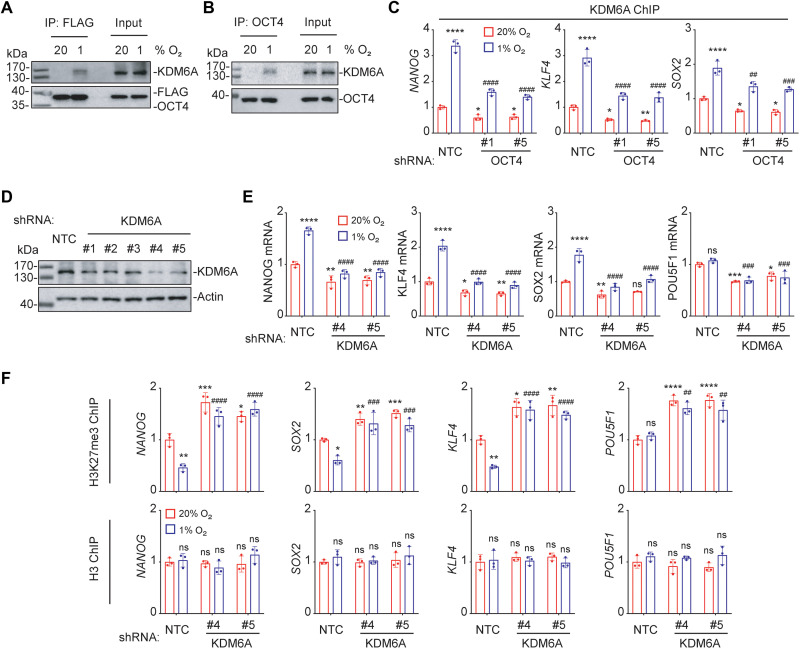
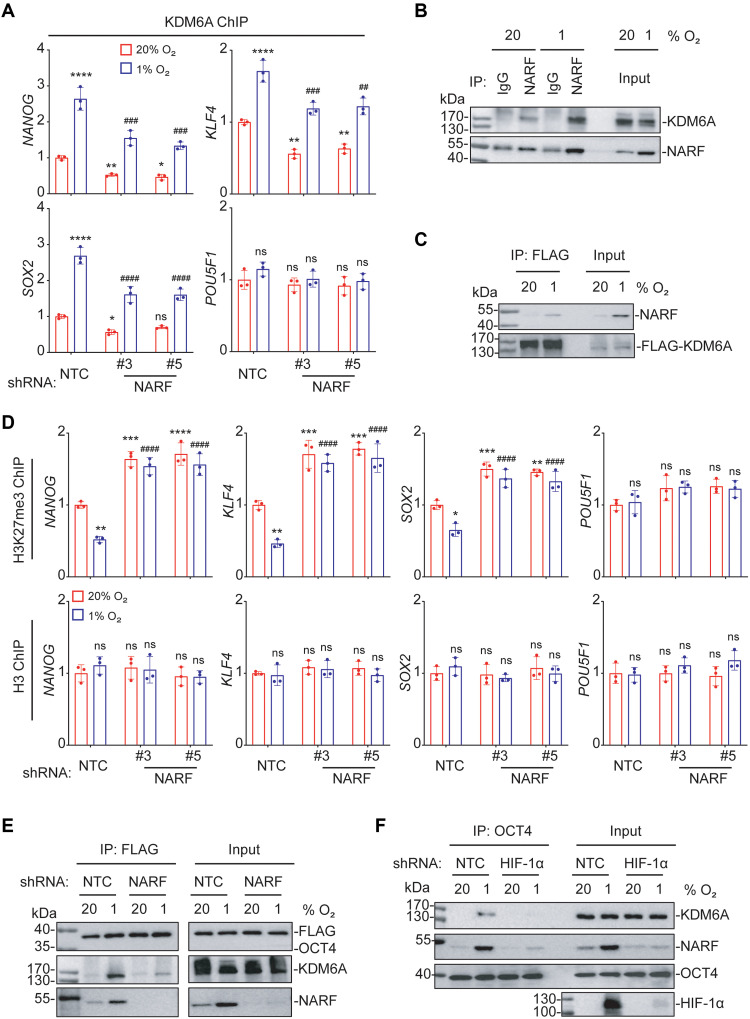
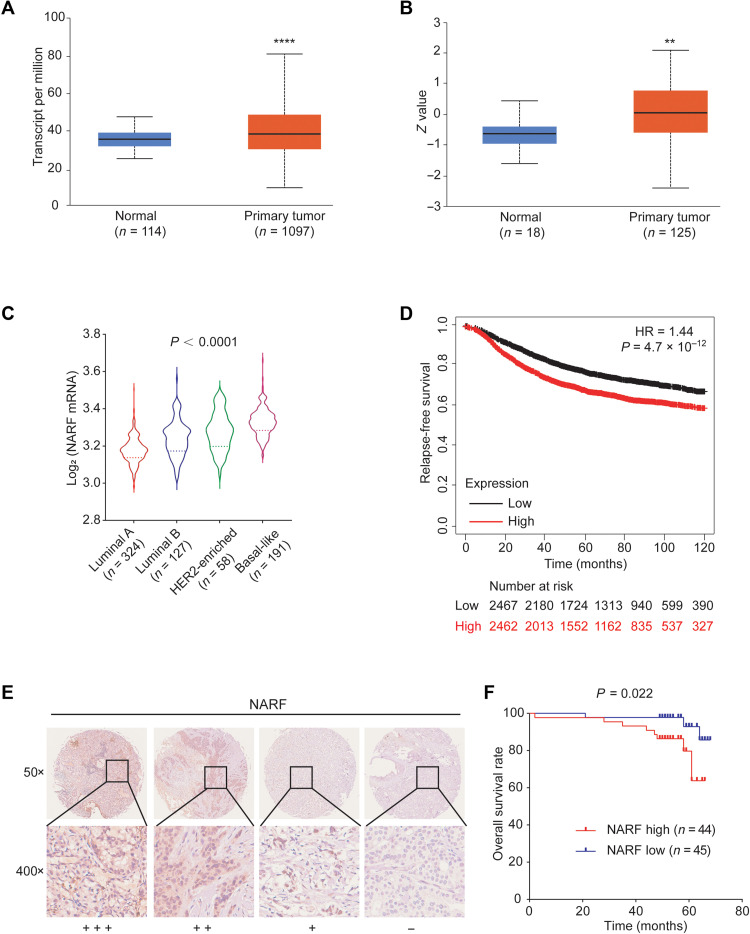
Hypoxia is a key characteristic of the breast cancer microenvironment that promotes expression of the transcriptional activator hypoxia-inducible factor 1 (HIF-1) and is associated with poor patient outcome. HIF-1 increases the expression or activity of stem cell pluripotency factors, which control breast cancer stem cell (BCSC) specification and are required for cancer metastasis. Here, we identify nuclear prelamin A recognition factor (NARF) as a hypoxia-inducible, HIF-1 target gene in human breast cancer cells. NARF functions as an essential coactivator by recruiting the histone demethylase KDM6A to OCT4 bound to genes encoding the pluripotency factors NANOG, KLF4, and SOX2, leading to demethylation of histone H3 trimethylated at lysine-27 (H3K27me3), thereby increasing the expression of NANOG, KLF4, and SOX2, which, together with OCT4, mediate BCSC specification. Knockdown of NARF significantly decreased the BCSC population in vitro and markedly impaired tumor initiation capacity and lung metastasis in orthotopic mouse models.


Figures

Fig. 1.
Fig. 1.. Hypoxia induces NARF expression in a HIF-1–dependent manner.
(A) NARF mRNA levels in 1218 human breast cancers from TCGA database were compared with the HIF signature using Pearson’s correlation test. (B and C) Six human breast cancer cell lines were exposed to 20 or 1% O2 for 24 hours (B) or 48 hours (C), and the expression of NARF mRNA (B) or protein (C) was analyzed by RT-qPCR (B) and immunoblot (C) assays, respectively. For each cell line, the expression of NARF mRNA was quantified relative to 18S rRNA and then normalized to the result obtained from MDA-MB-231 cells at 20% O2 (means ± SD; n = 3). *P < 0.05, **P < 0.01, and ***P < 0.001 versus 20% O2 [one-way analysis of variance (ANOVA)]. (D and E) MDA-MB-231 subclones, which stably expressed an NTC shRNA or shRNA targeting HIF-1α, HIF-2α, or both HIF-1α and HIF-2α (DKD), were exposed to 20 or 1% O2 for 24 hours, followed by analysis of NARF mRNA levels by RT-qPCR (means ± SD; n = 3) (D), or for 48 hours, followed by immunoblot assay (E). ****P < 0.0001 versus NTC at 20% O2; ####P < 0.0001 versus NTC at 1% O2; ns, not significant (two-way ANOVA with Tukey’s multiple comparisons test). (F) MDA-MB-231 cells were exposed to 20 or 1% O2 for 24 hours in the presence of vehicle, digoxin (100 nM), or acriflavine (5 μM), and expression of NARF mRNA was assayed by RT-qPCR (means ± SD; n = 3). ****P < 0.0001 versus vehicle at 20% O2; ####P < 0.0001 versus vehicle at 1% O2 (two-way ANOVA with Tukey’s multiple comparisons test).
Fig. 2.
Fig. 2.. NARF is a direct HIF-1 target gene.
(A) A match to the HIF consensus binding site 5′-(A/G)CGTG-3′ was identified in the human NARF gene at −95 bp relative to the transcription start site. (B) MDA-MB-231 cells were exposed to 20 or 1% O2 for 16 hours, and ChIP assays were performed using antibodies against HIF-1α, HIF-1β, or HIF-2α. Primers flanking the candidate HIF binding site were used for qPCR, and results were normalized to the mean result at 20% O2 (means ± SEM; n = 3). ***P < 0.001; ****P < 0.0001 versus 20% O2; ns, not significant (two-tailed Student’s t test). (C) The following reporter plasmids were generated: pNARF-HRE, containing a 55-bp candidate HRE, which was either wild type [WT; nucleotide sequence shown in (A)] or mutant (MUT), downstream of an SV40 promoter and FLuc coding sequences (top), and pSV-RL, a control plasmid containing RLuc coding sequences downstream of the SV40 promoter (bottom). (D) MDA-MB-231 cells were cotransfected with pSV-RL and pNARF-HRE (WT or MUT) and then exposed to 20 or 1% O2 for 24 hours. The FLuc/RLuc ratio was determined and normalized to WT at 20% O2 (means ± SEM; n = 3). ***P < 0.001 versus WT at 20% O2; ###P < 0.001 versus WT at 1% O2 (two-way ANOVA with Tukey’s multiple comparisons test).
Fig. 3.
Fig. 3.. NARF KD blocks hypoxia-induced BCSC enrichment.
(A) Expression of NARF mRNA and a BCSC signature composed of 20 mRNAs expressed in primary breast cancer samples were accessed from TCGA database, and the correlation was analyzed by Pearson’s test. (B and C) MDA-MB-231 cells were cultured on standard polystyrene tissue culture plates (Adherent) or ultralow attachment plates (Sphere) for 7 days and harvested for analysis of NARF mRNA (B) and protein (C) expression. Results were normalized to Adherent (means ± SD; n = 3). ***P < 0.001 versus Adherent (two-tailed Student’s t test). (D) MDA-MB-231 cells were stably transfected with NTC or a NARF shRNA vector (#1 to #5), and immunoblot assays were performed. (E) MDA-MB-231 subclones transduced with NTC or a NARF shRNA (#3 or #5) were exposed to 20 or 1% O2 for 72 hours; then, cells were cultured on ultralow attachment plates for 7 days, and the number of mammospheres per 1000 cells seeded was calculated (means ± SD; n = 3). *P < 0.05; **P < 0.01; ****P < 0.0001 versus NTC at 20% O2; ####P < 0.0001 versus NTC at 1% O2 (two-way ANOVA with Tukey’s multiple comparisons test). Scale bar, 1 mm. (F) MDA-MB-231 subclones were exposed to 20 or 1% O2 for 72 hours, and the percentage of aldehyde dehydrogenase-expressing (ALDH+) cells was determined (means ± SD; n = 3). *P < 0.05; ****P < 0.0001 versus NTC at 20% O2; ####P < 0.0001 versus NTC at 1% O2 (two-way ANOVA with Tukey’s multiple comparisons test).
Fig. 4.
Fig. 4.. NARF KD impairs tumor formation and metastasis.
(A) MDA-MB-231 subclones (1 × 103 cells) transduced with NTC or a NARF shRNA vector (#3 or #5) were implanted into the MFP of 7-week-old female SCID mice. The proportion of mice with tumors after 10 weeks and P value (versus NTC; Fisher’s exact test) are shown. (B and C) MDA-MB-231 subclones (2 × 106 cells) were implanted into the MFP. Primary tumor volume (B) was determined starting at day 14. On day 50, the primary tumor was harvested and weighed (C). (D) To analyze lung metastasis, genomic DNA was purified from one lung for qPCR using human-specific HK2 primers, and the results were normalized to the NTC group. (E and F) The contralateral lung was fixed under inflation and paraffin-embedded, and sections were stained with hematoxylin and eosin (E) (scale bar, 0.5 mm) to count the number of metastatic foci per field (F). For all graphs, means ± SEM (n = 5) are shown; ***P < 0.001; ****P < 0.0001 versus NTC; ns, not significant (one-way ANOVA).
Fig. 5.
Fig. 5.. NARF is required for OCT4-mediated pluripotency factor expression in vitro and in vivo.
(A) MDA-MB-231 subclones were exposed to 20 or 1% O2 for 24 hours, and RT-qPCR assays were performed to analyze expression of NANOG, KLF4, SOX2, and POU5F1 (OCT4) mRNA. *P < 0.05; **P < 0.01; ***P < 0.001; ****P < 0.0001 versus NTC at 20% O2; ###P < 0.001; ####P < 0.0001 versus NTC at 1% O2; ns, not significant (two-way ANOVA with Tukey’s multiple comparisons test). (B) MDA-MB-231 subclones were exposed to 20 or 1% O2 for 48 hours, and immunoblot assays were performed. (C and D) MDA-MB-231 subclones (2 × 106 cells) were implanted into the MFP. On day 50, tumors were harvested for RT-qPCR (C) and immunoblot assays (D). **P < 0.01; ***P < 0.001 versus NTC; ns, not significant (one-way ANOVA).
Fig. 6.
Fig. 6.. OCT4 recruits NARF to pluripotency factor genes.
(A) MDA-MB-231 cells were stably transfected with NTC or an OCT4 shRNA vector (#1 to #5), and immunoblot assays were performed. (B) MDA-MB-231 subclones were exposed to 20 or 1% O2 for 48 hours, and ChIP assays were performed using antibody against NARF. Primers flanking OCT4 binding sites in the indicated genes were used for qPCR. For each primer pair, the qPCR data were normalized to the mean result at 20% O2 (means ± SEM; n = 3); *P < 0.05; **P < 0.01; ****P < 0.0001 versus NTC at 20% O2; ####P < 0.0001 versus NTC 1% O2 (two-way ANOVA with Tukey’s multiple comparisons test). (C) MDA-MB-231 cells were transfected with FLAG-OCT4 expression vector and exposed to 20 or 1% O2 for 48 hours. IP was performed using FLAG antibody followed by immunoblot assays with NARF antibody. (D) MDA-MB-231 cells were exposed to 20 or 1% O2 for 48 hours. IP was performed using OCT4 antibody, followed by immunoblot assays. (E) MDA-MB-231 subclones were exposed to 20 or 1% O2 for 48 hours, and ChIP-qPCR assays were performed using antibody against OCT4 and primers flanking OCT4 binding sites in the indicated genes. The qPCR data were normalized to the mean result at 20% O2 (means ± SEM; n = 3); *P < 0.05; ****P < 0.0001 versus NTC at 20% O2; ####P < 0.0001 versus NTC 1% O2 (two-way ANOVA with Tukey’s multiple comparisons test).
Fig. 7.
Fig. 7.. OCT4 recruits KDM6A to erase H3K27me3 chromatin marks.
(A) MDA-MB-231 cells were transfected with FLAG-OCT4 expression vector and exposed to 20 or 1% O2 for 48 hours. IP was performed using FLAG antibody followed by immunoblot assays. (B) MDA-MB-231 cells were exposed to 20 or 1% O2 for 48 hours. IP was performed using OCT4 antibody, followed by immunoblot assays. (C) MDA-MB-231 subclones were exposed to 20 or 1% O2 for 48 hours, and ChIP-qPCR assays were performed using antibody against KDM6A and primers flanking OCT4 binding sites. The qPCR data were normalized to the mean result at 20% O2 (means ± SEM; n = 3); *P < 0.05; **P < 0.01; ****P < 0.0001 versus NTC at 20% O2; ##P < 0.01; ###P < 0.001; ####P < 0.0001 versus NTC 1% O2 (two-way ANOVA with Tukey’s multiple comparisons test). (D) MDA-MB-231 cells were stably transfected with NTC or a KDM6A shRNA vector (#1 to #5), and immunoblot assays were performed. (E) MDA-MB-231subclones were exposed to 20 or 1% O2 for 24 hours, and RT-qPCR assays were performed. *P < 0.05; **P < 0.01; ***P < 0.001; ****P < 0.0001 versus NTC at 20% O2; ###P < 0.001; ####P < 0.0001 versus NTC at 1% O2; ns, not significant (two-way ANOVA with Tukey’s multiple comparisons test). (F) MDA-MB-231 subclones were exposed to 20 or 1% O2, and ChIP-qPCR was performed (means ± SEM; n = 3); *P < 0.05; **P < 0.01; ***P < 0.001; ****P < 0.0001 versus NTC at 20% O2; ##P < 0.01; ###P < 0.001; ####P < 0.0001 versus NTC at 1% O2; ns, not significant (two-way ANOVA with Tukey’s multiple comparisons test).
Fig. 8.
Fig. 8.. NARF is required for KDM6A-mediated H3K27me3 demethylation at OCT4 binding sites.
(A) MDA-MB-231 subclones were exposed to 20 or 1% O2 for 48 hours, and ChIP-qPCR assays were performed using antibody against KDM6A and primers flanking OCT4 binding sites in the indicated genes. The qPCR data were normalized to the mean result at 20% O2 (means ± SEM; n = 3); *P < 0.05; **P < 0.01; ****P < 0.0001 versus NTC at 20% O2; ##P < 0.01; ###P < 0.001; ####P < 0.0001 versus NTC 1% O2 (two-way ANOVA Tukey’s multiple comparisons). (B) MDA-MB-231 cells were exposed to 20 or 1% O2 for 48 hours. IP was performed using immunoglobulin G or NARF antibody, followed by immunoblot assays. (C) MDA-MB-231 subclones were transfected with FLAG-KDM6A expression vector and exposed to 20 or 1% O2 for 48 hours. IP was performed using FLAG antibody, followed by immunoblot assays. (D) MDA-MB-231 subclones were exposed to 20 or 1% O2, and ChIP-qPCR assays were performed using H3K27me3 or H3 antibody and primers flanking OCT4 binding sites in the indicated genes (means ± SEM; n = 3); *P < 0.05; **P < 0.01; ***P < 0.001; ****P < 0.0001 versus NTC at 20% O2; ####P < 0.0001 versus NTC at 1% O2; ns, not significant (two-way ANOVA Tukey’s multiple comparisons). (E) MDA-MB-231 subclones were transfected with FLAG-OCT4 expression vector and exposed to 20 or 1% O2 for 48 hours. IP was performed using FLAG antibody, followed by immunoblot assays. (F) NTC or HIF-1α-KD subclones of MDA-MB-231 cells were exposed to 20 or 1% O2 for 48 hours. IP was performed using OCT4 antibody, followed by immunoblot assays.
Fig. 9.
Fig. 9.. NARF is highly expressed in human breast cancers and is correlated with patient mortality.
(A) NARF mRNA expression in primary breast cancer samples (n = 1097) relative to adjacent normal tissue (n = 114) from TCGA database is shown. ****P < 0.0001 versus normal (two-tailed Student’s t test). (B) NARF protein expression in primary breast cancer samples (n = 125) relative to normal breast tissue (n = 18) from Clinical Proteomic Tumor Analysis Consortium database is shown. **P < 0.01 versus normal (two-tailed Student’s t test). (C) The relative log2 expression of NARF mRNA from 700 human breast cancer specimens that were stratified according to molecular subtype is shown. Statistical analysis was performed by one-way ANOVA with Bonferroni’s post hoc testing; P < 0.0001 for basal-like versus other groups. (D) Kaplan-Meier analysis of relapse-free survival over 10 years was performed on the basis of clinical and molecular data from 4929 breast cancer patients. The patients were stratified by NARF mRNA levels in the primary tumor, which were greater (red) or less (black) than the median. The hazard ratio (HR) and P value (log-rank test) are shown. (E and F) Immunohistochemical staining for NARF was performed in tumor tissue from 89 patients with breast cancer (E). Kaplan-Meier analysis for overall survival (F) was performed according to scoring of NARF expression.
Fig. 10.
Fig. 10.. HIF-1–dependent NARF expression promotes OCT4-mediated breast cancer stem cell specification.
(A and B) Hypoxia induces HIF-1–mediated expression of NARF (A), which enables KDM6A recruitment to OCT4 binding sites to erase inhibitory H3K27me3 chromatin marks, thereby licensing transcription of OCT4 target genes encoding pluripotency factors (NANOG, KLF4, and SOX2) that specify the BCSC phenotype (B).

References

    1. H. Sung, J. Ferlay, R. L. Siegel, M. Laversanne, I. Soerjomataram, A. Jemal, F. Bray,Global cancer statistics 2020: GLOBOCAN estimates of incidence and mortality worldwide for 36 cancers in 185 countries. CA Cancer J. Clin. 71,209–249 (2021). - PubMed
    1. G. P. Gupta, J. Massagué,Cancer metastasis: Building a framework. Cell 127,679–695 (2006). - PubMed
    1. P. S. Steeg,Tumor metastasis: Mechanistic insights and clinical challenges. Nat. Med. 12,895–904 (2006). - PubMed
    1. R. Bos, H. Zhong, C. F. Hanrahan, F. C. Mommers, G. L. Semenza, H. M. Pinedo, M. D. Abeloff, J. W. Simons, P. J. van Diest, E. van der Wall,Levels of hypoxia-inducible factor-1α during breast carcinogenesis. J. Natl. Cancer Inst. 93,309–314 (2001). - PubMed
    1. A. L. Harris,Hypoxia—A key regulatory factor in tumour growth. Nat. Rev. Cancer 2,38–47 (2002). - PubMed