. 2022 Dec 9;8(49):eabq8437.
doi: 10.1126/sciadv.abq8437. Epub 2022 Dec 9.

Oncogenic deubiquitination controls tyrosine kinase signaling and therapy response in acute lymphoblastic leukemia

Affiliations

Oncogenic deubiquitination controls tyrosine kinase signaling and therapy response in acute lymphoblastic leukemia

Qi Jin et al. Sci Adv. .

Abstract

Dysregulation of kinase signaling pathways favors tumor cell survival and therapy resistance in cancer. Here, we reveal a posttranslational regulation of kinase signaling and nuclear receptor activity via deubiquitination in T cell acute lymphoblastic leukemia (T-ALL). We observed that the ubiquitin-specific protease 11 (USP11) is highly expressed and associates with poor prognosis in T-ALL. USP11 ablation inhibits leukemia progression in vivo, sparing normal hematopoiesis. USP11 forms a complex with USP7 to deubiquitinate the oncogenic lymphocyte cell-specific protein-tyrosine kinase (LCK) and enhance its activity. Impairment of LCK activity leads to increased glucocorticoid receptor (GR) expression and glucocorticoids sensitivity. Genetic knockout of USP7 improved the antileukemic efficacy of glucocorticoids in vivo. The transcriptional activation of GR target genes is orchestrated by the deubiquitinase activity and mediated via an increase in enhancer-promoter interaction intensity. Our data unveil how dysregulated deubiquitination controls leukemia survival and drug resistance, suggesting previously unidentified therapeutic combinations toward targeting leukemia.


Figures

Fig. 1.
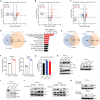
Fig. 1.. USP11 is essential for T cell leukemia.
(A) P value of survival analysis of 52 USP-encoding transcripts in T-ALL patients based on their expression from the Pediatric Cancer Genome Project data portal (PeCan, St. Jude, Memphis). Red indicates high expression (top, 33%) that is associated significantly with poor prognosis, and blue indicates low expression (bottom, 66%) that is significantly associated with poor prognosis. (B) Survival of pediatric T-ALL patients based on low (blue line) or high (red line) USP11 expression (source: PeCan). (C) Heatmap showing the expression of significant USPs in T-ALL patients (n = 6) and control T cells (CD3+ T cells, n = 3). (D) Western blot analysis for USP11 (top) and NOTCH1 (center) in control CD3+ T cells from the peripheral blood of healthy donors, bone marrow biopsies from T-ALL patients, and the human T-ALL cell lines JURKAT, CUTLL1, LOUCY, CEM, and MOLT13. (E) Reverse-phase protein array (RPPA) analysis of USP11 in non–high-risk [standard risk (n = 13) and medium risk (n = 28) combined] and high-risk (n = 16) groups of T-ALL patients (Mann-Whitney t test, P = 0.011). The risk group is classified by minimal residual disease (MRD) status (see Methods). A.U., arbitrary units; HR, high risk. (F) Immunoblot detection of USP11 protein levels (left) and growth curves of control- and shUSP11-expressing CUTLL1 cells over a period of 4 days (n = 3, right; ****P < 0.0001). Glyceraldehyde-3-phosphate dehydrogenase (GAPDH) is used as loading control. (G) Annexin V staining (72 hours) of CUTLL1 cells that expressed either control shRNA or shUSP11. Experiment was repeated three times, and a representative example is shown. (H) Edu staining (72 hours) following control shRNA or shUSP11 in CUTLL1 cells. The means ± SD from two representative studies are shown.
Fig. 2.
Fig. 2.. In vivo targeting of USP11 impedes T cell leukemia growth, sparing thymic development.
(A) Quantification of tumor growth in vivo (left) and representative bioluminescence pictures of immunocompromised animals (right) that were transplanted (intravenous injection) with Luciferase-expressing CUTLL1 cells that were previously transduced with a lentiviral vector expressing either a control hairpin RNA, shUSP11.1, or shUSP11.2, and selected using puromycin for a period of 3 days. Leukemic burden was assessed twice per week by bioluminescence measurements. Relative bioluminescence intensity is shown for three representative mice per group on days 12 and 26 after transplantation (right). The fold change in total flux from days 12 to 26 is shown on the left (****P < 0.0001). (B) Survival analysis of immunocompromised mice transplanted with control hairpin RNA-, shUSP11.1-, or shUSP11.2-expressing CUTLL1 cells. P value was calculated by log-rank (Mantel-Cox) test. (C) Genotype confirmation of wild-type (WT) or knockout (KO) mice for the detection of the Usp11 allele in tail DNA. (D) Representative thymi in different Usp11 genotypic mice. (E) Total number of thymocytes in Usp11+/y (n = 5), Usp11−/y (n = 5), Usp11+/+ (n = 4), Usp11+/− (n = 4), and Usp11−/− (n = 4) mice at age 6 to 8 weeks. ns, not significant. (F) Flow cytometry analysis of major thymic subsets in mice with different Usp11 alleles is shown. Representative images of the flow cytometry analysis are shown on the left. Relative proportions of the major cell populations in the thymus of Usp11+/y (n = 3), Usp11−/y (n = 3), Usp11+/+ (n = 3), Usp11+/− (n = 3), and Usp11−/− (n = 3) mice is shown in the bar graphs on the right. DP cells express both CD4 and CD8 markers (“double positive”), whereas the DN (double negative) population are negative for both CD4 and CD8, which can be further classified as DN1 (CD44+/CD25), DN2 (CD44+/CD25+), DN3 (CD44/CD25+), and DN4 (CD44/CD25). ns, not significant.
Fig. 3.
Fig. 3.. USP11 and USP7 form an oncogenic complex with LCK and control its activity through deubiquitination in T cell leukemia.
(A) Schematic representation of USP11-related immunoprecipitation mass spectrometry (MS) and lysine ubiquitome analysis in CUTTL1 cells. (B) Analysis of the overlapping datasets for USP11 immunoprecipitation and KεGG MS studies. (C) Heatmap representation of correlation for USP7, USP11, Src-Y416, and LCK in T-ALL patients by RPPA analysis (significant Pearson r values were shown, P < 0.05). (D) Heatmap showing concentrations causing 50% cell growth inhibition (GI50) for DXM, dasatanib, and USP7 inhibitor. (E) Immunoblot detection of LCK, LCK phospho-Y505, Src phospho-Y416, and GAPDH (left). Growth of control- and shLCK-expressing CUTLL1 cells (right; n = 3; *P < 0.05 and **P < 0.01). (F) Immunoblot studies following immunoprecipitation (IP) for USP11 (left), LCK (middle), and USP7 (right) in CUTLL1 cells. USP7, USP11, LCK, USP14, and actin were detected. (G) Colocalization of USP11 (green) and UPS7 (green) with LCK (red) in CUTLL1 cells. Scale bars, 5 μm. Pearson’s correlation score of internalized USP11 and LCK (top right) or USP7 and LCK (bottom right). (H) Immunoblot studies for LCK, USP7, and USP11 following isolation of whole-cell extracts and gel filtration chromatography in JURKAT cells. (I) Box plot showing ubiquitinated peptides of LCK upon shUSP11 (left) and USP7i treatment (10 μM) (right). (J) Analysis of gained lysine ubiquitination sites within LCK upon shUSP11 (top) and USP7i treatment (bottom). (K) Ubiquitination assay for LCK ubiquitination status in 293 T cells in the presence of WT or mutant (CS) USP11. (L) Ubiquitination assay for LCK ubiquitination status in 293 T cells in the presence of WT or mutant (CS) USP7. (M) Ubiquitination analysis of LCK in 293 T cells overexpressing USP7, USP11, or both. (N) Immunoblot detection of USP11, USP7, LCK, LCK phospho-Y505, Scr phospho-Y416, and GAPDH in CUTLL1 cells expressing control shRNA, shUSP7, shUSP11, and shUSP7 plus shUSP11.
Fig. 4.
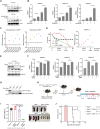
Fig. 4.. Disruption of LCK activity dampens TCR signaling and increases GR expression.
(A to C) Volcano plots showing changes in peptides with phospho-tyrosines in shUSP11 versus control, USP7i (5 μM) versus control, and dasatinib (5 μM) versus control comparisons in CUTLL1 cells. Multiple unpaired t test analyses (P value) followed by false discovery rate (FDR) (Q value) analysis were performed. UP, increase; DN, decrease. Y564 phosphorylation of the well-characterized LCK substrate SHP-1 is shown. (D) Venn diagram showing overlap of peptides with phospho-tyrosines in shUSP11 versus control and dasatinib versus control comparisons in CUTLL1 cells (left). KEGG analysis for overlapping proteins (right). (E) Analysis of RNA-seq data showing the overlap of down-regulated genes (DN, left) or up-regulated genes (UP, right) upon dasatinib (5 μM) treatment or shUSP11 in CUTLL1 cells. (F) Analysis of RNA-seq data showing the expression of NR3C1 in control and shUSP11 groups (left or control and dasatinib treatment groups (right) (n = 3, ***P < 0.001). (G) Analysis of quantitative proteomics data showing the expression of GR in control (n = 3), dasatinib-treated (n = 2, ***P < 0.001), and shUSP11 cells (n = 3, **P < 0.01). (H) Immunoblot detection of GR, LCK, LCK phospho-Y505, Scr phospho-Y416, and actin upon treatment with dasatinib (5 μM), bosutinib (5 μM), and WH-4-023 (5 μM) for 6 hours in CUTLL1 cells (left) or DND41 cells (GR detection is shown, right). DMSO, dimethyl sulfoxide. (I) Immunoblot detection of USP11, GR, and actin in control and shUSP11-expressing CUTLL1 cells. (J) Immunoblot detection of LCK, GR, and actin upon ectopic expression of LCK (LCK o/e) in DND41 cells coupled to treatment with WH-4-023 (2 μM) or dasatinib (2 μM) for 6 hours. (K) Immunoblot detection of GR and actin upon treatment of CUTLL1 cells (top) or DND41 cells (bottom) with CD3/CD28 beads or WH-04-23 (2 μM) for 6 hours.
Fig. 5.
Fig. 5.. Impairment of the LCK-USP7/USP11 axis enhances GC response in T cell leukemia in vitro and in vivo.
(A) Immunoblot detection of GR and actin upon DXM (1 μM), dasatinib (2 μM), or combination treatment for 6 hours (top) and DXM (1 μM), WH-04-23 (2 μM), or combination treatment for 6 hours (bottom) in CUTLL1 cells. (B) Reverse transcription (RT)–quantitative polymerase chain reaction (qPCR) analysis of NR3C1 in T-ALL patient samples treated with DMSO, DXM (100 nM), dasatinib (2 μM), or the combination for 6 hours (*P < 0.05 and **P < 0.01). (C) Highest Single Agent (HSA) synergy score for USP7 inhibitor and DXM (left) or USP7 inhibitor and prednisone (right) for 5 days in seven patient samples. (D) Dose response curves from DXM, USP7i, and the combination treatment (left) and HSA synergy score (right). The error bars represent the SD of two technical replicates. (E) Immunoblot detection of GR and GAPDH with or without DXM treatment (1 μM) in shUSP11-expressing CUTLL1 cells. Relative GR expression is normalized to GAPDH. (F) RT-qPCR analysis of NR3C1 in patient samples treated with DXM [20 nM (patients 2 and 4) or 50 nM (patient 13)], USP7i (5 μM), or their combination for 6 hours (*P < 0.05, **P < 0.01, and ***P < 0.001). (G) Genotype confirmation of the floxed allele of Usp7 in tail DNA. (H) Schematic representation for generating NOTCH1-driven leukemic cells from Mx1Cre+-Usp7fl/fl or Mx1Cre+-Usp7+/+ mice. The leukemic cells (LCs) were transplanted in secondary recipient mice, treated with vehicle (phosphate-buffered saline) or with DXM (5 mg/kg). HSPCs, hematopoietic stem progenitor cells; PLCs, preleukemia cells; pI:C, polyinosinic:polycytidylic acid. (I) Spleen weight from secondary recipient mice when humane end points were reached or on day 63 (end of the study, left; **P < 0.01 and ****P < 0.0001). Representative images of spleens (right). (J) Survival curve of the recipient mice from the secondary transplants in (I). P value was calculated by log-rank (Mantel-Cox) test (**P < 0.01 and ***P < 0.001).
Fig. 6.
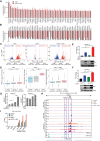
Fig. 6.. USP7 inhibition potentiates GC-induced chromatin organization changes and transcriptional activation in proapoptotic loci.
(A and B), Gene expression analysis using RNA-seq (n = 3, *P < 0.05). The top 50 genes activated (A) and repressed (B) by DXM and combination (USP7i + DXM)–treated DND41 cells. (C) Volcano plot showing ATAC peak changes in the DXM group (left), USP7i group (middle), or combination group (right), normalized to the control group in DND41 cells. (D) Gene expression analysis for transcripts associated with loss, stable, or gained ATAC signal for the same groups shown in (C) (****P < 0.0001). (E) RT-qPCR analysis of BCL2L11 in DND41 cells treated with DXM (1 μM), USP7i (5 μM), or their combination for 24 hours (top). Immunoblot detection of BIM and actin in DND41 cells (bottom, *P < 0.05). (F) BCL2L11 expression using RNA-seq analysis performed upon shUSP11 in CUTLL1 cells treated with DXM or not (top). Immunoblot detection of BIM and actin is shown (bottom) in DND41 cells (*P < 0.05). (G) RT-qPCR analysis of BCL2L11 in T-ALL patient sample treated with DMSO, DXM (100 nM), dasatinib (2 μM), or their combination for 6 hours (**P < 0.01) (left) or DMSO, DXM (20 nM), USP7i (5 μM), or their combination for 6 hours (*P < 0.05) (right). (H) Snapshots of BCL2L11 loci (IGV browser) presenting with gene expression (RNA-seq), chromatin accessibility (ATAC-seq), genomic interactions (virtual 4C), H3K27ac, and H3K4me1 status upon combination of GCs (DXM), USP7i, or their combination. Viewpoint, promoter of BCL2L11 (purple square); IGR, intronic GR-binding region (blue square). (I) Chromatin immunoprecipitation (ChIP)–qPCR analysis of GR binding on the promoter (prom) or IGR1/2 of BCL2L11 (51) or non–GR-bound genes UBC, TBP, and HRTP1 in DND41 cells treated with of DXM (1 μM), USP7i (5 μM), or their combination for 6 hours. Data are plotted as percentage of the input DNA (1%). The error bars represent two technical replicates (*P < 0.05).
Fig. 7.
Fig. 7.. The role of LCK-USP7/USP11 axis and impact of its targeting on GC response.
USP7 and USP11 deubiquitinate LCK to maintain the protein in the active, Y394-phosporylated state leading to inhibition of GR signaling pathway activity reduced GR binding to proapoptotic genes and reduced apoptosis upon application of GCs (left). We present that targeting USP7/USP11 (or LCK) leads to the up-regulation of NR3C1 transcript and GR protein expression and concomitant enhancement of GR signaling pathway activity (green arrow), which induces apoptosis upon GC treatment via chromatin changes and increased expression of proapoptotic genes (right).

Similar articles

Cited by

References

    1. E. Piovan, J. Yu, V. Tosello, D. Herranz, A. Ambesi-Impiombato, A. C. Da Silva, M. Sanchez-Martin, A. Perez-Garcia, I. Rigo, M. Castillo, S. Indraccolo, J. R. Cross, E. de Stanchina, E. Paietta, J. Racevskis, J. M. Rowe, M. S. Tallman, G. Basso, J. P. Meijerink, C. Cordon-Cardo, A. Califano, A. A. Ferrando,Direct reversal of glucocorticoid resistance by AKT inhibition in acute lymphoblastic leukemia. Cancer Cell 24,766–776 (2013). - PMC - PubMed
    1. O. R. Bandapalli, M. Zimmermann, C. Kox, M. Stanulla, M. Schrappe, W.-D. Ludwig, R. Koehler, M. U. Muckenthaler, A. E. Kulozik,NOTCH1 activation clinically antagonizes the unfavorable effect of PTEN inactivation in BFM-treated children with precursor T-cell acute lymphoblastic leukemia. Haematologica 98,928–936 (2013). - PMC - PubMed
    1. G. Wei, D. Twomey, J. Lamb, K. Schlis, J. Agarwal, R. W. Stam, J. T. Opferman, S. E. Sallan, M. L. den Boer, R. Pieters, T. R. Golub, S. A. Armstrong,Gene expression-based chemical genomics identifies rapamycin as a modulator of MCL1 and glucocorticoid resistance. Cancer Cell 10,331–342 (2006). - PubMed
    1. G. Tzoneva, A. Perez-Garcia, Z. Carpenter, H. Khiabanian, V. Tosello, M. Allegretta, E. Paietta, J. Racevskis, J. M. Rowe, M. S. Tallman, M. Paganin, G. Basso, J. Hof, R. Kirschner-Schwabe, T. Palomero, R. Rabadan, A. Ferrando,Activating mutations in the NT5C2 nucleotidase gene drive chemotherapy resistance in relapsed ALL. Nat. Med. 19,368–371 (2013). - PMC - PubMed
    1. J. A. Meyer, J. Wang, L. E. Hogan, J. J. Yang, S. Dandekar, J. P. Patel, Z. Tang, P. Zumbo, S. Li, J. Zavadil, R. L. Levine, T. Cardozo, S. P. Hunger, E. A. Raetz, W. E. Evans, D. J. Morrison, C. E. Mason, W. L. Carroll,Relapse-specific mutations in NT5C2 in childhood acute lymphoblastic leukemia. Nat. Genet. 45,290–294 (2013). - PMC - PubMed

MeSH terms

Substances