. 2022 Dec 20;94(50):17379-17387.
doi: 10.1021/acs.analchem.2c01610. Epub 2022 Dec 9.

Cov2MS: An Automated and Quantitative Matrix-Independent Assay for Mass Spectrometric Measurement of SARS-CoV-2 Nucleocapsid Protein

Affiliations

Cov2MS: An Automated and Quantitative Matrix-Independent Assay for Mass Spectrometric Measurement of SARS-CoV-2 Nucleocapsid Protein

Bart Van Puyvelde et al. Anal Chem. .

Abstract

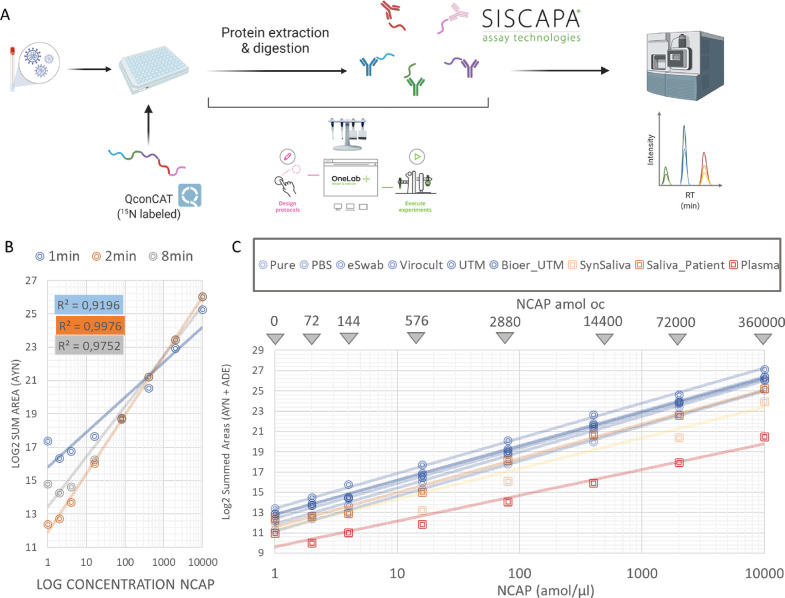
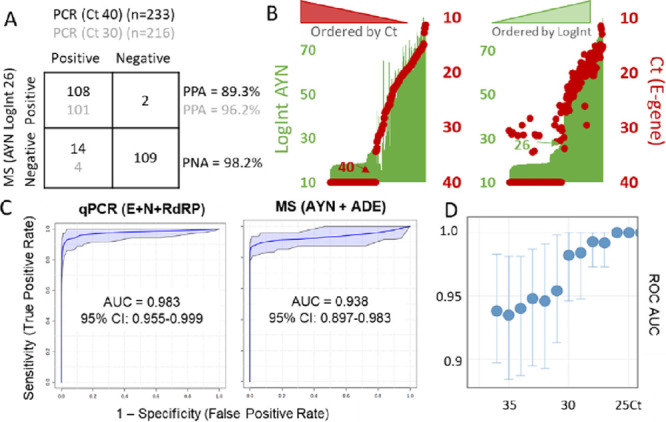
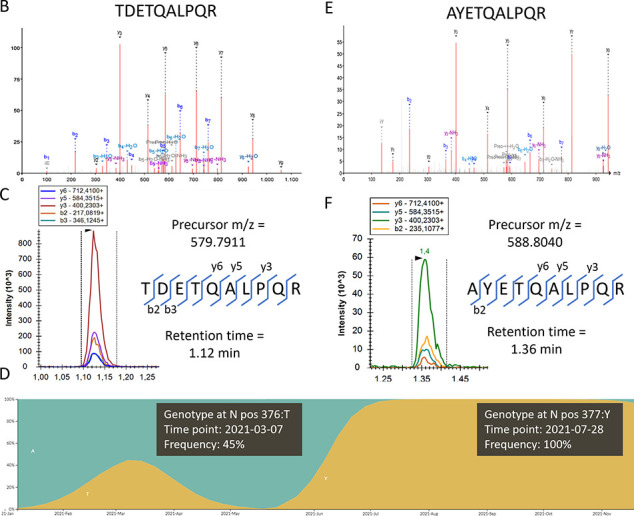
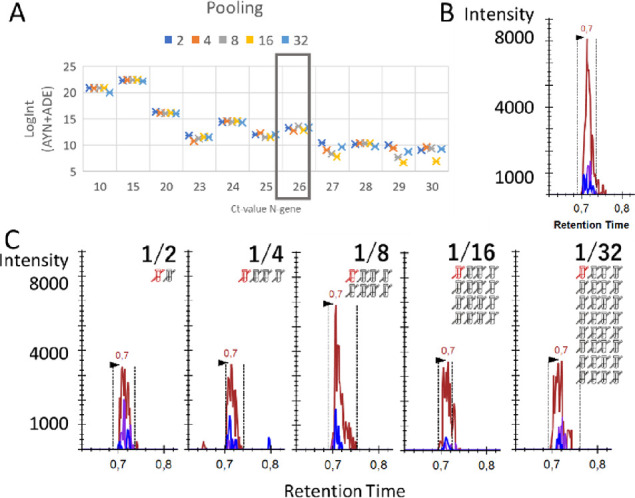
The pandemic readiness toolbox needs to be extended, targeting different biomolecules, using orthogonal experimental set-ups. Here, we build on our Cov-MS effort using LC-MS, adding SISCAPA technology to enrich proteotypic peptides of the SARS-CoV-2 nucleocapsid (N) protein from trypsin-digested patient samples. The Cov2MS assay is compatible with most matrices including nasopharyngeal swabs, saliva, and plasma and has increased sensitivity into the attomole range, a 1000-fold improvement compared to direct detection in a matrix. A strong positive correlation was observed with qPCR detection beyond a quantification cycle of 30-31, the level where no live virus can be cultured. The automatable sample preparation and reduced LC dependency allow analysis of up to 500 samples per day per instrument. Importantly, peptide enrichment allows detection of the N protein in pooled samples without sensitivity loss. Easily multiplexed, we detect variants and propose targets for Influenza A and B detection. Thus, the Cov2MS assay can be adapted to test for many different pathogens in pooled samples, providing longitudinal epidemiological monitoring of large numbers of pathogens within a population as an early warning system.


Conflict of interest statement

The authors declare the following competing financial interest(s): Van Oudenhove L., Claereboudt J., Wardle R., Foley D., Wyndham K, and Vissers J.P.C. are employed by Waters Corporation. Razavi M., Yip Y., Pearson TW. and Anderson N.L. are employed by SISCAPA Assay Technologies Inc.

Figures

Figure 1
Figure 1
Validation of the peptide enrichment protocol using SISCAPA technology. (A) Schematic representation of the SISCAPA workflow. (B) Comparison of different gradient lengths and their linearity for detecting the AYN peptide. (C) Linearity of response of the dilution series in different matrices. The amount that is loaded on the column (oc) is indicated at the top. This is the amount of peptide following enrichment (calculation described in Supplementary Methods).
Figure 2
Figure 2
Comparison between RT-qPCR and SISCAPA-LC–MS performed on 233 patient samples in three different transport media. (A) A patient sample batch in different media displays a high percent positive (PPA = TP/(TP + FN)) and negative agreement (PNA = TN/(TN + FP)) between RT-qPCR (Ct) and MS (LogInt), especially below Ct 30 (gray numbers). (B) Secondary axis plots of the raw measurements of E-gene Ct (red dots) and AYN logarithmically transformed MS intensities (LogInt) (green bars) for patients sorted from high to low Ct (left) and low to high LogInt (right). A strong linear correlation illustrates the level of agreement between both tests. The patient samples were only prepared once since we only had access to the residual volume (<300 μL) after clinical RT-qPCR analysis. (C) ROC with true positives defined by either RT-qPCR (left) or MS (right). AUC: area under the curve. (D) ROC AUCs for each Ct value separately. Up to Ct 26, there is perfect agreement (AUC = 1). Above Ct 30, a noticeable drop-off to an AUC of 0.95 can be seen, suggesting that from here on, both diagnostic tests start to disagree. Error bars indicate the 95% confidence interval (CI).
Figure 3
Figure 3
Variant screening. (A) When a patient sample with a missing signal for the ADET peptide was acquired in discovery DDA, a fragment spectrum was found that could be annotated as TDETQALPQR (A376T). (B) The same sample was then reacquired in MRM, this time targeting the mutated peptide by precursor mass and by two b-ions that contain the mutation; a clear signal could be picked up. Adding these to the assay now allows detection of the mutation in all patients in the batch. (C) By checking the GISAID database, the frequency of this mutation in Belgium showed that this variant was circulating around the time the samples were taken. Not long after, the Delta variant, which contains the (D377Y) mutation, completely replaced the other variants. The figure is composed of two consecutive screenshots. (D) Therefore, a similar approach was applied to specifically identify a biomarker peptide for the Delta VoC and the resulting high resolution MSMS spectrum is shown. (E) This D377Y mutation was still immuno-enriched by the SISCAPA antibody reagent (somewhat less efficiently), and again the target can easily be added to the MRM, albeit at a slightly shifted retention time.
Figure 4
Figure 4
SISCAPA peptide immuno-affinity enrichment is insensitive to patient pooling. (A) 10 μL out of 50 μL of the peptide digest of positive patient samples with different Ct values were diluted with q-PCR-confirmed negative patient samples in five different ratios (1/2, 1/4, 1/8, 1/16, and 1/32), with each dilution corresponding to a loss of one Ct value (n = 1). However, by using SISCAPA peptide immuno-affinity enrichment, LC–MS is insensitive to the dilution effect; hence, a similar signal intensity is achieved for each dilution. (B) One positive (red) patient with Ct 26 (boxed in (A)) was manually inspected. The initial measurement of 50 μL sample resulted in a signal for AYN of 7000. (C) When another 50 μL of digest from this patient was spilt into five and diluted 1/2, 1/4, 1/8, 1/16, and 1/32 with a digest of mixture of negative patients, the signal did not decline accordingly, effectively showing how the SISCAPA workflow is insensitive to pooling.

References

    1. Bruce E. A.; Mills M. G.; Sampoleo R.; Perchetti G. A.; Huang M.; Despres H. W.; Schmidt M. M.; Roychoudhury P.; Shirley D. J.; Jerome K. R.; Greninger A. L.; Botten J. W. Predicting Infectivity: Comparing Four PCR-based Assays to Detect Culturable SARS-CoV-2 in Clinical Samples. EMBO Mol. Med. 2022, 14, e1529010.15252/EMMM.202115290. - DOI - PMC - PubMed
    1. Van Puyvelde B.; et al. Cov-MS: A Community-Based Template Assay for Mass-Spectrometry-Based Protein Detection in SARS-CoV-2 Patients. JACS Au 2021, 1, 750–765. 10.1021/jacsau.1c00048. - DOI - PMC - PubMed
    1. Bezstarosti K.; Lamers M. M.; Doff W. A. S.; Wever P. C.; Thai K. T. D.; van Kampen J. J. A.; Haagmans B. L.; Demmers J. A. A. Targeted Proteomics as a Tool to Detect SARS-CoV-2 Proteins in Clinical Specimens. PLoS One 2021, 16, e025916510.1371/journal.pone.0259165. - DOI - PMC - PubMed
    1. Pinto G.; Illiano A.; Ferrucci V.; Quarantelli F.; Fontanarosa C.; Siciliano R.; Di Domenico C.; Izzo B.; Pucci P.; Marino G.; Zollo M.; Amoresano A. Identification of SARS-CoV-2 Proteins from Nasopharyngeal Swabs Probed by Multiple Reaction Monitoring Tandem Mass Spectrometry. ACS Omega 2021, 6, 34945–34953. 10.1021/ACSOMEGA.1C05587. - DOI - PMC - PubMed
    1. Cardozo K. H. M.; Lebkuchen A.; Okai G. G.; Schuch R. A.; Viana L. G.; Olive A. N.; dos Santos Lazari C.; Fraga A. M.; Granato C. F. H.; Pintão M. C. T.; Carvalho V. M. Establishing a Mass Spectrometry-Based System for Rapid Detection of SARS-CoV-2 in Large Clinical Sample Cohorts. Nat. Commun. 2020, 11, 6201.10.1038/s41467-020-19925-0. - DOI - PMC - PubMed

Publication types