. 2023 May 2;192(1):504-526.
doi: 10.1093/plphys/kiac563.

SEC14-GOLD protein PATELLIN2 binds IRON-REGULATED TRANSPORTER1 linking root iron uptake to vitamin E

Affiliations

SEC14-GOLD protein PATELLIN2 binds IRON-REGULATED TRANSPORTER1 linking root iron uptake to vitamin E

Jannik Hornbergs et al. Plant Physiol. .

Abstract

Organisms require micronutrients, and Arabidopsis (Arabidopsis thaliana) IRON-REGULATED TRANSPORTER1 (IRT1) is essential for iron (Fe2+) acquisition into root cells. Uptake of reactive Fe2+ exposes cells to the risk of membrane lipid peroxidation. Surprisingly little is known about how this is avoided. IRT1 activity is controlled by an intracellular variable region (IRT1vr) that acts as a regulatory protein interaction platform. Here, we describe that IRT1vr interacted with peripheral plasma membrane SEC14-Golgi dynamics (SEC14-GOLD) protein PATELLIN2 (PATL2). SEC14 proteins bind lipophilic substrates and transport or present them at the membrane. To date, no direct roles have been attributed to SEC14 proteins in Fe import. PATL2 affected root Fe acquisition responses, interacted with ROS response proteins in roots, and alleviated root lipid peroxidation. PATL2 had high affinity in vitro for the major lipophilic antioxidant vitamin E compound α-tocopherol. Molecular dynamics simulations provided insight into energetic constraints and the orientation and stability of the PATL2-ligand interaction in atomic detail. Hence, this work highlights a compelling mechanism connecting vitamin E with root metal ion transport at the plasma membrane with the participation of an IRT1-interacting and α-tocopherol-binding SEC14 protein.


Conflict of interest statement

Conflict of interest statement. None declared.

Figures
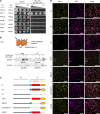
Figure 1
Figure 1
The N-terminal region of PATELLIN2 (PATL2) interacted with the variable region and large cytoplasmic loop of IRON-REGULATED TRANSPORTER1 (IRT1). A, Targeted yeast-two-hybrid assay validating the interaction of PATL2 with the large intracellular loop, also known as “variable region” of IRT1, IRT1vr. Above, photos of yeast colony growth; yeast cells spotted in dilutions as indicated from 10−1 to 10−4; right, selection medium (SD-LW), growth indicates protein–protein interaction; left, non-selection medium (SD-LWH), growth serves as positive control. AD, activation domain; BD, binding domain; SD, synthetic dropout medium; L, leucine; W, tryptophane; H, histidine. Below, scheme of the IRT1 structure, in red IRT1vr. B, Plant cell co-immunoprecipitation (IP) analysis, demonstrating IP of triple hemagglutinin (HA3)-tagged PATL2-HA3 along with IRT1-GFP from plant protein extracts (anti-GFP beads). Protein immunoblot detection before (input) and after IP, in the presence (+) or absence (−) of proteins as indicated; arrowheads, sizes of detected proteins. IRT1-GFP had previously been localized at the plasma membrane and used for Co-IP studies to pull down IRT1-interacting HA3-ENHANCED BENDING1 (EHB1), but not a non-interacting plasma membrane-associated mutant version of EHB1 (Khan et al., 2019). Functional complementation data are not available for the IRT1-GFP construct. The PATL2-HA3 construct functionally complemented a patl2 mutant, as described in a later section of this work. See also images in Supplemental Materials and Methods. C, Schematic representation of PATL2 full-length (FL) and various mutants with deletions (Δ, indicated by dashed lines) of the N- and C-terminal parts (N, C), the CRAL-TRIO-N-terminal extension (CTN), the SEC14, CTN-SEC14, and Golgi dynamics (GOLD) domains, used in (D) and generated according to Montag et al. (2020). D, Plant cell BiFC of split Yellow fluorescent protein (YFP) between PATL2 full-length (FL) and its deletion variants depicted in (C) fused N-terminally with nYFP and IRT1vr fused N-terminally with cYFP. Note that localization of reconstituted YFP corresponds to previously determined localization of YFP-PATL2 and respective deletion mutants in plant cells (Montag et al., 2020). YFP signal, indicating protein–protein interaction; Red fluorescent protein (RFP) signal, positive plant cell transformation control; merge, overlay of YFP and RFP signals. B, D, Plant cells are transiently transformed N. benthamiana leaf epidermis cells. Size bars: 50 µm.
Figure 2
Figure 2
Enhanced Fe reductase activity was the most drastic and consistent phenotype of patellin2 (patl2) loss of function mutants. Physiological and molecular analysis of patl2 mutant plants (additional allele description in Supplemental Figure 3, A–G). A, Root Fe reductase activity. Plants were grown in the 14 + 3 system. n = 3 (B) IRON-REGULATED TRANSPORTER1 (IRT1) and ferritin (FER) immunoblot analysis with anti-IRT1, anti-FER and anti-ACTIN, as indicated. Top, actin-normalized band signal intensities; bottom, immunoblot bands after chemiluminescent signal detection. See also images in Supplemental Materials and Methods. Plants were grown in the 14 + 3 system. C, Root length measurements. Plants were grown in the 10-day system. n = 83. D, Leaf SPAD values. Plants were grown in the 14 + 3 system. n = 18. E, Fe contents per seed dry weight, harvested from soil-grown plants. n = 3. F, J, Root gene expression of Fe response markers. Plants were grown in the 14 + 3 system. n = 3. F–I, Fe deficiency markers (F) FERRIC REDUCTASE OXIDASE2 (FRO2), (G) IRT1, (H) FER-LIKE FE DEFICIENCY-INDUCED TRANSCRIPTION FACTOR (FIT), (I) BASIC HELIX-LOOP-HELIX039 (BHLH039), and (J) Fe sufficiency marker FERRITIN1 (FER1). A–J, Wild type (WT), patl2-1 and patl2-2 plants were grown as indicated and exposed to Fe sufficiency (50 µM Fe) and Fe deficiency (0 µM Fe). Data in (A, C–J) are represented as mean ± standard deviations. Different letters indicate statistically significant differences (P < 0.05, determined by ANOVA with post hoc Fisher's LSD test).
Figure 3
Figure 3
The PATELLIN2 (PATL2) interactome comprised more proteins at 0 µM Fe than 50 µM Fe and was enriched in membrane and oxidative stress-related protein functions. A, Overview of triple hemagglutinin (HA3)-tagged PATL2-HA3 interactome analysis. In total, 20 samples consisting of 5 biological replicates of PATL2-HA3 (pro35S::PATL2-HA3 plants) and wild type (WT) roots, each collected in the 14 + 3 d system under 50 µM Fe (+Fe) and 0 µM Fe (−Fe) were used for immunoprecipitation-mass spectrometry (IP-MS) analysis, followed by statistical analysis and GO term enrichment. The full workflow and additional information are detailed in Supplemental Figure 7. The construct pro35S::PATL2-HA3 complemented patl2-2 ferric reductase phenotype (Supplemental Figure 7A). B, Venn diagram illustrating the number of identified proteins specific for the PATL2-HA3 interactome at + Fe and –Fe. Full protein lists are provided in Supplemental Table 1. C, D, Two selected functional categories identified after GO term enrichment under 0 and 50 µM Fe in the PATL2-HA3 interactome versus WT. Additional information in Supplemental Tables 2 and 3.
Figure 4
Figure 4
Root lipid peroxidation, Fe reductase activity, and tocopherol contents in patellin2 (patl2) and vitamin e2 (vte2) mutants indicate a connection between Fe acquisition, oxidative stress, and vitamin E. A, Root H2O2 concentration of wild type (WT), patl2-1, and patl2-2 plants. B, C, Root TBARS content, indicating root lipid peroxidation levels in (B) wild type (WT), patl2-1, and patl2-2 plants, and in (C) wild type (WT), patl2-2, and pro35S::PATL2-HA3 (PATL2-HA3)/patl2-2 plants; triple hemagglutinin tag, HA3. Enhanced root TBARS contents and lipid peroxidation were found in patl2 mutant plants versus WT. D, Schematic representation of tocopherol (Toc) biosynthesis and functions of tocopherol biosynthetic enzymes VTE1 to VTE4 with VTE2 catalyzing the key step. DMPBQ, 2,3-dimethyl-6-phytyl-1,4-benzoquinol; HGA, homogentisate; MEP, methyl erythritol phosphate; MPBQ, 2-methyl-6-phytyl-1,4-benzoquinol; PPP, phytyl pyrophosphate; VTE 1, tocopherol cyclase; VTE2, homogentisate phytyltransferase; VTE3, VITAMIN E DEFECTIVE 3, methyl transferase; VTE4, γ-tocopherol methyltransferase. E, F, α-tocopherol (α-Toc) contents in (E) shoots, (F) roots of WT, patl2-1 and vte2-2 plants. G, Root TBARS content of WT and vte2-2 plants, 50 µM Fe. H, Root Fe reductase activity of WT and vte2-2 plants. vte2-2 mutant plants had lower root Fe reductase activity and enhanced root lipid peroxidation levels. A–C, E–H, Plants were grown in the 14 + 3-d system. FW, fresh weight. A–C, E–H, data are represented as mean ± standard deviation. Different letters indicate statistically significant differences (P <0.05, determined by ANOVA with post hoc Fisher's LSD test). A–C, n = 5; (E–H) n = 3. Samples marked by * excluded from statistical analysis.
Figure 5
Figure 5
Biochemical in vitro and computational evidence for PATELLIN2 (PATL2) binding α-tocopherol inside the LBS of the SEC14 domain. A, Formula of α-tocopherol (upper structure) and nitrobenzoxadiazole (NBD)-α-tocopherol (lower structure). B, PATL2 protein-α-tocopherol ligand binding assay, using spectrofluorimetric measurements with Strep-tagged PATL2 (PATL2), PATL2 devoid of the Golgi dynamics domain (ΔGOLD), PATL2 devoid of the CRAL-TRIO-N-terminal extension, and SEC14 domain (ΔCTN-SEC14) with NBD-α-tocopherol (NBD-Toc). PATL2 with NBD-glycine (NBD-Gly) served as negative control. The assays were conducted using 50 nM protein and varying ligand concentrations as indicated. The fraction bound (Fbound) corresponds to the relative fluorescence measured after 24 h of incubation (with maximum PATL2-α-Toc fluorescence set to 1). The dissociation constant (KD) was calculated for the PATL2 and ΔGOLD protein-ligand interaction with α-tocopherol at half Fbound. Data are represented as mean ± Sd (n = 3), and best fitting of curves. Details on the establishment of the assay in Supplemental Figure 10. C–F, MD simulations of the PATL2-α-tocopherol. The full simulation workflow is shown in Supplemental Figure 11. C, Homology model of the CTN-SEC14-GOLD structure of PATL2 with the different docking sites of the CTN-SEC14 domain (SBS1-3), the LBS inside the CTN-SEC14 domain and the GOLD-binding sites (GBS1-3) in the front view (left side) and back view (rotated by 180°, right side). The different domains of PATL2 are labeled and colored; cyan, CTN; red, SEC14; orange, GOLD; blue, anchor helix; pink, gate helix; pink oval, LBS. D–F, Summary of the ensemble docking results for CTN-SEC14-GOLD and CTN-SEC14. D, Venn diagram showing the overlap of the binding sites. E, Number of docking events for the different binding sites. F, Left, histogram of the 27× 100 ns MD simulations of PATL2-α-Toc binding. α-Tocopherol-binding modes were validated by the average root mean square deviation of the ligand (RMSDmean) and the average distance between the centers of mass (COM) of the respective binding site and α-Toc (DISTCOM) for stability during MD simulation for each protein conformation (homology model and three MD clusters, Supplemental Figures 16 and 17). Green, binding modes, fulfilling both criteria (RMSDα-Toc ≤ 5 Å, DISTCOM ≤ 8 Å); yellow, fulfilling one criterion; orange, fulfilling no criterion; red, indicating dissociation of α-tocopherol. Middle panel, representative 3D configuration of stable α-tocopherol-binding to the LBS. The protein representation is the same as in (C), while α-tocopherol is shown as green sticks and the residue Q489 as ball-and-stick model. The side chain of Q489 forms a hydrogen bond with the hydroxyl group of α-tocopherol. Right, the corresponding α-tocopherol–protein interaction diagram (created with Ligplot+); gray half-circles, residues with hydrophobic interactions; orange, residues with salt bridges or hydrogen bonds; green, connection to the ligand. Detailed results of the analysis are provided in Supplemental Figures 11–20.
Figure 6
Figure 6
PATELLIN2 (PATL2) binds α-tocopherol and interacts with IRON-REGULATED TRANSPORTER1 (IRT1) to reduce membrane oxidative damage (summary working model). Import of ferrous iron (Fe2+, represented by circled 2+) via IRT1 bears the risk of oxidative damage and lipid peroxidation. FERRIC REDUCTASE OXIDASE1 (FRO2) and IRT1 are in close proximity at the plasma membrane (PM) (Martin-Barranco et al., 2020). External ferric Fe (Fe3+, represented by circled 3+; E, external) is reduced by FRO2 to generate ferrous Fe (Fe2+; Robinson et al., 1999). IRT1 imports Fe2+ (Vert et al., 2002). Internal Fe2+ (I, internal) reacts with reactive oxygen species (ROS) and polyunsaturated fatty acids which causes lipid peroxidation stress, represented in yellow (Le et al., 2019; Juan et al., 2021). PATL2 localizes with its CRAL-TRIO-N-terminal extension and SEC14 (CTN-SEC14) domain to PIP PI(4)P and PI(4,5)P2 and via the Golgi dynamics (GOLD) domain to PI(4,5)P2 contained in the PM, represented in violet and orange (Montag et al., 2020). In this work, it is shown that PATL2 interacts via its N-terminal region (represented by gray extension) with the variable region of IRT1 (IRT1vr, represented as brown loop of IRT1). α-Tocopherol, represented in olive green, is bound by the CTN-SEC14 domain of PATL2 in vitro and protects from lipid peroxidation stress. In this proposed model, the antioxidant reduces membrane oxidative damage during Fe import via IRT1. This highlights a novel mechanism of a SEC14 protein acting during cellular divalent metal ion import by way of the evolutionarily conserved ZINC AND IRON-REGULATED TRANSPORT PROTEIN (ZIP) family.

Comment in

References

    1. Abdallah HB, Bauer P (2016) Quantitative reverse transcription-qPCR-based gene expression analysis in plants. Methods Mol Biol. 1363: 9–24. 10.1007/978-1-4939-3115-6_2 - DOI - PubMed
    1. Abraham MJ, Murtola T, Schulz R, Páll S, Smith JC, Hess B, Lindahl E (2015) GROMACS: high performance molecular simulations through multi-level parallelism from laptops to supercomputers. SoftwareX 1-2: 19–25. 10.1016/j.softx.2015.06.001 - DOI
    1. Anantharaman V, Aravind L (2002) The GOLD domain, a novel protein module involved in Golgi function and secretion. Genome Biol 3: research0023. 10.1186/gb-2002-3-5-research0023 - DOI - PMC - PubMed
    1. Arai H, Kono N (2021) α-Tocopherol transfer protein (α-TTP). Free Radic Biol Med 176: 162–175. 10.1016/j.freeradbiomed.2021.09.021 - DOI - PubMed
    1. Atkinson J, Thakur V, Manor D (2019) The tocopherol transfer protein: regulator of vitamin E status. InWeber PBM, Blumberg J, Eggersdorfer M, Frank J, eds, Vitamin E in Human Health. Springer International Publishing, Cham, pp 111–124

Publication types