. 2022 Dec 8;185(25):4717-4736.e25.
doi: 10.1016/j.cell.2022.11.004.

Fibroblast inflammatory priming determines regenerative versus fibrotic skin repair in reindeer

Affiliations

Fibroblast inflammatory priming determines regenerative versus fibrotic skin repair in reindeer

Sarthak Sinha et al. Cell. .

Abstract

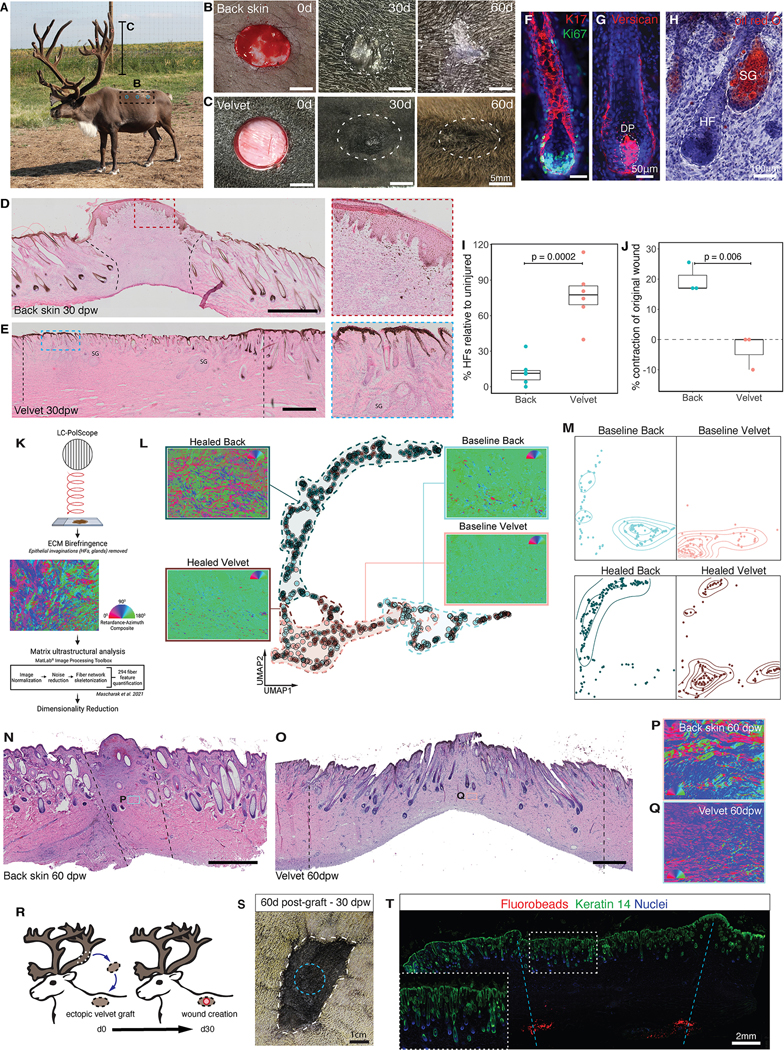
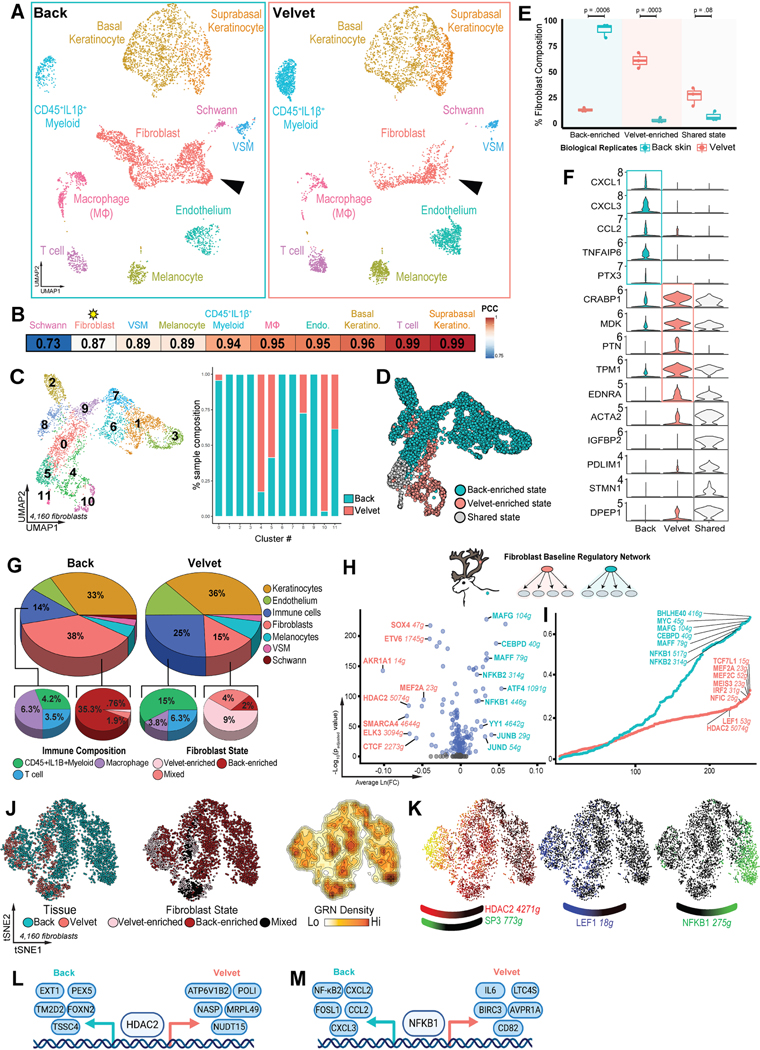
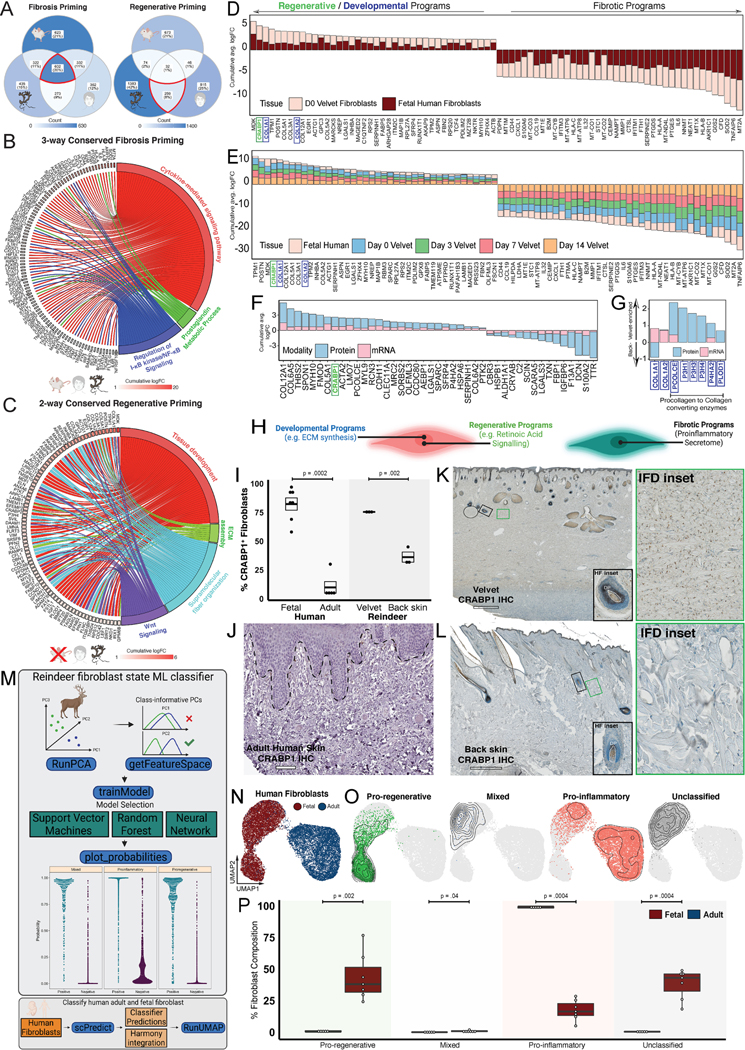
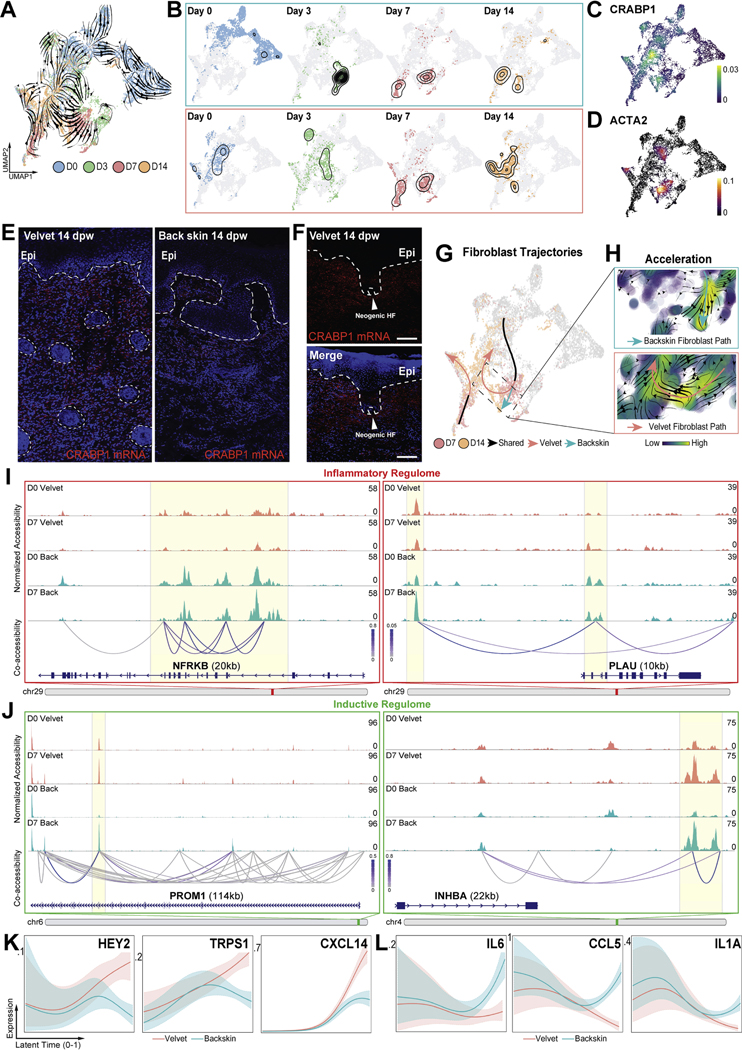
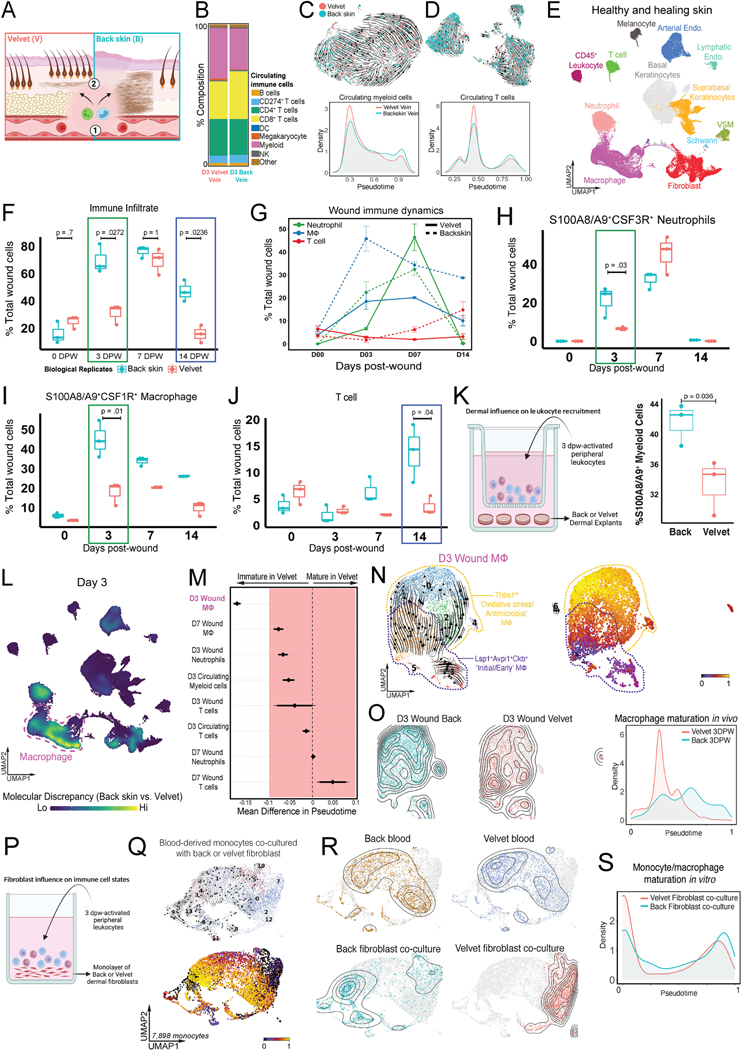
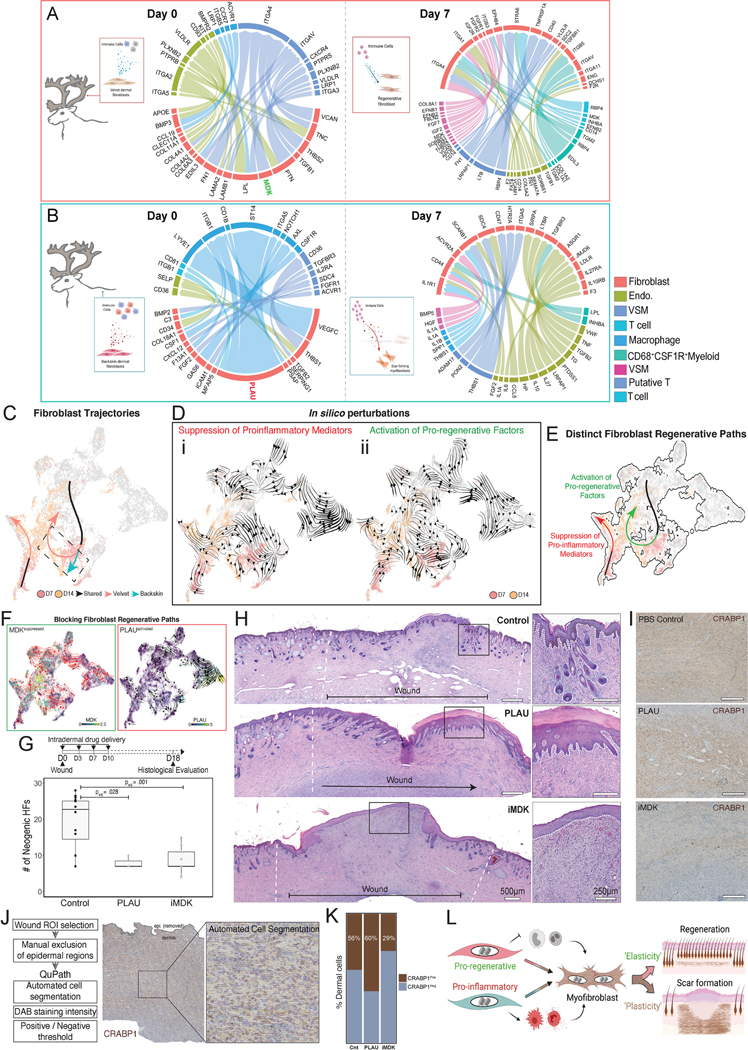
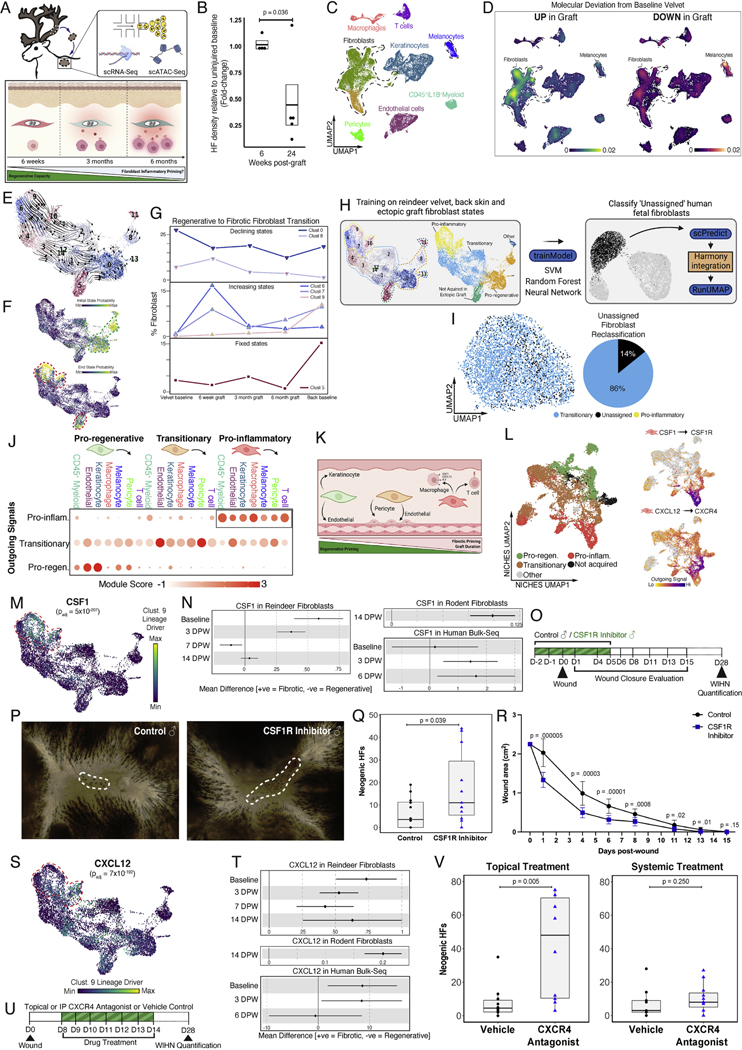
Adult mammalian skin wounds heal by forming fibrotic scars. We report that full-thickness injuries of reindeer antler skin (velvet) regenerate, whereas back skin forms fibrotic scar. Single-cell multi-omics reveal that uninjured velvet fibroblasts resemble human fetal fibroblasts, whereas back skin fibroblasts express inflammatory mediators mimicking pro-fibrotic adult human and rodent fibroblasts. Consequently, injury elicits site-specific immune responses: back skin fibroblasts amplify myeloid infiltration and maturation during repair, whereas velvet fibroblasts adopt an immunosuppressive phenotype that restricts leukocyte recruitment and hastens immune resolution. Ectopic transplantation of velvet to scar-forming back skin is initially regenerative, but progressively transitions to a fibrotic phenotype akin to the scarless fetal-to-scar-forming transition reported in humans. Skin regeneration is diminished by intensifying, or enhanced by neutralizing, these pathologic fibroblast-immune interactions. Reindeer represent a powerful comparative model for interrogating divergent wound healing outcomes, and our results nominate decoupling of fibroblast-immune interactions as a promising approach to mitigate scar.

Keywords: fetal human fibroblast; fibroblast; immune modulation; inflammation; inflammatory priming; myeloid cell maturation; reindeer; scar; skin regeneration; stromal-immune crosstalk; wound healing.


Conflict of interest statement

Declaration of interests The authors declare no competing interests.

Figures

Figure 1 -
Figure 1 -. Antler velvet regeneration following full thickness injury.
(A) Image of adult male reindeer during antlerogenesis. (B, C) Full-thickness excision wounds on back and antler at day 0-, 30- or 60-days post-wounding (dpw). (D and E) H&E-stained skin sections from 30dpw back (D) and antler (E) excision wounds. SG=secretory gland. (F-H) Neogenic HFs within velvet wounds stained for (F) Ki67 (green) and keratin-17 (red), (G) versican (red) and (H) Oil red O (red). DP=dermal papilla; SG=sebaceous gland. (I) HF density quantification within wounds relative to surrounding uninjured tissue (n=6 back, n=6 velvet). (J) Percentage of wound contraction relative to original wound size (n=3 back, n=3 velvet). Data are mean±SEM and compared with unpaired t-tests. (K) Schematic summarizing ECM structural analysis. (L-M) Combined (L) and sample-separated (M) UMAPs based on ECM ultrastructural properties of back skin and velvet at baseline and 35dpw (n=3 animal-matched back and velvet). Dashed lines (L) approximate distribution for conditions and contour lines (M) show matrix architecture density on sample-separated UMAPs. (N-O) Replicate of (D-E) for back skin (N) and velvet (O) at 60dpw. (P-Q) Light retardation and azimuthal polarization composites for back skin (P) and velvet (Q) at 60dpw. (R) Schematic of autologous velvet-to-back grafting and wounding. (S) Ectopic velvet graft (white dashed line) at 60 days post-transplant, and 30dpw (blue dashed line). (T) Healed wound (30dpw) on ectopic velvet graft stained with Keratin-14 (green). Fluorobeads (red) demarcate wound margins. Inset shows high magnification of regenerated appendages. Dashed lines represent the original wound margins (B-E). Nuclei are stained with Hoechst (blue).
Figure 2 –
Figure 2 –. Resting fibroblast states in velvet and back skin.
(A) UMAP projection of 11,158 single-cell transcriptomes comparing uninjured back skin (left) and antler velvet (right) colored by manual cell type annotation. (B) Pearson correlation coefficients comparing cell types across velvet and back skin. (C) Unsupervised assignment of fibroblast clusters by contributions of velvet and backskin fibroblasts to each cluster. (D) UMAP projection of 4,160 fibroblasts colored by states enriched in velvet and back skin. (E) Boxplot showing percentage of each fibroblast state (n=3) colored by tissue. All P-values are Bonferroni adjusted. (F) Violin plots showing signature genes unique to back skin, velvet or shared across both sites. (G) Relative proportions of immune subsets and fibroblast states in resting back skin and antler velvet. (H) Volcano plot of differentially activated regulons in uninjured velvet (red) and back skin (cyan). (I) Rank plot of baseline fibroblast regulons ordered by Regulon Specificity Score (RSS), including top regulons for velvet (red) or back skin (cyan). (J) tSNE projection of gene regulatory network-based clustering of uninjured fibroblasts colored by anatomical site, fibroblast state, and regulon density (surrogate for stable fibroblast regulatory states). (K) Signature regulons for pro-regenerative (HDAC2, SP3 and LEF1) or pro-fibrotic (NFKB1) fibroblast states. (L and M) Top downstream targets of transcription factors HDAC2 (L) and NFKB1 (M) in resting back and velvet fibroblasts.
Figure 3 –
Figure 3 –. Cross-species comparisons of repair- versus regeneration-primed skin reveals conserved and divergent fibroblast ground states.
(A) Venn diagram showing conserved and species-specific gene signatures of repair- versus regeneration-primed fibroblasts in rodent (Mus versus Acomys), reindeer (velvet versus back), and human (fetal versus adult). (B-C) Repair-primed fibroblasts signaling across rodent, reindeer, and humans (B) or shared regenerative signaling across reindeer velvet and fetal human (C). (D-E) Consensus plot depicting DEGs enriched in regenerative (velvet and fetal human) versus scar-forming (backskin and adult human) fibroblasts at baseline (D) and during healing (E). Bars represent cumulative log-fold-change colored by velvet and fetal fibroblast contributions. (F-G) Global (F) and matrisome-specific (G) features distinguishing resting velvet and back skin fibroblasts identified in both mRNA and protein enrichments. (H) Schematic highlighting developmental and regenerative programs enriched in velvet fibroblasts and inflammatory signaling in pro-fibrotic back skin fibroblasts. (I) Boxplot showing enrichment of CRABP1+ fibroblasts in regeneration-primed reindeer and human skin. n=7, n=5, n=3, and n=3 biological replicates of human fetal, human adult, reindeer velvet and reindeer back, respectively. Bonferroni-adjusted P-values are shown. (J-L) Immunohistochemistry for CRABP1 (brown) across adult human (J), reindeer velvet (K) and back skin (L). Insets show HF and interfollicular dermal fibroblasts. (M) Schematic of scPred-based machine learning classifier trained to distinguish velvet-enriched ‘Pro-regenerative’, back skin-enriched ‘Pro-inflammatory’, and shared ‘Mixed’ fibroblast states, subsequently applied to fetal and adult human skin fibroblasts. (N and O) Harmony-integrated human fibroblasts, colored by tissue of origin (N) and scPred-inferred fibroblast states (O). (P) Boxplot showing percentage of scPred-inferred fibroblast states in adult and fetal human skin. Bonferroni-adjusted P-values are shown. Human IHC staining obtained from the Human Protein Atlas. Scale bars are 100 μm (J), and 500μm (K-L).
Figure 4 –
Figure 4 –. Inaccessible inflammatory regulome and re-engagement of morphogenic programs in fibroblasts enables regeneration.
(A) RNA velocities calculated from the dynamical model. (B) Temporal progression of velvet and back skin fibroblasts along velocity-inferred topologies. (C, D) Density plots showing expression of CRABP1, (C) and ACTA2 (D). (E, F) In situ hybridization (RNAscope®) for CRABP1 mRNA (red) within velvet and back skin neodermis (E) and in dermal fibroblasts surrounding neogenic HFs in velvet (F) at 14dpw. (G) scVelo-inferred connectivity between 7 and 14dpw showing reversion to ground state in velvet wounds. (H) Acceleration vector fields driving divergent terminal fates in velvet versus back skin. (I, J) Normalized fibroblast pseudobulk chromatin accessibility tracks with cis-regulatory DNA interactions identifying differential accessibility of inflammatory (I) and regeneration-associated (J) loci at baseline and 7dpw. (K, L) Smoothed expression trends in latent time for genes predicted to drive divergent terminal fibroblast fates in velvet (K) and back skin (L).
Figure 5 –
Figure 5 –. Back skin wound signals promote rapid myeloid cell infiltration and maturation to drive fibrotic repair.
(A) Immune cell composition in site-specific circulation (1) or within back and velvet wounds (2). (B) Relative composition of circulating immune cells in saphenous (back skin) versus distal antler velvet vein at 3dpw. (C, D) UMAP projections plotting velocyto vector fields and pseudotime distributions of circulating myeloid cells (C) and T lymphocytes (D) across velvet-specific and systemic venous blood. (E) UMAP projection of all cells in uninjured and healing skin wounds from back and velvet. (F) Boxplot showing percentage of total immune cells in n=3 biological replicates grouped by dpw and colored by wound site. Bonferroni adjusted p-values shown. (G) Temporal distribution of immune cell types within velvet versus back skin wounds at 0, 3, 7, and 14dpw. Error bars represent±SEM (n=3). (H-J) Boxplots (as in F) showing percentage of neutrophils (H), macrophages (I) and T lymphocytes (J). (K). Quantification of leukocyte migration when co-cultured with back skin or velvet dermal explants. n=3 biological replicates. (L) Nebulosa plot depicting cell types exhibiting greatest transcriptional divergence between back and velvet wounds at 3dpw. M. Forrest plot showing quantified pseudotime analysis of immune cell maturation states. N-O. UMAP projections plotting velocyto vector fields and pseudotime distributions of macrophages at 3dpw (N) and distribution of macrophage maturation states between wound sites (O). (P) Schematic showing circulating leukocyte-dermal fibroblast co-culture assay. (Q) UMAP showing velocyto vector fields and pseudotime distributions of monocytes following exposure to back or velvet fibroblasts. (R) UMAP showing transcriptional overlap in monocytes derived from back versus velvet blood, but a marked divergence following exposure to site-specific fibroblasts. S. Pseudotime analysis showing distribution of monocyte maturation. n=3 biological replicates.
Figure 6 –
Figure 6 –. Pro-inflammatory fibroblast signaling attenuates regenerative potential and promotes scar-formation.
(A, B) Circos plots showing differential fibroblast and immune cell secretome-driven interactions in unwounded (Day 0) and 7dpw in velvet (A) and back skin (B). (C) Schematic summarizing velvet and back skin fibroblast fate trajectories (shown in Figure 4A–H). (D) Fibroblast fate diversions in response to in silico suppression of (i) proinflammatory mediators (CSF1, PLAU, CXCL12) and (ii) hyperactivation of pro-regenerative factors (CRABP1, MDK, TPM1). (E) Replicate of (C) showing fibroblast reversion back to baseline along distinct paths regulated either by suppression of pro-inflammatory (red) or hyperactivation of pro-regenerative (green) factors. (F) Predicted outcomes of pro-regenerative MDK suppression, or hyperactivating pro-inflammatory factor PLAU on fibroblast velocity vector fields. (G) Quantification of neogenic HFs within the wound bed at 18dpw following intradermal vehicle, PLAU or iMDK application. (H) H&E-stained wound sections from vehicle-, PLAU-, and iMDK-treated (I) wounds examined 18dpw. Scale bars represent 500μm (tile scan) and 250μm (inset). Wound histology is representative of n=16 control (n=3 PBS, n=4 IgG, n=6 empty, n=3 DMSO), n=3 PLAU, and n=8 iMDK. (I-K) Representative IHC staining for CRABP1 in wound neodermis (I), image processing and QuPath-based automated analysis (J), and stacked bar plot showing percentage CRABP1+ dermal cells across treatments (K). (L) Model of fibroblast inflammatory priming as a driver of maladaptive immune cell recruitment and maturation promoting pathologic wound repair.
Figure 7 –
Figure 7 –. CSF1- and CXCL12-driven fibroblast-immune interactions prime fibrotic repair.
(A) Schematic depicting the hypothesis that fibroblasts in ectopic velvet grafts progressively acquire an inflammatory phenotype that correlates with declining regenerative potential. (B) Boxplot showing HF density relative to uninjured baseline following wounds at 6 (n=4 technical replicates) or 24 weeks (n=5 technical replicates) post-graft. (C) UMAP of 28,164 cells from back skin, baseline velvet, or at 6, 18, or 24 weeks post-grafting. (D) Kernel density estimates depicting magnitude of molecular deviation in ectopic grafts relative to baseline velvet, calculated by summing DEG FCs for all cell types. (E) RNA velocity analysis of 11,100 subclustered fibroblasts undergoing state transitions, colored by Louvain cluster. (F) CellRank-calculated initial and terminal state probabilities. (G) Relative contribution of fibroblast clusters at different graft timepoints, anchored by baseline velvet and back skin and grouped as ‘declining’, ‘increasing’, or ‘fixed’ compared to baseline velvet. (H, I) scPred-based ML classifier (from Figure 3M) used to reclassify previously ‘Unassigned’ fetal human fibroblasts. (J-K) Dot plot depicting fibroblast state-specific outgoing signal intensity as module scores (J) and a schematic summarizing the evolution in fibroblasts’ interactions during regenerative-to-inflammatory transition (K). (L) NICHES ‘cell-to-system’ signaling UMAP generated using fibroblasts as principal sender, colored by scVelo-based annotations (Figure S7F). CSF1-CSF1R and CXCL12-CXCR4 axes are signatures of inflammatory fibroblasts. (M) CellRank-identified regenerative-to-inflammatory transition driver CSF1. (N) Cross-species meta-analysis of CSF1 querying regenerative oral mucosa versus fibrotic skin healing in humans, fibroblasts in regenerative versus fibrotic domains during WIHN, and velvet versus back skin fibroblasts in reindeer (this study). Enrichment reaches statistical significance if confidence intervals do not cross the vertical line of no effect. (O-R) Pharmacologic inhibition of CSF1 (O) enhances WIHN (P, Q) and accelerates wound closure (R) (n=12 control, n=11 CSF1R inhibitor). (S-T) Replicate of (M-N) for CXCL12. (U-V) Topical (n=10 control, n=10 topical CXCR4 inhibitor) but not systemic (n=9 control, n=11 systemic CXCR4 inhibitor) inhibition of CXCL12 receptor CXCR4 enhances WIHN. Data are mean±SEM. *p<0.05; **p<0.01; ***p<0.001.

Comment in

References

    1. Gurtner GC, Werner S, Barrandon Y, and Longaker MT (2008). Wound repair and regeneration. Nature 453, 314–321. 10.1038/nature07039. - DOI - PubMed
    1. Larson BJ, Longaker MT, and Lorenz HP (2010). Scarless fetal wound healing: a basic science review. Plastic and reconstructive surgery 126, 1172. - PMC - PubMed
    1. Moore AL, Marshall CD, Barnes LA, Murphy MP, Ransom RC, and Longaker MT (2018). Scarless wound healing: Transitioning from fetal research to regenerative healing. Wiley Interdiscip Rev Dev Biol 7. 10.1002/wdev.309. - DOI - PMC - PubMed
    1. Lo DD, Zimmermann AS, Nauta A, Longaker MT, and Lorenz HP (2012). Scarless fetal skin wound healing update. Birth Defects Res C Embryo Today 96, 237–247. 10.1002/bdrc.21018. - DOI - PubMed
    1. Rowlatt U (1979). Intrauterine wound healing in a 20 week human fetus. Virchows Arch A Pathol Anat Histol 381, 353–361. 10.1007/bf00432477. - DOI - PubMed