. 2022 Dec 9;13(1):7630.
doi: 10.1038/s41467-022-34910-5.

SARS-CoV-2 Spike triggers barrier dysfunction and vascular leak via integrins and TGF-β signaling

Affiliations

SARS-CoV-2 Spike triggers barrier dysfunction and vascular leak via integrins and TGF-β signaling

Scott B Biering et al. Nat Commun. .

Abstract

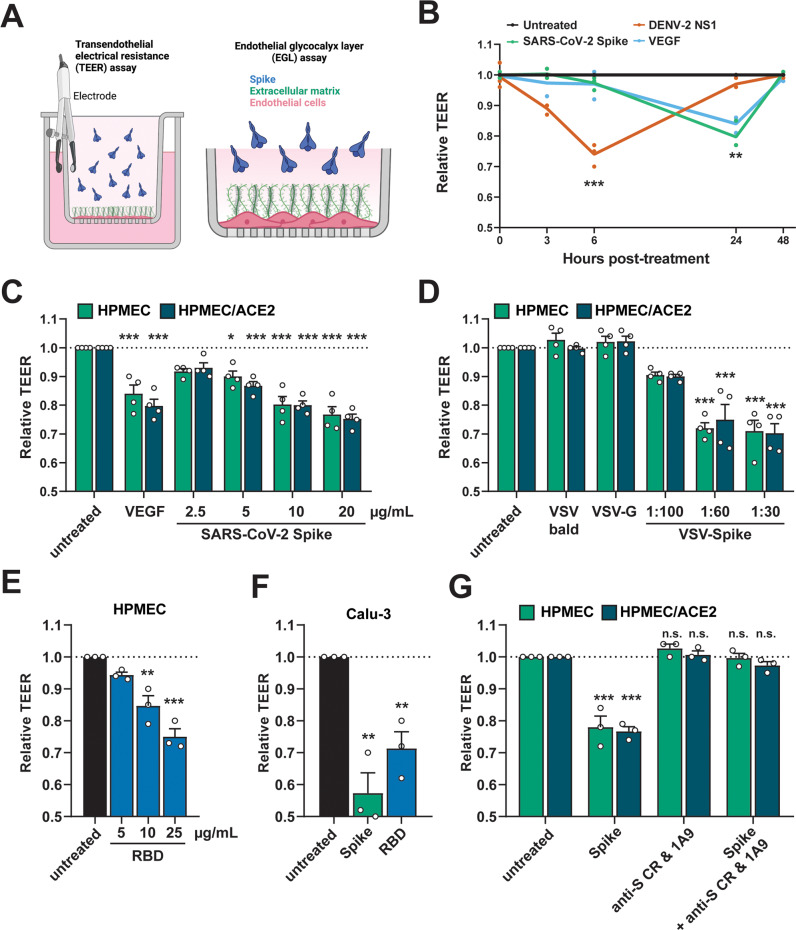
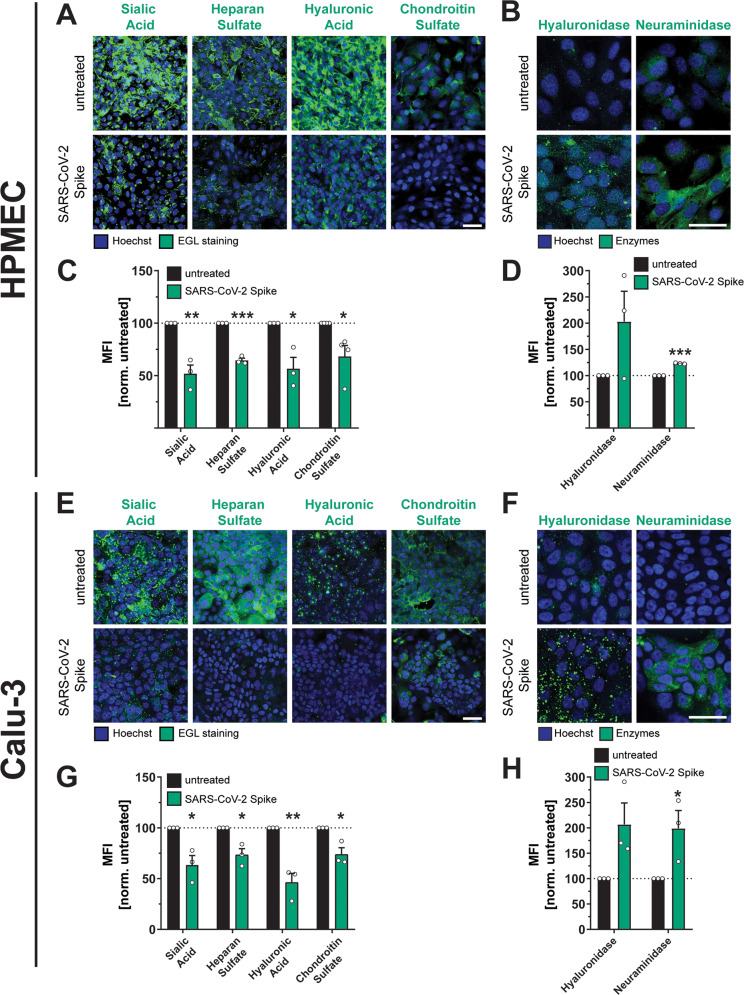
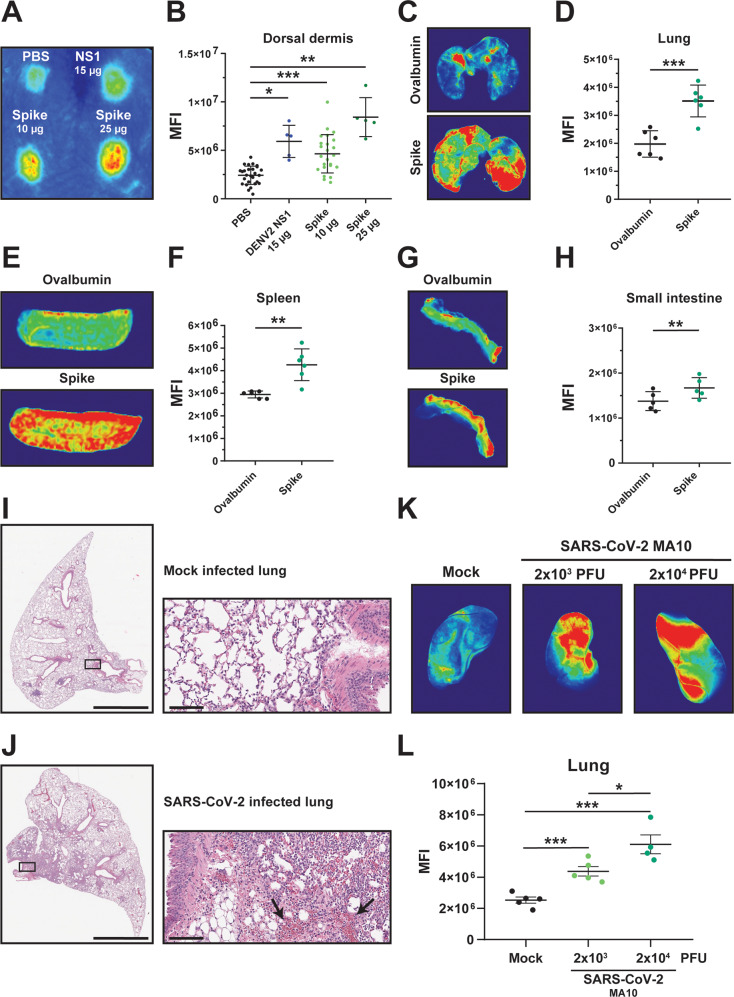
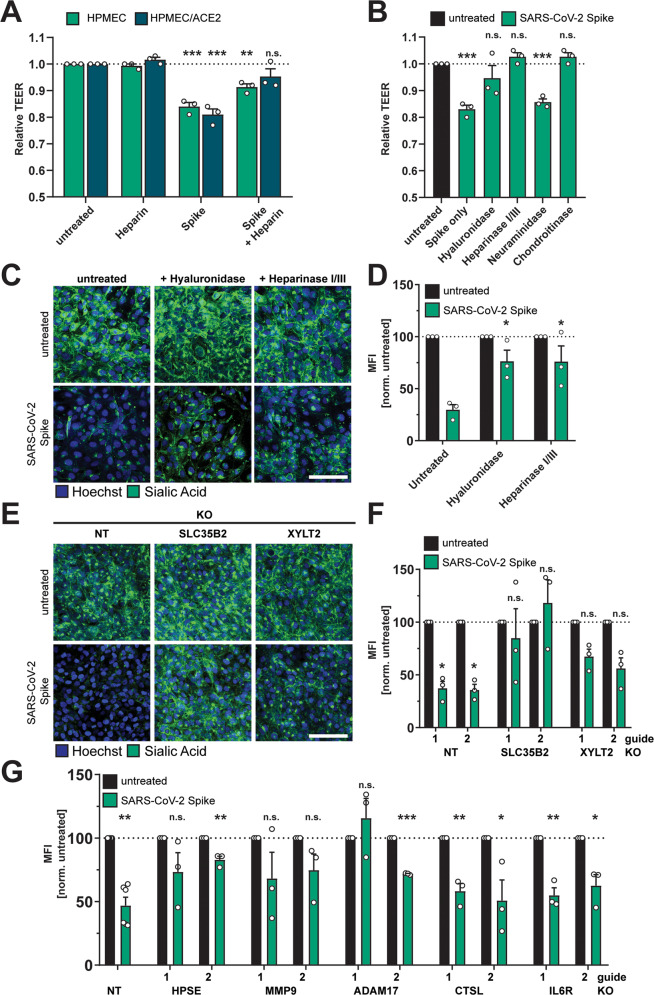
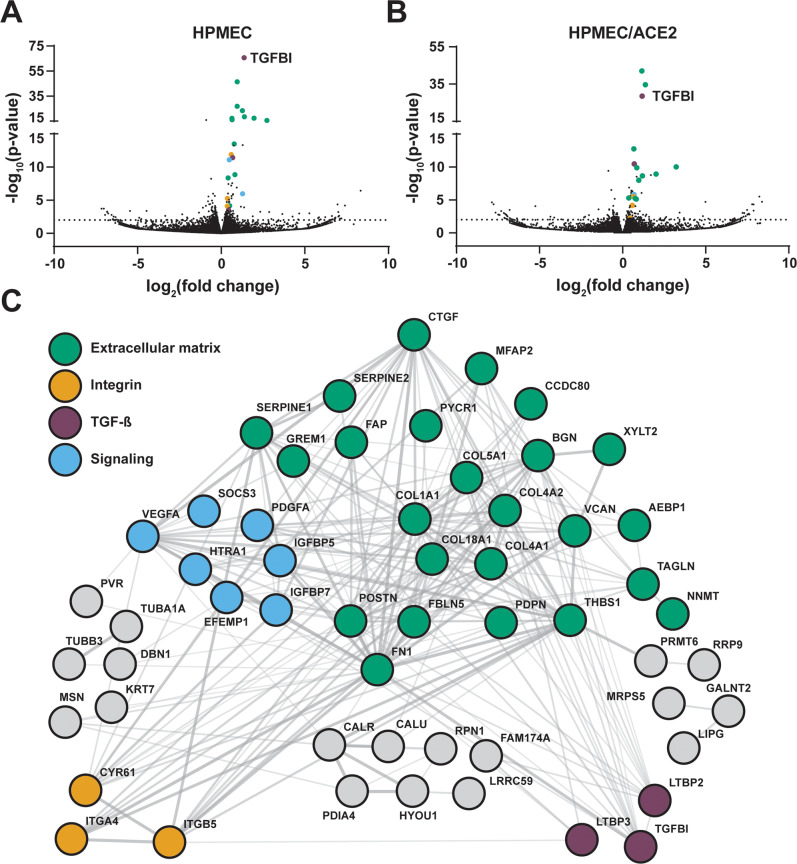
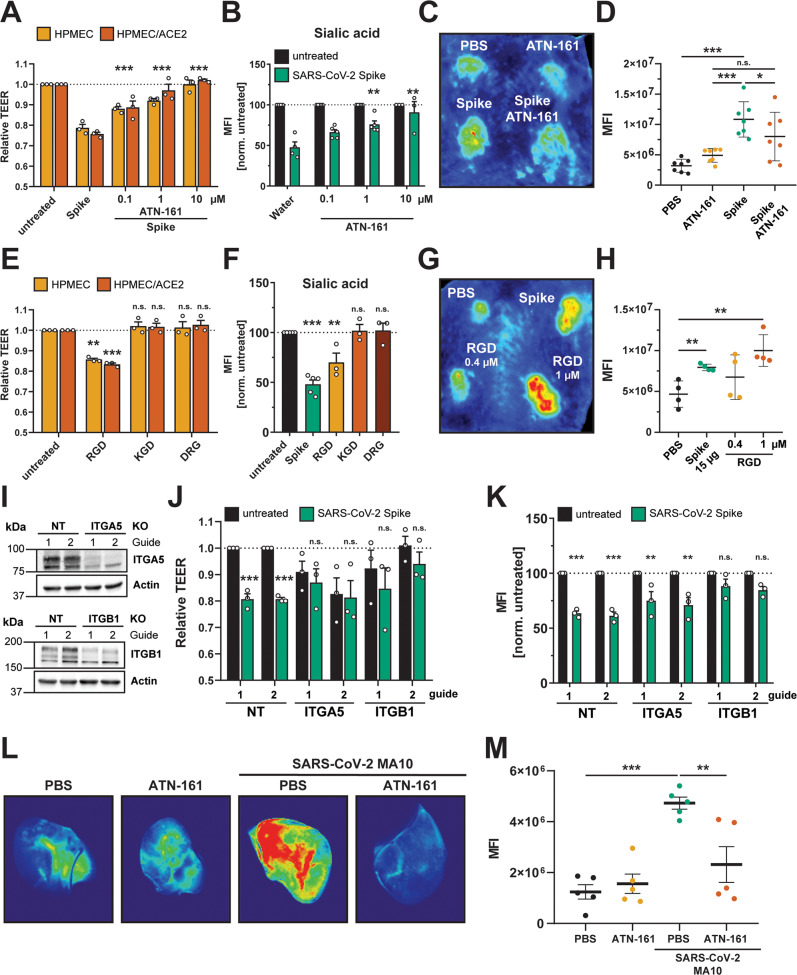
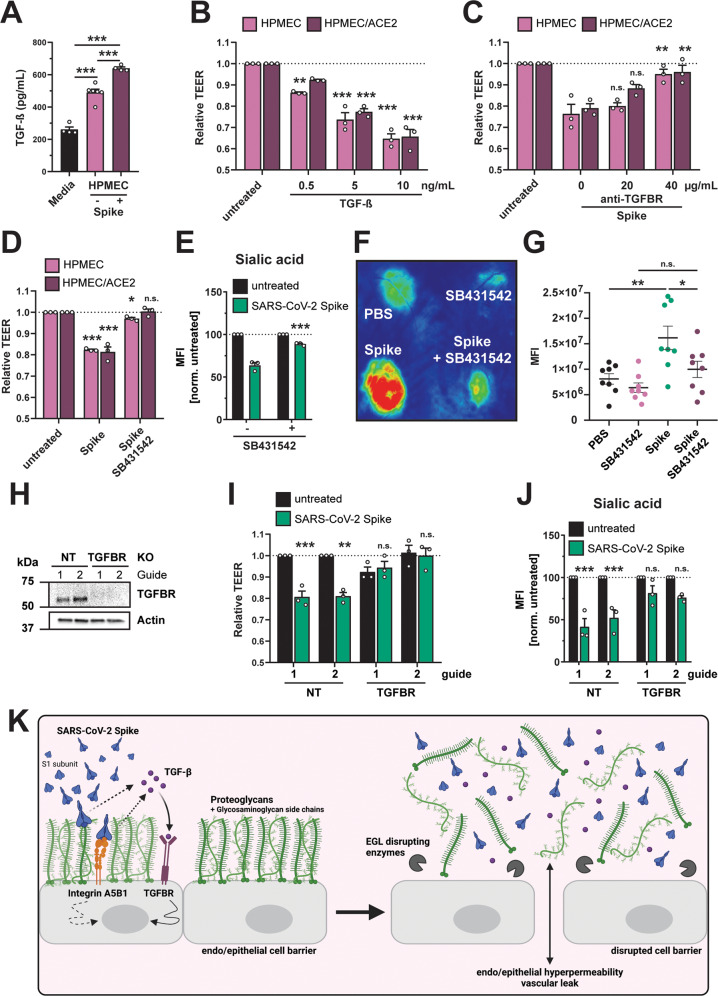
Severe COVID-19 is associated with epithelial and endothelial barrier dysfunction within the lung as well as in distal organs. While it is appreciated that an exaggerated inflammatory response is associated with barrier dysfunction, the triggers of vascular leak are unclear. Here, we report that cell-intrinsic interactions between the Spike (S) glycoprotein of SARS-CoV-2 and epithelial/endothelial cells are sufficient to induce barrier dysfunction in vitro and vascular leak in vivo, independently of viral replication and the ACE2 receptor. We identify an S-triggered transcriptional response associated with extracellular matrix reorganization and TGF-β signaling. Using genetic knockouts and specific inhibitors, we demonstrate that glycosaminoglycans, integrins, and the TGF-β signaling axis are required for S-mediated barrier dysfunction. Notably, we show that SARS-CoV-2 infection caused leak in vivo, which was reduced by inhibiting integrins. Our findings offer mechanistic insight into SARS-CoV-2-triggered vascular leak, providing a starting point for development of therapies targeting COVID-19.


Conflict of interest statement

The authors declare no competing interests.

Figures

Fig. 1
Fig. 1. SARS-CoV-2 S triggers endothelial and epithelial barrier hyperpermeability.
A Schematic depicting S-triggered barrier dysfunction measured by a trans-endothelial/epithelial electrical resistance assay (TEER; left) and an endo/epithelial glycocalyx layer (EGL) assay (right). B Time course of TEER assay measuring the barrier function of HPMEC monolayers over time with the indicated treatments, including DENV2 NS1 (5 µg/mL), VEGF (50 ng/mL), and SARS-CoV-2 S (10 µg/mL). Data are from n = 3 biological replicates. C A TEER assay measuring the barrier of monolayers of HPMEC and HPMEC/ACE2 at 24 hours after the indicated treatments. VEGF positive control (50 ng/mL). Data are from n = 4 biological replicates. D Same as C but treated with the indicated VSV-pseudotyped particles at the indicated dilutions. VSV-bald and VSV-G are diluted 1:30. Data are from n = 4 biological replicates. E Same as C but treated with the indicated concentrations of SARS-CoV-2 RBD. Data are from n = 3 biological replicates. F Same as C but measuring the barrier of Calu-3 cell monolayers. Data are from n = 3 biological replicates. G A TEER inhibition assay measuring the capacity of a cocktail of anti-S antibodies to inhibit S-mediated endothelial hyperpermeability. S (10 µg/mL) and the antibody cocktail (15 µg/mL of each antibody; 1A9 [Genetex] and CR3022 [Absolute Antibody]) were added simultaneously to the upper chamber of Transwell inserts to a monolayer of HPMEC or HPMEC/ACE2, and TEER was measured 24 hours post-treatment (hpt). Data are from n = 3 biological replicates. In all panels, the dotted line is the normalized TEER value of the untreated control condition. All data are plotted as mean + /− SEM. For all panels, values are compared to untreated controls by One-Way ANOVA with Tukey’s Multiple comparisons test except for (B), which was analyzed by two-sided unpaired t-test.  *p < 0.05, **p < 0.01, ***p < 0.001, and n.s. p > 0.05. Source data are provided as a Source Data file.
Fig. 2
Fig. 2. SARS-CoV-2 S facilitates disruption of the endothelial and epithelial glycocalyx layer.
A An immunofluorescence microscopy-based EGL disruption assay measuring levels of the indicated glycans on the surface of HPMECs. After 24 h of SARS-CoV-2 S (10 µg/mL) treatment, cells were fixed and then stained without permeabilization. Displayed are representative images from n = 3 biological replicates. B Same as A, but cells were permeabilized before staining for the indicated EGL disrupting enzymes. Displayed are representative images from n = 3 biological replicates. C Quantification of A from n = 3 biological replicates. D Quantification of B from n = 3 biological replicates. E Same as A but measuring EGL disruption of Calu-3 cell monolayers. Displayed are representative images from n = 3 biological replicates. F Same as B but measuring expression of EGL-disrupting enzymes in Calu-3 cells. Displayed are representative images from n = 3 biological replicates. G Quantification of E from n = 3 biological replicates. H Quantification of F from n = 3 biological replicates. For all images, nuclei were probed with Hoechst in blue and the indicated glycans in green with scale bars at 50 µm. Dotted lines are the normalized untreated control conditions. MFI is mean fluorescence intensity. All data are plotted as mean + /− SEM with *p < 0.05, **p < 0.01, ***p < 0.001, and n.s. p > 0.05 by two-sided unpaired t-test compared to untreated controls. Source data are provided as a Source Data file.
Fig. 3
Fig. 3. SARS-CoV-2 S and SARS-CoV-2 infection triggers vascular leak in vivo.
A A representative mouse back from a dermal leak experiment. The dorsal dermises of mice were injected intradermally with the treatments and doses indicated. Mice then received a dextran-680 tracer molecule intravenously. Mouse dermises were collected 2 h post-treatment, and quantification of local dermal leak was assessed by a fluorescent scanner. B Quantification of A from mice treated with PBS (n = 27), DENV2 NS1 (15 µg; n = 5), S (10 µg; n = 25), and S (25 µg; n = 5). C Representative lung images from a SARS-CoV-2 S systemic vascular leak assay. Mice were administered 50 µg of SARS-CoV-2 S or ovalbumin intranasally as indicated, and 22 hpt were administered a dextran-680 tracer intravenously as in A. Organs of mice were collected 2 hours post dextran-680 administration (24 hours post-S treatment), and accumulation of dextran-680 was measured with a fluorescent scanner. D Quantification of C from n = 6 mice. E Same as C except representative images of spleens are shown. F Quantification of E from n = 6 mice. G Same as C except representative images of small intestine are shown. H Quantification of G from n = 5 mice. I, J Hematoxylin and eosin (H&E) staining was performed on lung sections from K18-hACE2 mice 7 days post-infection with 100 TCID50 units of SARS-CoV-2 WA/1 isolate. Displayed are representative images of lungs from n = 3 mice in mock-infected conditions (I) and from n = 4 mice infected with SARS-CoV-2 (J); left panels with scale bars at 2 mm and right panels consisting of zoomed-in insets with scale bars at 100 µm. Arrows point to dispersed red blood cells. K Representative lung images from C57BL/6 mice infected with the indicated dose of SARS-CoV-2 mouse-adapted strain (MA-10) for 7 days. Mice were administered a dextran-680 tracer intravenously as in A. Lungs were collected 2 hours after dextran-680 administration and fixed overnight in formalin, and the fluorescence accumulation was measured with a fluorescent scanner. L Quantification of K from n = 5 mice, except for the 2 × 104 PFU condition, which was from n = 4 mice. MFI is mean fluorescence intensity. All data are plotted as mean + /− SEM with *p < 0.05, **p < 0.01, and ***p < 0.001 by two-sided unpaired t-test. Source data are provided as a Source Data file.
Fig. 4
Fig. 4. Glycosaminoglycans and EGL-modulating enzymes are required for SARS-CoV-2 S-mediated barrier dysfunction.
A TEER inhibition assay on monolayers of HPMECs or HPMEC/ACE2 treated with heparin (10 µg/mL), S (10 µg/mL), or both simultaneously. TEER readings were taken 24 hpt. Data are from n = 3 biological replicates. B A TEER inhibition assay where monolayers of HPMEC were treated with recombinant hyaluronidase (10 µg/mL), heparin lyases I and III (5 mU/mL each), neuraminidase (1 U/mL), or chondroitinase (25 mU/mL) simultaneously with S (10 µg/mL) treatment. TEER readings were taken 24 hpt. Data are from n = 3 biological replicates. C EGL inhibition assay on HPMEC treated with hyaluronidase (10 µg/mL) or heparin lyases I and III (5 mU/mL each) and simultaneously treated with S (10 µg/mL) and fixed 24 hpt. D Quantification of C from n = 3 biological replicates. Statistics are comparisons of indicated conditions to the S-only control condition. E Representative images from an EGL disruption assay of HPMEC transduced with lentiviruses encoding the indicated gene-targeting guide RNA. Cells were treated with 10 µg/mL S, and sialic acid was visualized by IFA 24 hpt. F Quantification of E from n = 3 biological replicates. Control guide data from this panel are from the same experiment as Fig. S2B. G Same as E and F but using the indicated guide RNAs. Non-target (NT) data are pooled from two cell line replicates. Control guide data from this panel are from the same experiments as Fig. 7J. For all panels, sialic acid is stained with Wheat Germ Agglutinin in green and nuclei are stained with Hoechst in blue with scale bars at 50 µm. MFI is mean fluorescence intensity. Dotted lines are the normalized untreated control conditions. All data are plotted as mean + /− SEM with *p < 0.05, **p < 0.01, ***p < 0.001, and n.s. p > 0.05 by One-Way ANOVA with Tukey’s Multiple comparisons test except for (G) which was analyzed by two-sided unpaired t-test. Statistics in panels A, B, F, and G are comparisons to untreated controls and in panel D are comparisons to the S-only control condition. Source data are provided as a Source Data file.
Fig. 5
Fig. 5. RNA-Sequencing analysis of SARS-CoV-2 S-treated HPMEC and HPMEC/ACE2.
A A volcano plot of differentially expressed genes (DEGs) detected in HPMECs treated with 10 µg/mL of SARS-CoV-2 S at 24 hpt. B Same as A but displaying DEGs from HPMEC/ACE2 treated with 10 µg/mL SARS-CoV-2 S. Dotted lines indicate the threshold for significance. Statistical significance of DEGs was determined using a Wald test and a Benjamini-Hochberg (BH) p-value adjustment. C A STRING protein-protein interaction network of DEGs identified between S-treated and untreated conditions for HPMEC.
Fig. 6
Fig. 6. Integrins are required for SARS-CoV-2 S-mediated and SARS-CoV-2 infection-mediated barrier dysfunction.
A TEER inhibition assay of HPMECs and HPMEC/ACE2 monolayers treated with S (10 µg/mL) and the indicated concentrations of the integrin inhibitor ATN-161. TEER readings were taken 24 hpt with ATN-161 and S added simultaneously to cells. Data are from n = 3 biological replicates. B EGL inhibition assay detecting sialic acid on the surface of HPMEC monolayers treated with S and ATN-161 as in A. Data are from at n = 4 (water), n = 5 (ATN-161 0.1 µM and 1 µM) and n = 3 (ATN-161 10 µM) biological replicates. C Representative back from an intradermal leak assay of mice with the indicated treatments; S (15 µg) and ATN-161 (1 µM) injected simultaneously. D Quantification of C from n = 7 mice. E TEER assay of HPMEC and HPMEC/ACE2 monolayers treated with the indicated peptides at 0.4 µM. TEER readings were taken 24 hpt. Data are from n = 3 biological replicates. F Same as E, but an EGL assay detecting sialic acid on the surface of HPMEC monolayers. Data are from n = 3 biological replicates. G Representative back from an intradermal leak assay of mice with the indicated treatments with S (15 µg) and the indicated doses of RGD peptide. H Quantification of G from n = 4 mice. I Western blot analysis of HPMEC transduced with the indicated lentivirus-encoding guide RNA. Actin was used as a loading control. Data are one representative experiment from n = 3 biological replicates. J TEER assay of HPMEC transduced with lentivirus-encoding guide RNAs targeting the indicated genes as in I. Cells were treated with 10 µg/mL of S, and TEER was read 24 hpt. Data are from n = 3 biological replicates. K EGL assay detecting sialic acid on the cell surface of transduced HPMEC as in J. Data are from n = 3 biological replicates. L Representative lung images from C57BL/6 mice infected with 2 × 104 PFU of SARS-CoV-2 mouse-adapted strain (MA-10) for 7 days. Mice were administered 10 mg/kg ATN-161, or a vehicle control, intraperitoneally daily (8 doses total). Mice were administered a dextran-680 tracer intravenously on day 7 post-infection. Lungs were collected 2 hours after dextran-680 administration and fixed overnight in formalin, and the fluorescence accumulation was measured with a fluorescent scanner. M Quantification of L from n = 5 mice. MFI is mean fluorescence intensity. Dotted lines are the normalized untreated control conditions. All data are as plotted as mean + /− SEM, with *p < 0.05, **p < 0.01, ***p < 0.001, and n.s. p > 0.05 by One-Way ANOVA with Tukey’s Multiple comparisons test except for (D, H, and J) which were analyzed by two-sided unpaired t-test. Statistics in panels E, F, J, and K are comparisons to untreated controls and in panels A and B are comparisons to the S-only control condition.Source data are provided as a Source Data file.
Fig. 7
Fig. 7. SARS-CoV-2 S triggers production of TGF-β, and TGF-β signaling is required for S-mediated barrier dysfunction.
A Commercial ELISA detecting TGF-β in medium without cell conditioning (Media), medium from untreated HPMEC, and medium from HPMEC treated with 10 µg/mL SARS-CoV-2 S. Data are from n = 4 (media and HPMEC + S) and n = 6 (HPMEC) biological replicates. B TEER assay measuring the effect of recombinant TGF-β on barrier function of HPMEC at the indicated concentrations. TEER readings were taken 24 hpt. Data are from n = 3 biological replicates. C TEER assay measuring the capacity of an anti-TGFBR antibody, at the indicated concentrations, to abrogate S-mediated endothelial hyperpermeability (S at 10 µg/mL) of HPMECs and HPMEC/ACE2. TEER readings were taken 24 hpt. Data are from n = 3 biological replicates. D TEER assay measuring the capacity of TGFBR inhibitor SB431542 (1 µM) to inhibit S (10 µg/mL) function. Data are from n = 3 biological replicates. E Same as D, except an EGL assay measuring sialic acid. Data are from n = 3 biological replicates. F Representative back from an intradermal leak assay of mice with the indicated treatments; S (15 µg) and SB431542 (1 µM) were injected simultaneously. G Quantification of F from n = 8 mice. H Western blot analysis of HPMECs transduced with lentivirus-encoding guide RNAs targeting the indicated genes. Actin was used as a loading control. Data are one representative experiment from n = 3 biological replicates. I TEER assay on the same HPMEC as in H treated with 10 µg/mL of S and measured 24 hpt. Data are from n = 3 biological replicates. J EGL disruption assay on HPMECs from H, treated with 10 µg/mL S and imaged 24 hpt. Control guide data from this panel are from the same experiment as Fig. 4G. Data are from n = 3 biological replicates. K Graphical abstract summarizing the ACE2-independent pathway by which SARS-CoV-2 S triggers barrier dysfunction. Solid lines represent steps with direct experimental evidence, while dotted lines represent hypothesized steps. For all figures, dotted lines in graphs are the normalized untreated control conditions. MFI is mean fluorescence intensity. All data are plotted as mean + /− SEM with *p < 0.05, **p < 0.01, ***p < 0.001, and n.s. p > 0.05 by One-Way ANOVA with Tukey’s Multiple comparisons test except for (G) which was analyzed by two-sided unpaired t-test. Statistics in panels B, D, I, and J are comparisons to untreated controls and in panels C and E are comparisons to the S-only control condition. Source data are provided as a Source Data file.

Update of

References

    1. Xu Z, et al. Pathological findings of COVID-19 associated with acute respiratory distress syndrome. Lancet Respir. Med. 2020;8:420–422. doi: 10.1016/S2213-2600(20)30076-X. - DOI - PMC - PubMed
    1. Zhang B, et al. Clinical characteristics of 82 cases of death from COVID-19. PLoS One. 2020;15:e0235458. doi: 10.1371/journal.pone.0235458. - DOI - PMC - PubMed
    1. Yang X, et al. Clinical course and outcomes of critically ill patients with SARS-CoV-2 pneumonia in Wuhan, China: a single-centered, retrospective, observational study. Lancet Respir. Med. 2020;8:475–81.. doi: 10.1016/S2213-2600(20)30079-5. - DOI - PMC - PubMed
    1. Zhu N, et al. A Novel Coronavirus from Patients with Pneumonia in China, 2019. N. Engl. J. Med. 2020;382:727–33.. doi: 10.1056/NEJMoa2001017. - DOI - PMC - PubMed
    1. Jin Y, et al. Endothelial activation and dysfunction in COVID-19: from basic mechanisms to potential therapeutic approaches. Signal Transduct. Target Ther. 2020;5:293. doi: 10.1038/s41392-020-00454-7. - DOI - PMC - PubMed

Substances