. 2022 Dec 9;13(1):7627.
doi: 10.1038/s41467-022-35374-3.

High-throughput robust single-cell DNA methylation profiling with sciMETv2

Affiliations

High-throughput robust single-cell DNA methylation profiling with sciMETv2

Ruth V Nichols et al. Nat Commun. .

Abstract

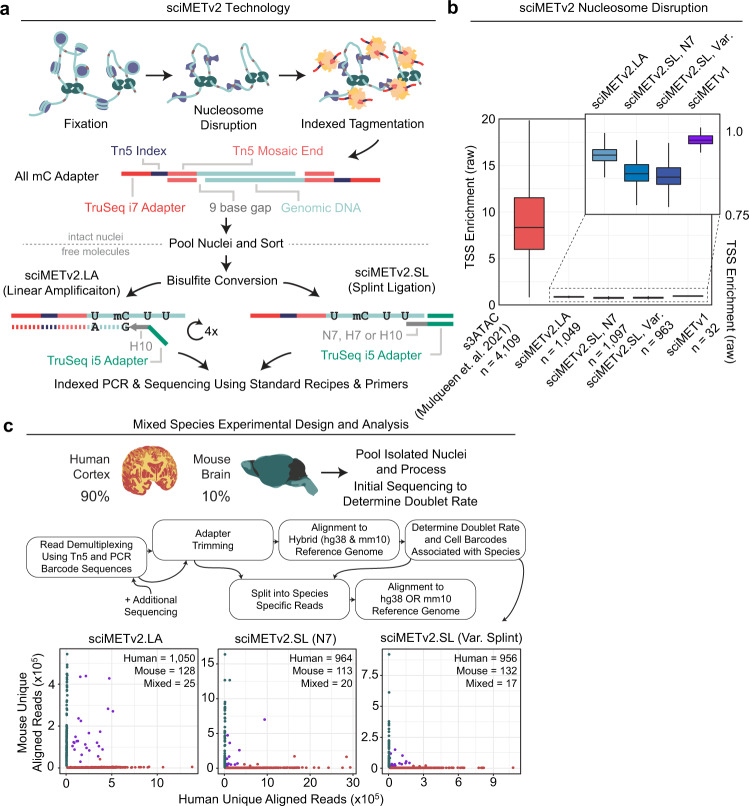
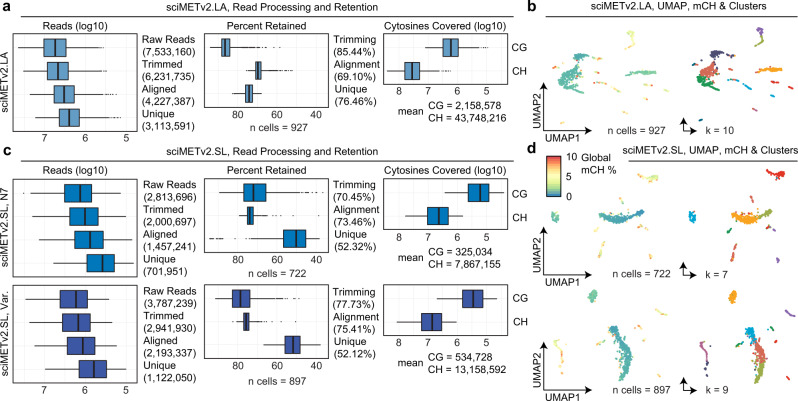
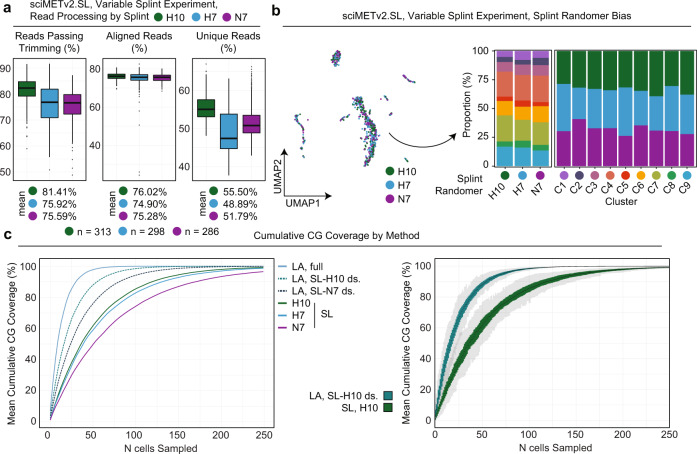
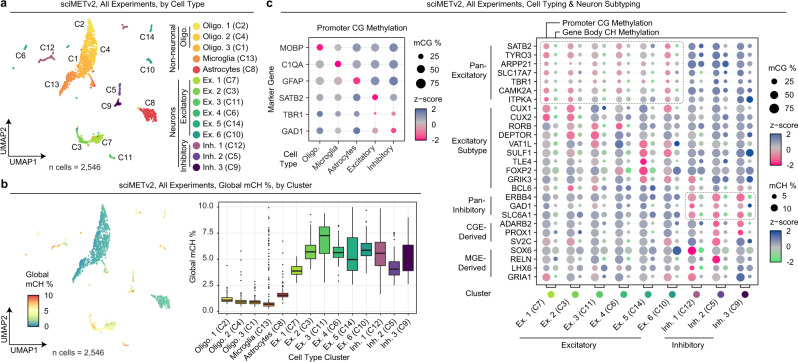
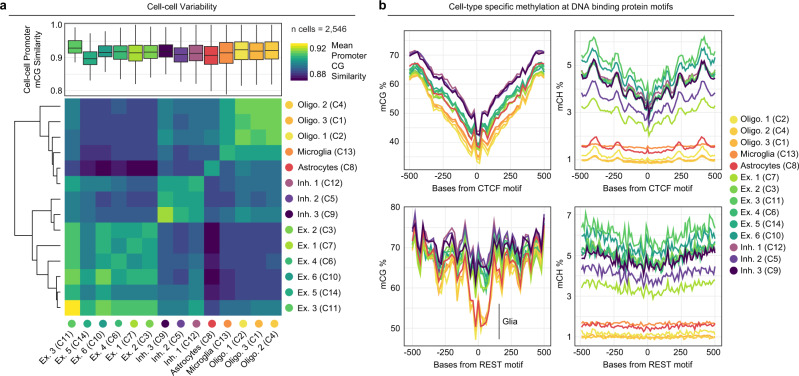
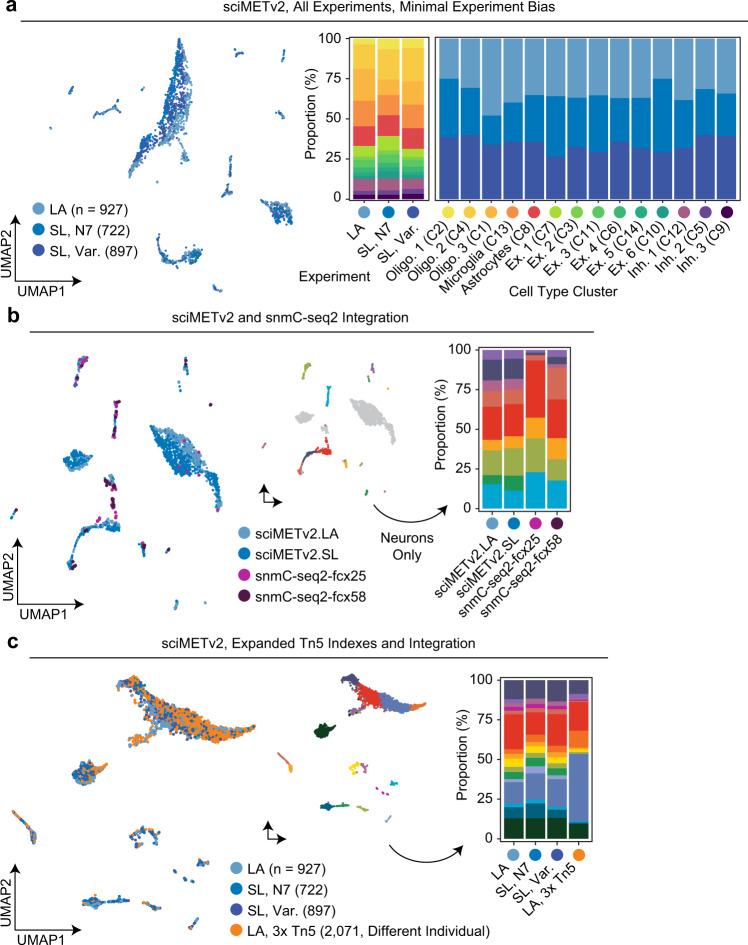
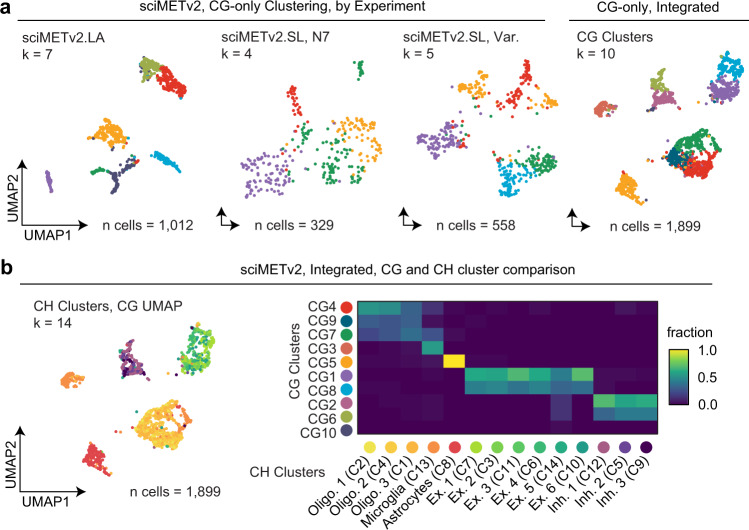
DNA methylation is a key epigenetic property that drives gene regulatory programs in development and disease. Current single-cell methods that produce high quality methylomes are expensive and low throughput without the aid of extensive automation. We previously described a proof-of-principle technique that enabled high cell throughput; however, it produced only low-coverage profiles and was a difficult protocol that required custom sequencing primers and recipes and frequently produced libraries with excessive adapter contamination. Here, we describe a greatly improved version that generates high-coverage profiles (~15-fold increase) using a robust protocol that does not require custom sequencing capabilities, includes multiple stopping points, and exhibits minimal adapter contamination. We demonstrate two versions of sciMETv2 on primary human cortex, a high coverage and rapid version, identifying distinct cell types using CH methylation patterns. These datasets are able to be directly integrated with one another as well as with existing snmC-seq2 datasets with little discernible bias. Finally, we demonstrate the ability to determine cell types using CG methylation alone, which is the dominant context for DNA methylation in most cell types other than neurons and the most applicable analysis outside of brain tissue.


Conflict of interest statement

J.T., D.P., and F.J.S. are employees of Scale Biosciences. R.M.M., F.J.S., and A.C.A. are authors on licensed patents that cover the nucleosome disruption and indexed tagmentation design components of the technologies described in this manuscript (WO2018018008A1 and WO2018226708A1, granted). This potential conflict of interest for A.C.A. and R.M.M. has been reviewed and managed by OHSU. The remaining authors declare no competing interests.

Figures

Fig. 1
Fig. 1. sciMETv2 method and experimental design.
a Molecular workflow for the sciMETv2 technologies. b Nucleosome disruption effectiveness as measured by raw transcription start site (TSS) enrichment. Tagmentation of intact nuclei preserves TSS enrichment which is ablated by nucleosome disruption in sciMET assays. For all boxplots, boxes indicate median, 25th and 75th percentiles with min and max lines as 1.5x interquartile range. c Experimental design for the human and mouse mixing experiments, the analysis workflow, and species alignment rates for a subset of the sequencing reads in order to determine doublet rates and identify species specific cell barcodes.
Fig. 2
Fig. 2. sciMETv2 technical performance.
a Read processing and retention for sciMETv2.LA, mean values in parentheses. b UMAP projection colored by global CH methylation levels (left) or cluster (right). c Read processing and retention for sciMETv2.SL experiments. d UMAP projection colored by global CH methylation levels (left) or cluster (right). For all boxplots, boxes indicate median, 25th and 75th percentiles with min and max lines as 1.5x interquartile range.
Fig. 3
Fig. 3. sciMETv2 splint ligation optimization and performance.
a Read processing and retention broken down by the three splint designs in the variable splint sciMETv2.SL experiment. For all boxplots, boxes indicate median, 25th and 75th percentiles with min and max lines as 1.5x interquartile range. b UMAP colored by variable splint (left) and composition of clusters by splint and splint by clusters (right). c Cumulative coverage from sampled cells for each method over 100 iterations. Mean values for iterations (left) are shown and include two down sampled variants of the sciMETv2.LA dataset to match the raw read count of the sciMETv2.SL datasets using the H10 (LA, SL-H10 ds.) or N7 (LA, SL-N7 ds.) splints. The distribution of coverage across iterations is shown for the LA, SL-H10 ds. and the SL-H10 datasets (right).
Fig. 4
Fig. 4. sciMETv2 cell type analysis and method bias assessment.
a UMAP projection of the three sciMETv2 preparations integrated together colored by cluster. b Global CH methylation levels per cell in the UMAP projection (left) and by cluster (right). For all boxplots, boxes indicate median, 25th and 75th percentiles with min and max lines as 1.5x interquartile range. c Promoter CG methylation levels of marker genes for cell-type-aggregated clusters (left) and both promoter CG methylation and gene body CH methylation for neuronal marker genes and subtype markers. Dashed lines represent clusters showing evidence of positive gene regulation for excitatory (top) or inhibitory (bottom) marker genes.
Fig. 5
Fig. 5. Cell-cell variability and motif analysis of sciMETv2 data.
a Cell-cell variability as measured by all-by-all methylation similarity at promoter CG sites within each cluster (top), and the mean similarity for cells of different cell types represented as a heatmap (bottom). For all boxplots, boxes indicate median, 25th and 75th percentiles with min and max lines as 1.5x interquartile range. b Assessment of cell-type-specific methylation patterns for CG (left) and CH (right) centered on motifs for CTCF (top) and REST (RE1, bottom). Reduced CG methylation at RE1 sites in glial cell populations is noted.
Fig. 6
Fig. 6. Assessment of bias between experiments and technologies.
a Integrated UMAP colored by sciMETv2 experiment (left) and the cluster breakdown for each experiment as well as experiment breakdown for each cluster (right). b Integration with human frontal cortex snmC-seq2 data projected into a UMAP and colored by assay (left), and by clusters (middle, non-neuron clusters are grayed out), with the cluster composition of each method (right). c Integration with a sciMETv2.LA dataset produced using three sets of 96 indexes at the tagmentation step performed on a different individual. Cells from each method were present in each cluster, though greater counts of glial cells were observed in the new preparation.
Fig. 7
Fig. 7. Analysis of sciMETv2 datasets using CG methylation alone.
a UMAP projections colored by cluster for each sciMETv2 experiment when analyzed using CG methylation alone and for the integrated sciMETv2 dataset processed (right). b CG based UMAP on the integrated dataset as in a, with cells colored by CH methylation clusters that were previously determined and a confusion matrix comparing the CG (y-axis) and CH (x-axis) cluster identities.

References

    1. Liu H, et al. DNA methylation atlas of the mouse brain at single-cell resolution. Nature. 2021;598:120–128. doi: 10.1038/s41586-020-03182-8. - DOI - PMC - PubMed
    1. Luo C, et al. Single-cell methylomes identify neuronal subtypes and regulatory elements in mammalian cortex. Sci. (80-.) 2017;357:600–604. doi: 10.1126/science.aan3351. - DOI - PMC - PubMed
    1. Smallwood SA, et al. Single-cell genome-wide bisulfite sequencing for assessing epigenetic heterogeneity. Nat. Methods. 2014;11:817–820. doi: 10.1038/nmeth.3035. - DOI - PMC - PubMed
    1. Farlik M, et al. Single-cell DNA methylome sequencing and bioinformatic inference of epigenomic cell-state dynamics. Cell Rep. 2015;10:1386–1397. doi: 10.1016/j.celrep.2015.02.001. - DOI - PMC - PubMed
    1. Hui T, et al. High-resolution single-cell DNA methylation measurements reveal epigenetically distinct hematopoietic stem cell subpopulations. Stem Cell Rep. 2018;11:578–592. doi: 10.1016/j.stemcr.2018.07.003. - DOI - PMC - PubMed