. 2022 Dec 9;13(1):7601.
doi: 10.1038/s41467-022-35399-8.

Visualizing the transiently populated closed-state of human HSP90 ATP binding domain

Affiliations

Visualizing the transiently populated closed-state of human HSP90 ATP binding domain

Faustine Henot et al. Nat Commun. .

Abstract

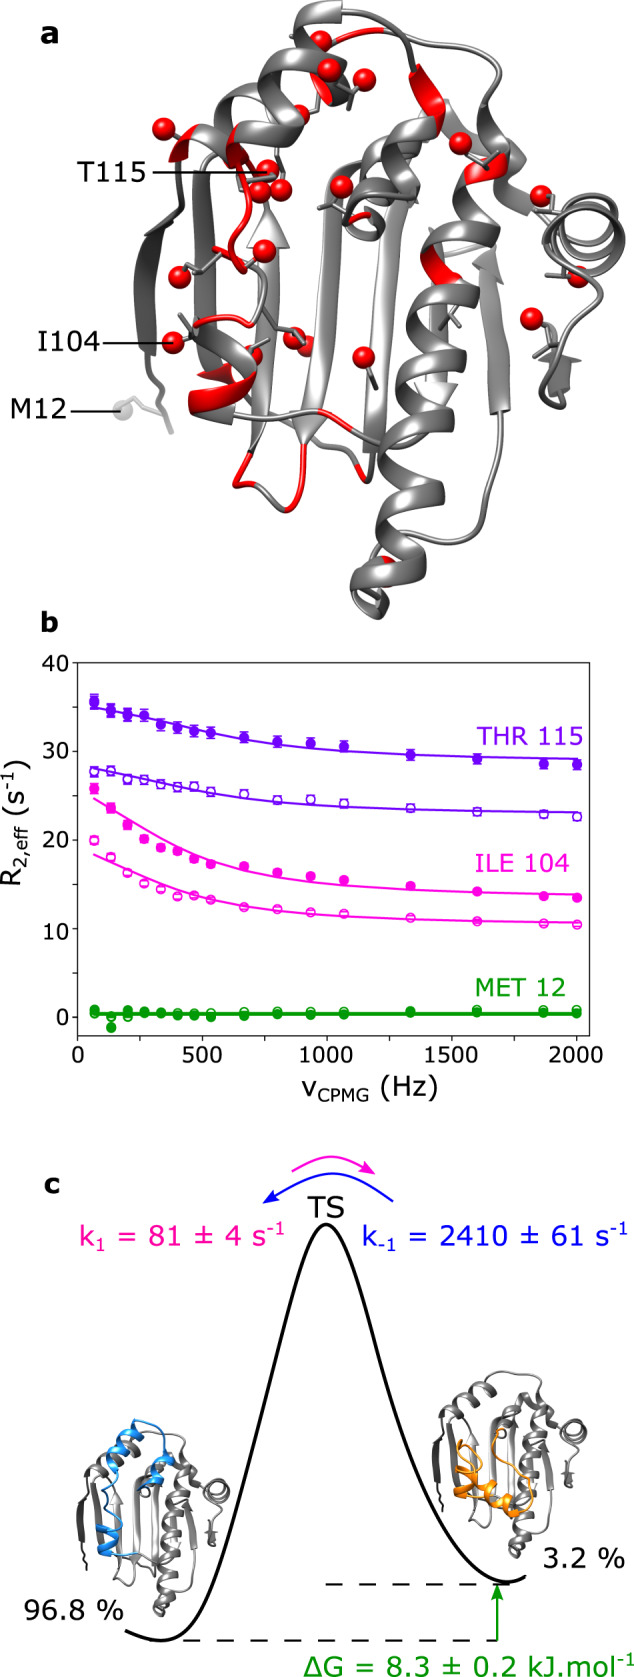
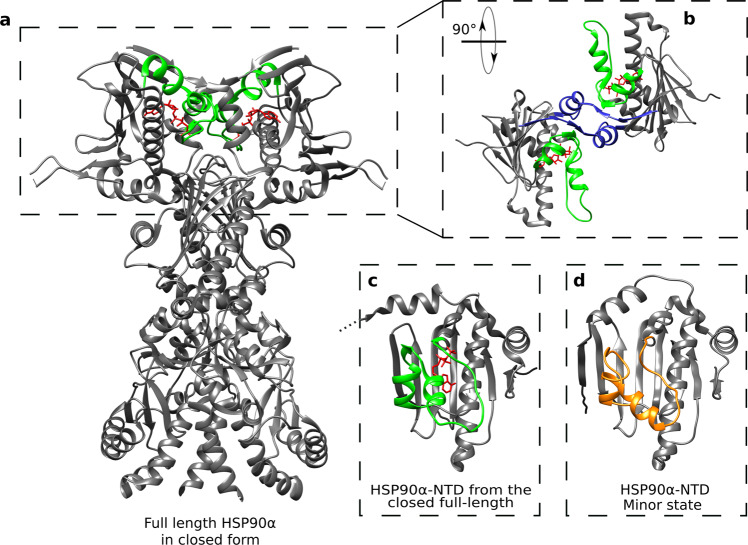
HSP90 are abundant molecular chaperones, assisting the folding of several hundred client proteins, including substrates involved in tumor growth or neurodegenerative diseases. A complex set of large ATP-driven structural changes occurs during HSP90 functional cycle. However, the existence of such structural rearrangements in apo HSP90 has remained unclear. Here, we identify a metastable excited state in the isolated human HSP90α ATP binding domain. We use solution NMR and mutagenesis to characterize structures of both ground and excited states. We demonstrate that in solution the HSP90α ATP binding domain transiently samples a functionally relevant ATP-lid closed state, distant by more than 30 Å from the ground state. NMR relaxation enables to derive information on the kinetics and thermodynamics of this interconversion, while molecular dynamics simulations establish that the ATP-lid in closed conformation is a metastable exited state. The precise description of the dynamics and structures sampled by human HSP90α ATP binding domain provides information for the future design of new therapeutic ligands.


Conflict of interest statement

The authors declare no competing interests.

Figures

Fig. 1
Fig. 1. Analysis of available structures of human HSP90α-NTD.
a Superimposition of 8 centroids representing the 8 clusters describing the 334 structures of isolated HSP90α-NTD available in the Protein Data Bank (on January the 5th of 2021). Clustering was performed using the MaxCluster program (http://www.sbg.bio.ic.ac.uk/maxcluster) with an Average Linkage type of hierarchical clustering and a threshold value of 1.05. In blue is depicted the segment [98–136] and in red the nucleotide. b Histogram of the averaged pairwise RMSD between Cα backbone atoms of the 8 centroids in Å as a function of the residue number (black). Grey bars represent non-assigned backbone residues. On top of the histogram: secondary structure elements as a function of the residue number (α for helices and β for sheets). c Zooms on the segment [98–136], that shows the highest structural variability, for all the 8 centroids superimposed using the Chimera MatchMaker command. PDB ID and a number of structures present in each cluster are disclosed next to each centroid. d Table representing pairwise RMSD in Å between Cα backbone atoms belonging to the segment [98–136] of each pair of the 8 centroids superimposed using Chimera MatchMaker command (PDB IDs: 1: 2XHT, 2: 2XK2, 3: 4NH8, 4: 3K99_A, 5: 3R4P_B, 6: 4YKW_A, 7: 6B9A_A, 8: 1BYQ). Going from blue to red the RMSD values increase. Centroids from clusters (1), (2), and (8) are highly similar (low pairwise RMSD values) on the segment [98–136], but these three centroids differ mainly on another segment of the protein [64–75].
Fig. 2
Fig. 2. HSP90α-NTD samples two states in solution.
a 2D-strips extracted from 13CH3-edited 3D NOESY, at 13C frequencies of M130, I131 and L29 methyl groups of WT-HSP90α-NTD. The 3D HMQC-NOESY-HMQC experiment was acquired at 25 °C on a spectrometer operating at a 1H frequency of 950 MHz. b Representation on a 3D structure of HSP90α-NTD (PDB 1YES) of examples of intermethyl NOEs involving M130 and I131 with methyl groups distant by more than 30 Å. c Representatives two states of HSP90α-NTD calculated simultaneously to satisfy all NMR restraints acquired on WT-HSP90α-NTD. Boxes correspond to zooms on structure displaying interactions stabilizing the conformation of the ATP-lid either in closed (orange) or open conformation (blue) d Variation of average CYANA target function for the 20 best structures according to the number of states used to calculate each conformer. e Table summarizing intensity increases (+), decreases (−), or disappearance (Ø) of characteristic NOEs corresponding to HSP90α-NTD ATP-lid open and closed states (Supplementary Table 2).
Fig. 3
Fig. 3. Solution structure ensembles of HSP90α-NTD ATP-lid open and closed states.
For each state, the 20 best CYANA conformers were selected for further restrained molecular dynamics refinement in explicit water. For each panel, the centroid representative conformer of the ensemble is presented on the left in an orientation similar to Fig. 2b, c. On the right the structure ensemble is tilted by 30° and was superimposed on the coordinate of the centroid conformers. a structure ensemble for ATP-lid open/ground-state calculated using NMR structural distance restraints obtained using R60A-HSP90α-NTD sample. b Structure ensemble for ATP-lid closed/excited-state calculated using NMR structural distance restraints obtained using R46A-HSP90α-NTD sample. Helices 3, 4, and 5 correspond to ATP-lid helices. The positions of residues 98 and 136 are also indicated. The location of the unfolded α5 helix in the closed state is also indicated (between 128 and 136).
Fig. 4
Fig. 4. Molecular dynamic investigation of HSP90α-NTD ATP-lid open and closed states.
a Pairwise RMSD among the 4000 ATP-lid structures obtained in the forty Molecular Dynamics simulations of 1 µs. From blue to yellow, the RMSD values increase. The initial models are the two ensembles of experimentally refined structures (see Fig. 3a, b). The first and second half of the 4000 frames are extracted from simulations starting with the ATP-lid in the open state (blue square) or in the closed state (orange square), respectively. b Superimposition of the 4 centroids representing the 4 clusters describing 20020 conformations extracted from the simulations starting with ATP-lid open-state conformers. The ATP-lid centroids are represented in b.1, b.2, b.3, and b.4 with the total number of members for each cluster. Below, the circle radii are proportional to the spreading of the cluster (in Å). c Same as (b) for the 5 centroids representing the 5 clusters describing 20020 conformations extracted from the simulation starting with ATP-lid closed-state conformers. d Pair-wise Cα-RMSD between the centroids of the clusters represented in (b) and (c), with a color-code that is darker when the RMSD is higher. Blue and orange indices correspond to the clusters presented in (b) and (c) issued from the simulations starting from open and closed states, respectively. e Representation of NOE distance restraints characteristics of ATP-lid open and closed states, on the corresponding structures. f Violations of characteristics NOEs monitored during the molecular dynamics simulations performed without restraints, for the 20 simulations starting with the ATP-lid in the open state (see methods for definition of computed violations). The values are averaged over all the specific distance restraints depicted in (e), either for the ATP-lid open states (blue curves) or for closed states (orange curves) (Supplementary Table 2). g As (f), for three typical simulations starting with the ATP-lid in the closed state: one remains stable (I), one undergoes a transition towards the ATP-lid in the open-state (II), and one derives towards region of conformational space that is neither the closed, nor the open ATP-lid state (III).
Fig. 5
Fig. 5. Relaxation dispersion study of HSP90α-NTD.
a 3D structure of human HSP90α-NTD displaying in red methyl- and backbone 15N- probes for which conformational exchange in the μs-ms time scale was detected. b Examples of 13CH3 MQ CPMG relaxation dispersion profiles of Thr-115, Ile-104 and Met-12 plotted in purple, pink and green, respectively. The filled circles for each color represent data acquired at 850 MHz, and the empty circles represent data acquired at 700 MHz. Data displayed were acquired at 293 K using a U-[2H, 15N, 12C], Ala-[13C1H3]β, Ile-[13C1H3]δ1, Leu-[13C1H3]δ2, Met-[13C1H3]ε, Thr-[13C1H3]γ, Val-[13C1H3]γ2 HSP90-NTD sample. Experimental data were fitted to a two-sites exchange model (global fit of 21 relaxation dispersion curves). Errors for R2,eff rate values were estimated from twice the noise measured in the spectra. However, when errors were less than 2% of the R2,eff rate value, an error of 2% was assumed. c Schematic diagram of the energy landscape for the exchange between the ATP-lid open (ground) and closed (excited) states of HSP90α-NTD. Both thermodynamics and kinetics parameters of the exchange, extracted at 293 K, are displayed. Activation energies can be estimated using Eyring equation (assuming that the transmission coefficient κ is 1). From the ground state to the transition state: ΔG = 61.0 ± 0.2 kJ.mol−1 and from the excited state to the transition state: ΔG = 52.7 ± 0.1 kJ.mol−1. The precision on the data was estimated using Monte Carlo.
Fig. 6
Fig. 6. Structure comparison of HSP90α-NTD excited state with full-length dimeric HSP90 α functional cycle intermediate.
a Structure of the homodimer full-length HSP90α in closed form stabilized by p23, FKBP51 and ATP (PDB 7L7J). The segment covering the nucleotide-binding site and ATP are colored in green and red, respectively. b Zoom on the two N-terminal domains of the full-length HSP90α, turned by 90°. The blue segments represent the β strands exchanging between the two chains of the homodimer. c N-terminal domain of HSP90α (PDB 7L7J). d Average structure of the calculated ensemble for ATP-lid closed (excited) state of apo HSP90α-NTD. The segment 98–136 is represented in orange.

References

    1. Backe SJ, Sager RA, Woodford MR, Makedon AM, Mollapour M. Post-translational modifications of Hsp90 and translating the chaperone code. J. Biol. Chem. 2020;295:11099–11117. doi: 10.1074/jbc.REV120.011833. - DOI - PMC - PubMed
    1. Zuehlke A, Johnson JL. Hsp90 and co-chaperones twist the functions of diverse client proteins. Biopolymers. 2010;93:211–217. doi: 10.1002/bip.21292. - DOI - PMC - PubMed
    1. Schopf FH, Biebl MM, Buchner J. The HSP90 chaperone machinery. Nat. Rev. Mol. Cell Biol. 2017;18:345–360. doi: 10.1038/nrm.2017.20. - DOI - PubMed
    1. Picard. HSP90 INTERACTORS Chaperones and relatives. Available at: http://www.picard.ch/downloads/Hsp90interactors.pdf (Accessed: 13th October 2021)
    1. Biebl M, et al. NudC guides client transfer between the Hsp40/70 and Hsp90 chaperone systems. Mol. Cell. 2022;82:555–569. doi: 10.1016/j.molcel.2021.12.031. - DOI - PubMed