. 2022 Dec 9;13(1):7613.
doi: 10.1038/s41467-022-35390-3.

Meteorin-like is an injectable peptide that can enhance regeneration in aged muscle through immune-driven fibro/adipogenic progenitor signaling

Affiliations

Meteorin-like is an injectable peptide that can enhance regeneration in aged muscle through immune-driven fibro/adipogenic progenitor signaling

David E Lee et al. Nat Commun. .

Abstract

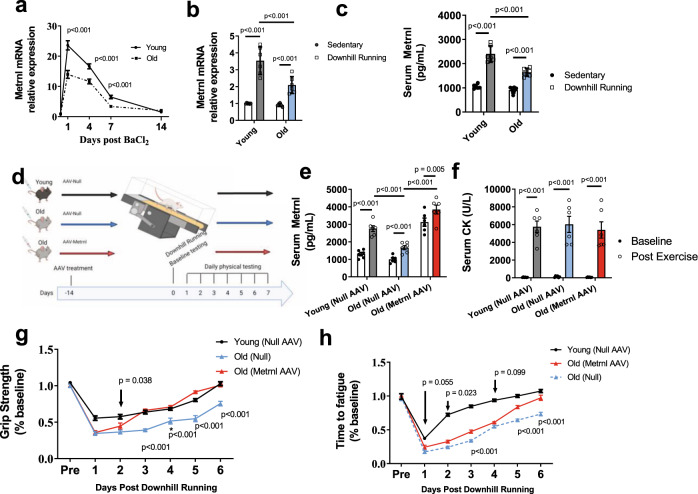
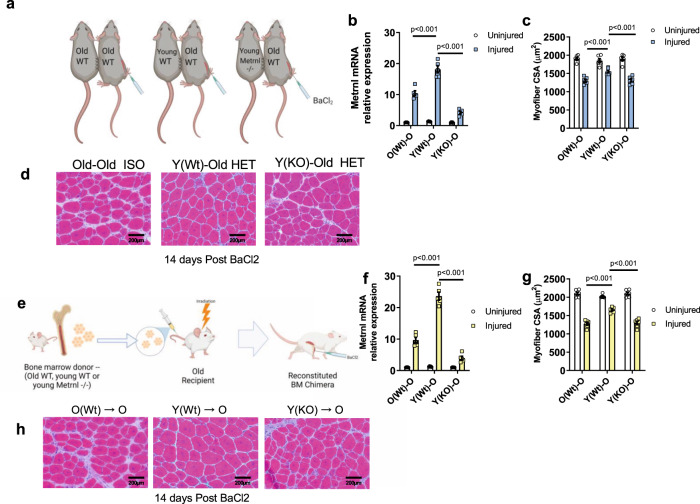
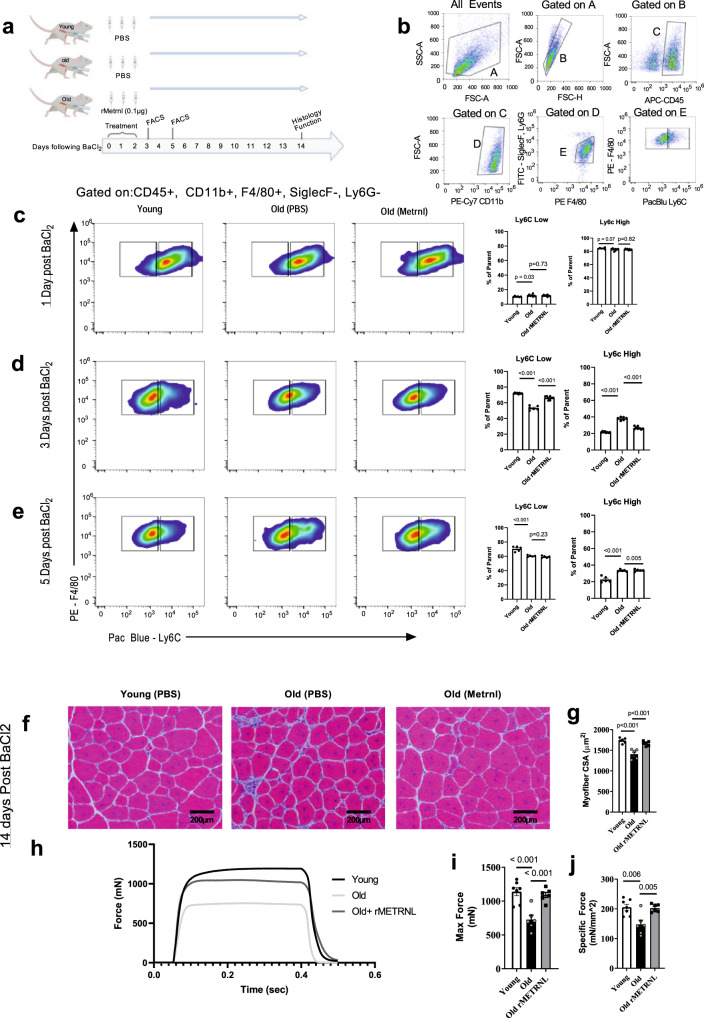
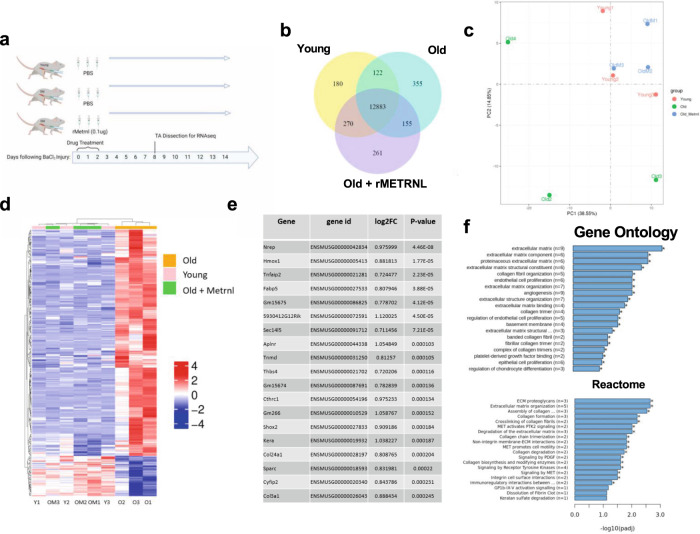
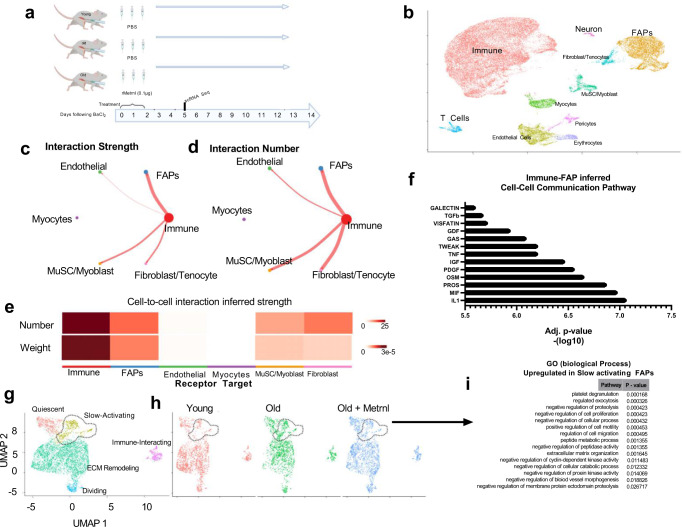
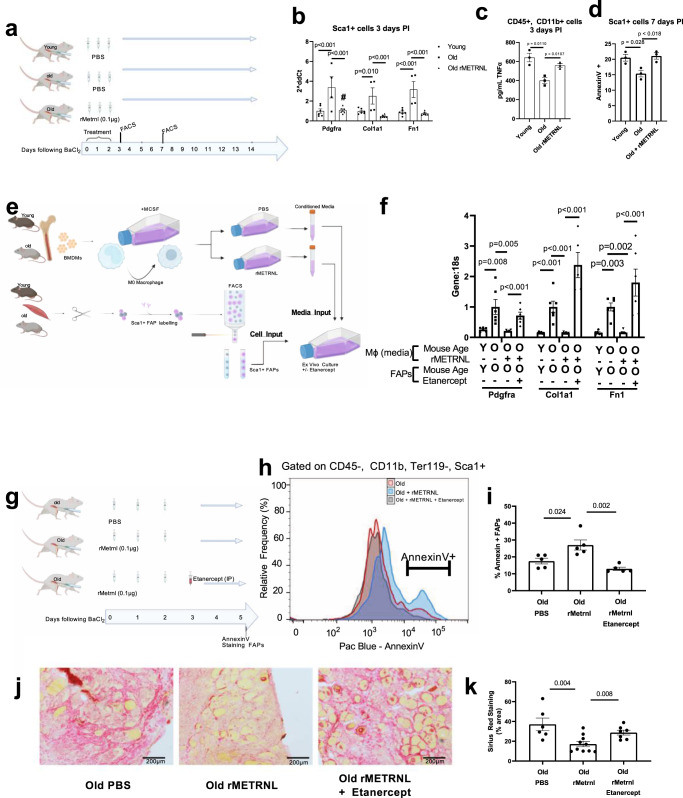
Pathologies associated with sarcopenia include decline in muscular strength, lean mass and regenerative capacity. Despite the substantial impact on quality of life, no pharmacological therapeutics are available to counteract the age-associated decline in functional capacity and/or, resilience. Evidence suggests immune-secreted cytokines can improve muscle regeneration, a strategy which we leverage in this study by rescuing the age-related deficiency in Meteorin-like through several in vivo add-back models. Notably, the intramuscular, peptide injection of recombinant METRNL was sufficient to improve muscle regeneration in aging. Using ex vivo media exchange and in vivo TNF inhibition, we demonstrate a mechanism of METRNL action during regeneration, showing it counteracts a pro-fibrotic gene program by triggering TNFα-induced apoptosis of fibro/adipogenic progenitor cells. These findings demonstrate therapeutic applications for METRNL to improve aged muscle, and show Fibro/Adipogenic Progenitors are viable therapeutic targets to counteract age-related loss in muscle resilience.


Conflict of interest statement

The authors declare no competing interests.

Figures

Fig. 1
Fig. 1. Meteorin-like expression is reduced in aged muscle regeneration.
a Metrnl mRNA measured by qPCR from mouse TA muscles following BaCl2-induced muscle damage (n = 6 independent animals/age/timepoint); two-tailed t test was used to compare young to old at each timepoint. b Metrnl mRNA and c plasma protein in young and old mice 24 h following downhill running-induced muscle damage (n = 6 independent animals/group); 2 × 2 ANOVA was used with Fisher’s LSD post hoc analysis. d Graphic representation of mouse downhill running experiments. e Circulating METRNL before and at 24 h post downhill running (n = 6 independent animals/group); 2 × 3 ANOVA was used with Fisher’s LSD post hoc analysis. f Circulating creatine kinase measure before and 72 h after injury. n = 6 independent animals/group; 2 × 2 ANOVA was used with Fisher’s LSD post hoc analysis. g Grip strength and h running time to fatigue as a percent of baseline measured before and each day following downhill running (n = 6 animals/group; two-tailed t test was used to compare old(Null) to old(Metrnl) at each timepoint. Source Data are provided as a source data file. Graphics created with BioRender.com. All p values are indicated with line connecting comparison groups. Data are presented as mean values ± SEM. WT wild-type, KO METRNL−/−, Y young, O old, ISO isochronic; HET heterochronic.
Fig. 2
Fig. 2. Replacement of circulating Metrnl improves aged muscle regeneration following BaCl2 injection.
a Graphical representation of Heterochronic parabiosis groups (n = 6/old WT parabionts tested per group). b Metrnl mRNA content measured by qPCR from uninjured and 24-hours post-injury TA muscles of old wild-type parabiont (n = 5 animals/group); 2 × 3 ANOVA was used with Fisher’s LSD post hoc analysis only to compare differences between injured groups. c Cross-sectional area quantified from micrographs (n = 6 animals/group); 2 × 3 ANOVA was used with Fisher’s LSD post hoc analysis only to compare differences between injured groups. d Representative Hematoxylin and Eosin-stained micrographs from c—14 days following BaCl2-induced muscle damage in the old wild-type parabionts. e Graphical representation of Bone marrow chimera experiment. f Metrnl mRNA content measured by qPCR from uninjured and 24-hours post-injury TA muscles of Old chimera (n = 5 animals/group); 2 × 3 ANOVA was used with Fisher’s LSD post hoc analysis only to compare differences between injured groups. g Cross-sectional area quantified from micrographs (n = 6 animals/group); 2 × 3 ANOVA was used with Fisher’s LSD post hoc analysis only to compare differences between injured groups. h Representative Hematoxylin and Eosin-stained micrographs of g 14 days following BaCl2-induced muscle damage in the Old chimera. Source Data are provided as a source data file. Graphics created with BioRender.com. All p values are indicated with lines connecting comparison groups. Data are presented as mean values ± SEM.
Fig. 3
Fig. 3. Intramuscular treatment with rMETRNL improves aged muscle regeneration through transition of the inflammatory/anti-inflammatory immune profile.
a Graphical representation of rMetrnl treatment groups and timeline for experiments. b Example gating strategy used for macrophage identification and subtype analysis. The final dot plot (F4/80 vs Ly6C) represents the data shown in ce. Representative flow cytometry results and bar graphs of cells isolated from tibialis anterior muscles c 1 day (n = 6 young, 10 old, 10 old +rMetrnl), d 3 days (n = 8 young, 6 old, 8 old + rMetrnl), and e 5 days (n = 5 animals/group) post injury; one-way ANOVA was used with Fisher’s LSD post hoc analysis. f Hematoxylin and Eosin-stained micrographs of tibialis anterior muscles 14 days follow BaCl2-induced muscle damage and g quantified cross-sectional area (n = 6/group); one-way ANOVA was used with Fisher’s LSD post hoc analysis. h Representative force generation following tetanic stimulation of tibialis anterior muscles in situ. Summary data (n = 7 young, 6 old, 6 old+rMetrnl animals) for maximum force (i) and specific force (j); one-way ANOVA was used with Fisher’s LSD post hoc analysis. Source Data are provided as a source data file. All p values are indicated with line connecting comparison groups. Graphics created with BioRender.com. Data are presented as mean values ± SEM.
Fig. 4
Fig. 4. rMetrnl rejuvenates the transcriptional profile of aged muscle regeneration.
a Graphical representation of experimental design (n = 3/group). b Venn Diagram of co-expressed transcripts between groups. c 2D Graphical representation of principal component analysis showing top two principal components of transcriptomic data. d Heatmap and dendrogram of transcript (y axis) expression level compared to mean expression across all groups (colormap) from each sample (x axis). e Top transcripts ranked by significance and log fold change when differential expression analysis was performed between old and old+rMetrnl groups; two-tailed t test was performed between old and old+rMetrnl and FDR adjusted to determine p value. f Gene set enrichment analysis performed to determine p values between old and old+rMetrnl groups specifically using Gene Ontology (Biological Processes) and Reactome databases. Graphics created with BioRender.com. Source data are available through GEO Accession ID GSE217037.
Fig. 5
Fig. 5. Single-cell transcriptomics shows rejuvenation of aged muscle tissue by rMetrnl treatment 4 days post-injury.
a Graphical representation of the experimental design. b Combined UMAP reduction plotted in two dimensions with cell cluster identities labeled. c, d Cell-to-cell communication analysis assessing ligand/receptor pairings across cell types. Immune cells were chosen for ligand source and strength of interaction and the number of ligand/receptor pairs is indicated by chord thickness. Number of cells in a group is indicated by circle diameter. e Heatmap showing results from c, d. f Two-tailed t test was performed and FDR adjusted to infer cell-to-cell communication pathways upregulated with immune cell-expressed ligands and FAP-expressed receptors. g Subset analysis of FAP cells from b shown by UMAP reduction and separated by sample group (h). Dashed circle highlights distinct FAP population identified as overrepresented in old PBS cells. i Gene Set Enrichment Analysis was used to determine p value using GO (biological process) database on FAP cell subset circled from g, h when differential expression analysis was performed against all other FAP cells. Graphics created with BioRender.com. Source data available through GEO at Accession ID GSE217258.
Fig. 6
Fig. 6. Metrnl rejuvenates aged muscle regeneration through macrophage-derived TNF-induced FAP apoptosis.
a Graphical representation of the experimental design for bd. b FACS-sorted cells Sca1+ FAPs were collected and mRNA analyzed by RT-qPCR. Genes are shown relative to 18 s which remained unchanged between biological groups (n = 6 animals/group); one-way ANOVA was used with Fisher’s LSD post hoc analysis. c FACS-sorted CD45+, CD11b+ cells were collected from 3 days PI mice and cultured for 36 h to allow cytokine secretion into culture media (n = 3 animals/group). Culture media was then subjected to ELISA analysis for TNF concentration; one-way ANOVA was used with Fisher’s LSD post hoc analysis. d Sca1+ cells from 7 days post injury were collected by and stained with AnnexinV and analyzed by flow cytometry to quantify apoptotic cell percentage (n = 3/group); one-way ANOVA was used with Fisher’s LSD post hoc analysis. e Schematic representation of ex vivo culture system using conditioned media collected from BMDM-differentiated M0 macrophages from young and old mice. This conditioned media was then used to culture Sca1+ FAPs isolated by FACS from young and old muscle. This allowed the separate treatment of M0 macrophages with rMETRL and treatment of FAPs with Etanercept. f mRNA from e analyzed by RT-qPCR (n = 6/group); one-way ANOVA was used with Fisher’s LSD post hoc analysis. g schematic representation for in vivo rMETRNL treatment combined with TNF inhibitor experiment. h Representative frequency distribution and i summary data for flow cytometry of AnnexinV gated on Sca1+ FAPs at 5 days post BaCl2 injury; (n = 5 mice/group); one-way ANOVA was used with Fisher’s LSD post hoc analysis. j Representative micrographs and k summary analysis of Sirius Red staining of collagen from tibialis anterior muscles 5 days follow BaCl2 injury (n = 6 old, 10 rMetrnl, 7 Etanercept muscle sections analyzed representing five animals/group); one-way ANOVA was used with Fisher’s LSD post hoc analysis. p value is indicated with connecting line between comparison groups. Source Data are provided as a source data file. Data are presented as mean values ±  SEM. Graphics created with BioRender.com.

References

    1. Martinez BP, et al. Frequency of sarcopenia and associated factors among hospitalized elderly patients. BMC Musculoskelet. Disord. 2015;16:108. doi: 10.1186/s12891-015-0570-x. - DOI - PMC - PubMed
    1. Janssen I, Shepard DS, Katzmarzyk PT, Roubenoff R. The healthcare costs of sarcopenia in the United States. J. Am. Geriatr. Soc. 2004;52:80–85. doi: 10.1111/j.1532-5415.2004.52014.x. - DOI - PubMed
    1. Brett JO, et al. Exercise rejuvenates quiescent skeletal muscle stem cells in old mice through restoration of Cyclin D1. Nat. Metab. 2020;2:307–317. doi: 10.1038/s42255-020-0190-0. - DOI - PMC - PubMed
    1. Cerletti M, Jang YC, Finley LW, Haigis MC, Wagers AJ. Short-term calorie restriction enhances skeletal muscle stem cell function. Cell Stem Cell. 2012;10:515–519. doi: 10.1016/j.stem.2012.04.002. - DOI - PMC - PubMed
    1. Baht GS, et al. Meteorin-like facilitates skeletal muscle repair through a Stat3/IGF-1 mechanism. Nat. Metab. 2020;2:278–289. doi: 10.1038/s42255-020-0184-y. - DOI - PMC - PubMed