

Ethnic and racial-specific differences in levels of centrosome-associated mitotic kinases, proliferative and epithelial-to-mesenchymal markers in breast cancers
- PMID: 36494865
- PMCID: PMC9733043
- DOI: 10.1186/s13008-022-00082-3
Ethnic and racial-specific differences in levels of centrosome-associated mitotic kinases, proliferative and epithelial-to-mesenchymal markers in breast cancers
Abstract
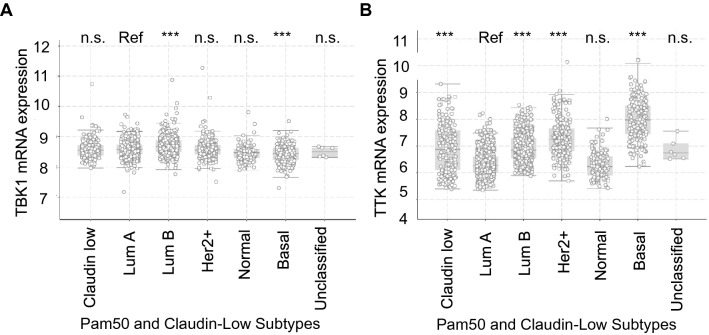
Molecular epidemiology evidence indicates racial and ethnic differences in the aggressiveness and survival of breast cancer. Hispanics/Latinas (H/Ls) and non-Hispanic Black women (NHB) are at higher risk of breast cancer (BC)-related death relative to non-Hispanic white (NHW) women in part because they are diagnosed with hormone receptor-negative (HR) subtype and at higher stages. Since the cell cycle is one of the most commonly deregulated cellular processes in cancer, we propose that the mitotic kinases TTK (or Mps1), TBK1, and Nek2 could be novel targets to prevent breast cancer progression among NHBs and H/Ls. In this study, we calculated levels of TTK, p-TBK1, epithelial (E-cadherin), mesenchymal (Vimentin), and proliferation (Ki67) markers through immunohistochemical (IHC) staining of breast cancer tissue microarrays (TMAs) that includes samples from 6 regions in the Southeast of the United States and Puerto Rico -regions enriched with NHB and H/L breast cancer patients. IHC analysis showed that TTK, Ki67, and Vimentin were significantly expressed in triple-negative (TNBC) tumors relative to other subtypes, while E-cadherin showed decreased expression. TTK correlated with all of the clinical variables but p-TBK1 did not correlate with any of them. TCGA analysis revealed that the mRNA levels of multiple mitotic kinases, including TTK, Nek2, Plk1, Bub1, and Aurora kinases A and B, and transcription factors that are known to control the expression of these kinases (e.g. FoxM1 and E2F1-3) were upregulated in NHBs versus NHWs and correlated with higher aneuploidy indexes in NHB, suggesting that these mitotic kinases may be future novel targets for breast cancer treatment in NHB women.
Keywords: Breast cancer; E-cadherin; Ki67; Nek2; TBK1; TTK; Tissue microarray; Vimentin.
© 2022. The Author(s).
Conflict of interest statement
The authors declare that they have no competing interests.
Figures


Similar articles
-
Mitotic kinases are emerging therapeutic targets against metastatic breast cancer.Cell Div. 2024 Jun 17;19(1):21. doi: 10.1186/s13008-024-00125-x. Cell Div. 2024. PMID: 38886738 Free PMC article. Review.
-
Mitotic kinases as drivers of the epithelial-to-mesenchymal transition and as therapeutic targets against breast cancers.Exp Biol Med (Maywood). 2021 May;246(9):1036-1044. doi: 10.1177/1535370221991094. Epub 2021 Feb 18. Exp Biol Med (Maywood). 2021. PMID: 33601912 Free PMC article. Review.
-
Novel pyrrolopyrimidines as Mps1/TTK kinase inhibitors for breast cancer.Bioorg Med Chem. 2017 Apr 1;25(7):2156-2166. doi: 10.1016/j.bmc.2017.02.030. Epub 2017 Feb 16. Bioorg Med Chem. 2017. PMID: 28259529
-
Racial/ethnic differences in the utilization of chemotherapy among stage I-III breast cancer patients, stratified by subtype: Findings from ten National Program of Cancer Registries states.Cancer Epidemiol. 2019 Feb;58:1-7. doi: 10.1016/j.canep.2018.10.015. Epub 2018 Nov 8. Cancer Epidemiol. 2019. PMID: 30415099 Free PMC article.
-
TTK/hMPS1 is an attractive therapeutic target for triple-negative breast cancer.PLoS One. 2013 May 20;8(5):e63712. doi: 10.1371/journal.pone.0063712. Print 2013. PLoS One. 2013. PMID: 23700430 Free PMC article.
Cited by
-
Creation and Characterization of a Breast Cancer Tissue Microarray Including Black and White Patients from Florida and Hispanic Patients from Puerto Rico and Florida.Cancer Res Commun. 2025 May 1;5(5):804-813. doi: 10.1158/2767-9764.CRC-24-0650. Cancer Res Commun. 2025. PMID: 40309949 Free PMC article.
-
Mitotic kinases are emerging therapeutic targets against metastatic breast cancer.Cell Div. 2024 Jun 17;19(1):21. doi: 10.1186/s13008-024-00125-x. Cell Div. 2024. PMID: 38886738 Free PMC article. Review.
-
Worse Clinical and Survival Outcomes in Breast Cancer Patients Living in Puerto Rico Compared to Hispanics, Non-Hispanic Blacks, and Non-Hispanic Whites from Florida.J Racial Ethn Health Disparities. 2024 Nov 14:10.1007/s40615-024-02232-5. doi: 10.1007/s40615-024-02232-5. Online ahead of print. J Racial Ethn Health Disparities. 2024. PMID: 39543072 Free PMC article.
References
-
- Sung H, Ferlay J, Siegel RL, Laversanne M, Soerjomataram I, Jemal A, et al. Global cancer statistics 2020: GLOBOCAN estimates of incidence and mortality worldwide for 36 cancers in 185 Countries. CA Cancer J Clin. 2021;71(3):209–249. - PubMed
-
- Iqbal J, Ginsburg O, Rochon PA, Sun P, Narod SA. Differences in breast cancer stage at diagnosis and cancer-specific survival by race and ethnicity in the United States. JAMA. 2015;313(2):165–1multidimensional cancer genomics datasets analysis. - PubMed
-
- Lund MJ, Trivers KF, Porter PL, Coates RJ, Leyland-Jones B, Brawley OW, et al. Race and triple negative threats to breast cancer survival: a population-based study in Atlanta. GA Breast Cancer Res Treat. 2009;113(2):357–370. - PubMed
Grants and funding
LinkOut - more resources
Full Text Sources
Miscellaneous
