. 2023 Jan 1;39(1):btac795.
doi: 10.1093/bioinformatics/btac795.

Variable-selection ANOVA Simultaneous Component Analysis (VASCA)

Affiliations

Variable-selection ANOVA Simultaneous Component Analysis (VASCA)

José Camacho et al. Bioinformatics. .

Abstract

Motivation: ANOVA Simultaneous Component Analysis (ASCA) is a popular method for the analysis of multivariate data yielded by designed experiments. Meaningful associations between factors/interactions of the experimental design and measured variables in the dataset are typically identified via significance testing, with permutation tests being the standard go-to choice. However, in settings with large numbers of variables, like omics (genomics, transcriptomics, proteomics and metabolomics) experiments, the 'holistic' testing approach of ASCA (all variables considered) often overlooks statistically significant effects encoded by only a few variables (biomarkers).

Results: We hereby propose Variable-selection ASCA (VASCA), a method that generalizes ASCA through variable selection, augmenting its statistical power without inflating the Type-I error risk. The method is evaluated with simulations and with a real dataset from a multi-omic clinical experiment. We show that VASCA is more powerful than both ASCA and the widely adopted false discovery rate controlling procedure; the latter is used as a benchmark for variable selection based on multiple significance testing. We further illustrate the usefulness of VASCA for exploratory data analysis in comparison to the popular partial least squares discriminant analysis method and its sparse counterpart.

Availability and implementation: The code for VASCA is available in the MEDA Toolbox at https://github.com/josecamachop/MEDA-Toolbox (release v1.3). The simulation results and motivating example can be reproduced using the repository at https://github.com/josecamachop/VASCA/tree/v1.0.0 (DOI 10.5281/zenodo.7410623).

Supplementary information: Supplementary data are available at Bioinformatics online.


Figures

Fig. 1.
Fig. 1.
Example 2: One-to-one relationships between three variables in X and C. Comparison of P-values computed with FDR, ASCA and VASCA (without and with bootstrapping). For each method, average P-values from 1000 simulations are shown together with a shaded area corresponding to one standard deviation. For the FDR, we represent the P-values in increasing order from left to right (from the most to the least significant variable), corrected following the procedure of BH. Whenever a corrected P-value exceeds 1, a value of 1 is used instead. For ASCA, a single P-value is shown, corresponding to the P-value for the dataset with 400 variables averaged over the 1000 simulations. For VASCA, the P-value at each number of variables m represents the significance of the dataset including the most significant m variables. The inset represents a detail for the first (most significant) 10 variables. Control limits of statistical significance (α=0.05 and α=0.01) are also represented
Fig. 2.
Fig. 2.
Multivariate relationship between three variables in X and C. Comparison of P-values computed with FDR, ASCA and VASCA (without and with bootstrapping). For each method, average P-values from 1000 simulations are shown together with a shaded area corresponding to one standard deviation. For the FDR, we represent the P-values in increasing order from left to right (from the most to the least significant variable), corrected following the procedure of BH. Whenever a corrected P-value exceeds 1, a value of 1 is used instead. For ASCA, a single P-value is shown, corresponding to the P-value for the dataset with 400 variables averaged over the 1000 simulations. For VASCA, the P-value at each number of variables m represents the significance of the dataset including the most significant m variables. The inset represents a detail for the first (most significant) 10 variables. Control limits of statistical significance (α=0.05 and α=0.01) are also represented
Fig. 3.
Fig. 3.
Comparison of P-values computed with FDR, ASCA and VASCA for the BIOASMA dataset (persistent asthma versus the rest). For the FDR, we represent the P-values in increasing order from left to right (from the most to the least significant variable), corrected following the procedure of BH. Whenever a corrected P-value exceeds 1, a value of 1 is used instead. For ASCA, a single P-value is shown, corresponding to the P-value for the complete dataset with 287 variables. For VASCA, the P-value at each number of variables m represents the significance of the dataset including the most significant m variables. The inset represents a detail for the first (most significant) 10 variables. Control limits of statistical significance (α=0.05 and α=0.01) are also represented
Fig. 4.
Fig. 4.
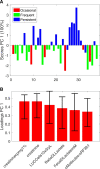
VASCA (six variables) scores (a) and loadings (b) plots for the BIOASMA dataset (persistent asthma versus the rest)

References

    1. Anderson M., Braak C.T. (2003) Permutation tests for multi-factorial analysis of variance. J. Stat. Comput. Simul., 73, 85–113.
    1. Barker M., Rayens W. (2003) Partial least squares for discrimination. J. Chemometr., 17, 166–173.
    1. Benjamini Y., Hochberg Y. (1995) Controlling the false discovery rate: a practical and powerful approach to multiple testing. J. R. Stat. Soc. Ser. B (Methodological), 57, 289–300.
    1. Benjamini Y., Yekutieli D. (2001) The control of the false discovery rate in multiple testing under dependency. Ann. Stat., 29, 1165–1188.
    1. Bevilacqua M. et al. (2013) Application of near infrared (NIR) spectroscopy coupled to chemometrics for dried egg-pasta characterization and egg content quantification. Food Chem., 140, 726–734. - PubMed

Publication types