. 2023 Feb 9;223(2):iyac180.
doi: 10.1093/genetics/iyac180.

Limits to transcriptional silencing in Saccharomyces cerevisiae

Affiliations

Limits to transcriptional silencing in Saccharomyces cerevisiae

Marc Fouet et al. Genetics. .

Abstract

Mating-type switching in the budding yeast Saccharomyces cerevisiae relies on the Sir protein complex to silence HML and HMR, the two loci containing copies of the alleles of the mating type locus, MAT. Sir-based transcriptional silencing has been considered locus-specific, but the recent discovery of rare and transient escapes from silencing at HMLα2 with a sensitive assay called to question if these events extend to the whole locus. Adapting the same assay, we measured that transient silencing failures at HML were more frequent for the α2 gene than α1, similarly to their expression level in unsilenced cells. By coupling a mating assay, at HML we found that one of the two genes at that locus can be transiently expressed while the other gene is maintained silent. Thus, transient silencing loss can be a property of the gene rather than the locus. Cells lacking the SIR1 gene experience epigenetic bistability at HML and HMR. Our previous result led us to ask if HML could allow for two independent epigenetic states within the locus in a sir1Δ mutant. A simple construct using a double fluorescent reporter at HMLα1 and HMLα2 ruled out this possibility. Each HML locus displayed a single epigenetic state. We revisited the question of the correlation between the states of two HML loci in diploid cells, and showed they were independent. Finally, we determined the relative strength of gene repression achieved by Sir-based silencing with that achieved by the a1-α2 repressor.

Keywords: bistability; epigenetics; heterochromatin; mating-type regulation; recombination enhancer; sirtuins; transcriptional silencing.


Conflict of interest statement

Conflicts of interest: The authors declare no conflict of interest.

Figures

Fig. 1.
Fig. 1.
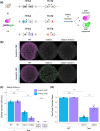
Cre-Reported altered state of heterochromatin (CRASH) assay at HMLα1 and HMLα2. a) Schematic of the CRASH assay used to report transient silencing loss events at the α1 and α2 genes at HML. The CRE gene replaced either the HMLα1 or HMLα2 coding sequence and was driven by the bidirectional α promoter. A cassette containing the EGFP gene and yEmRFP gene flanked by loxP sites, inserted on chromosome V, switches from expressing RFP to GFP whenever the Cre recombinase catalyzes intramolecular recombination between the two loxP sites. Even a short-lived expression of the CRE gene can be detected (Dodson and Rine 2015). Here and elsewhere, the E and I gray boxes represent the E and I silencers at HML. b) Fluorescent micrographs of representative colonies of α1-CRASH strains (WT: JRY14192, sir1Δ: JRY14279, sir3Δ: JRY14205) and α2-CRASH strains (WT: JRY14576, sir1Δ: JRY10712, sir3Δ: JRY14577). All strains are MATα hmrΔ except JRY14577 which is matΔ HMR. All strains here lacked the capacity to express the a1-α2 repressor, thus avoiding the potential for repression of the promoters driving CRE in cells that have lost silencing. Images were acquired at a depth of 8 bit. The [min, max] gray values displayed for the RFP channel are [5,140]; for the GFP channels they are [5,70] for WT and sir1Δ and [5,150] for sir3Δ. Images were cropped as squares of width 850 pixels. Scale bar is 1 mm. c) Flow cytometry quantification of an apparent silencing-loss rate (see Materials and methods for calculation) using the CRASH assay. Bar graphs and error bars show means ± SD. Left: WT strains (JRY9742: no CRE, JRY14192: hmlα1Δ::CRE, JRY14576: hmlα2Δ::CRE). The lower limit of detection for this method was given by the no CRE control with a mean apparent silencing-loss rate of 2.4 × 10⁻⁵ (± 2.3 × 10⁻⁵ SD) gen−1. Right: sir1Δ strains (JRY14279: hmlα1Δ::CRE, JRY10712: hmlα2Δ::CRE). d) Transcription levels by RT-qPCR for hmlα1Δ::CRE strains (WT: JRY14285, sir1Δ: JRY14289, sir4Δ: JRY14287) and hmlα2Δ::CRE strains (WT: JRY9630, sir1Δ: JRY9632, sir4Δ: JRY9631). CRE mRNA values are normalized to ALG9 mRNA values. A control strain without CRE (JRY19), as well as one no RT control for each biological replicate were included and no amplification was observed. All hmlα1Δ::CRE strains are MATα hmrΔ to prevent formation of the a1-α2 repressor, as described above. The hmlα2Δ::CRE and no CRE strains are all MATa (no diploid repression).
Fig. 2.
Fig. 2.
The Cre And Mating Efficiency Reporting of Asynchronous Silencing (CAMERAS) assay revealed independent silencing loss within the HML locus. a) Schematic of the CAMERAS assay. This assay is built upon the CRASH assay (detects short-lived transcription of the CRE gene replacing either HMLα1 or HMLα2, see Fig. 1a) to which we added a mating assay that utilized the other α gene left at HML as a reporter for whether silencing of the entire HML locus is lost, or whether only silencing of the CRE gene is lost. A nonfluorescent haploid WT MATa strain (top line) is allowed to mate with a MATα2 matα1Δ::NatMX hmlα2Δ::CRE HMLα1 haploid CRASH strain (middle line). In this case, mating would be possible only if HMLα1 were expressed. Diploids are selected by complementing auxotrophies. If hmlα2Δ::CRE were also expressed, the resulting diploids will be green. If the diploids are red, HMLα1 was expressed while hmlα2Δ::CRE remained silent. As a complement we also mated the haploid WT MATa strain (top line) to a MATα1 matα2Δ::NatMX hmlα1Δ::CRE HMLα2 haploid CRASH strain (bottom line). In this case, we tested whether HMLα2 could be expressed while hmlα1Δ::CRE remains silent. The total number of colonies obtained after selection reflected mating efficiency, whereas the silencing retention was reflected by the proportion of red colonies. b) Images of diploid selection plates of the CAMERAS assay. In the top row, WT MATa (JRY19) strain was mated to hmlα1Δ::CRE CRASH strains. Positive control: MATα WT (JRY14192), test strain: matα2Δ::NatMX (JRY14312), negative control: matα2Δ::NatMX hmlα2Δ* (JRY14388). In the bottom row, WT MATa (JRY19) strain was mated to hmlα2Δ::CRE CRASH strains. Positive control: MATα WT (JRY14123), test strain: matα1Δ::NatMX (JRY14126), negative control: matα1Δ::NatMX hmlα1Δ* (JRY14145). Haploid strains were allowed to mate on YPD first and were replica-plated on selection media after 24 hours at 30°C (see Materials and methods and Supplementary Figure 2A). For all images, the same concentrations of MATa and MATα cells were spread on YPD plates prior to mating. The colonies in the images all diploids selected for from the matings. c) Mating efficiency for the CAMERAS assay. The total number of diploid colonies on the selection plate was normalized to the concentration of cells plated to obtain a colony-forming unit concentration (see methods). This number is to be compared to the 106 haploid cells of each mating type that are plated on the YPD plate (before mating and selection). Strains were the same as in b. d) Asymmetric silencing retention for the genes at HML. On the diploid selection plate, the proportion of red colonies is a direct measurement of silencing lost at one of the α genes for mating but retained on the other gene to prevent CRE expression. Strains were the same as in b (plates with negative control strains did not have enough colonies to show on the plot). For c and d: We excluded colonies that lost their matα2Δ::NatMX mutation through recombination (they became Nat sensitive, determined after replica-plating on Nat plates). Bar graphs and error bars show mean ± SD. Each dot is a biological replicate.
Fig. 3.
Fig. 3.
Imaging of dual fluorescent reporters at HML. a) Schematic of the HML dual fluorescent reporters. On the left GFP (yomEGFP) and RFP (yEmRFP) replaced the α1 and α2 genes, respectively at HML, and vice versa on the right. b) Fluorescent micrographs of representative colonies of control strains with only one reporter at HMLα2. Strains are hmlα2Δ::RFP (WT: JRY14573, sir1Δ: JRY14574, sir4Δ: JRY14575) and hmlα2Δ::GFP (WT: JRY14398, sir1Δ: JRY14395, sir4Δ: JRY14399). c) Fluorescent micrographs of representative colonies of strains with dual fluorescent reporters at HML with hmlα1Δ::GFP hmlα2Δ::RFP (WT: JRY14261, sir1Δ: JRY14257, sir3Δ: JRY14346) and hmlα1Δ::RFP hmlα2Δ::GFP (WT: JRY14453, sir1Δ: JRY14445, sir4Δ: JRY14455). For b and c: All strains were MATa HMR. Images were acquired at a depth of 8 bit, the [min, max] values displayed for the GFP and RFP channels are [60,230] and [15,140], respectively. We cropped squares of length 850 pixels, scale bar is 1 mm.
Fig. 4.
Fig. 4.
Simultaneous fluorescent reporting of the two HML loci states in sir1Δ diploid cells. All strains were sir1Δ (haploids) or sir1Δ/sir1Δ (diploid). a) Schematic of the assay: we placed two different fluorescent reporters on each copy of HML in a diploid strain with a sir1Δ homozygous deletion. Specifically, reporters are hmlα2Δ::GFP and hmlα2Δ::RFP. b) Fluorescent micrographs of a colony of the strain described in a. Strain: MATa/matΔ sir1Δ/sir1Δ hmlα2Δ::GFP/hmlα2Δ::RFP (JRY14475). The MATa/matΔ genotype prevented the a1-α2 diploid repression of α genes at HML. Scale bar is 1 mm. c) Flow cytometry fluorescence measurements. Strains from left to right: hmlα2Δ::GFP sir1Δ (JRY14395), hmlα2Δ::RFP sir1Δ (JRY14401), and sir1Δ/sir1Δ hmlα2Δ::GFP/hmlα2Δ::RFP (JRY14475). Top: fluorescence pseudocolor plots (all biological replicates were pooled). A quadrant gate was drawn according to the lowest points in density. Bottom: histograms showing the distribution in fluorescence intensities for each biological replicate for both GFP and RFP channels. Percentages of cells in repressed and expressed states are reported for bistable populations. Distributions are normalized to the total number of events for each replicate. Axes feature a biexponential scale.
Fig. 5.
Fig. 5.
Silencing vs repression for blocking gene expression a) Schematic of the CRASH assay used to probe the repression of the hmlα1Δ::CRE gene by the a1-α2 complex. b) Difference in silencing loss between strains subject to the a1-α2 repressor at HML (MATa hmrΔ sir4Δ: JRY14221) or not (MATα hmrΔ sir4Δ: JRY14216). Control wild-type (SIR+) strains with active Sir silencing are shown (MATa hmrΔ SIR4: JRY14190, MATα hmrΔ SIR4: JRY14192). Top: Flow cytometry quantification of an apparent silencing loss rate (see Materials and methods for calculation) using the CRASH assay. Bar graphs and error bars show means ± SD. A silencing loss rate could not be calculated for the constitutively expressed sir4Δ strain as all cells were green. Bottom: Fluorescent micrographs of representative colonies. Images were acquired at a depth of 8 bit. The [min, max] gray values displayed for the RFP channel are [5,140] ; for the GFP channels they are [5,70] for WT and [5,150] for sir4Δ. Images were cropped as squares of width 850 pixels. Scale bar is 1 mm.

References

    1. Benaglia T, Chauveau D, Hunter DR, Young DS. Mixtools: an R package for analyzing mixture models. J Stat Softw. 2009;32(6):1–29. doi:10.18637/jss.v032.i06. - DOI
    1. Bender A, Sprague GF. Pheromones and pheromone receptors are the primary determinants of mating specificity in the yeast Saccharomyces cerevisiae. Genetics. 1989;121(3):463–476. doi:10.1093/genetics/121.3.463. - DOI - PMC - PubMed
    1. Bergh D. Sample size and chi-squared test of fit—a comparison between a random sample approach and a chi-square value adjustment method using Swedish adolescent data. In: Zhang Q, Yang H, editors. Pacific Rim Objective Measurement Symposium (PROMS) 2014 Conference Proceedings. Berlin (Germany: ): Springer; 2015. p. 197–211.
    1. Brothers M, Rine J. Mutations in the PCNA DNA polymerase clamp of Saccharomyces cerevisiae reveal complexities of the cell cycle and ploidy on heterochromatin assembly. Genetics. 2019;213(2):449–463. doi:10.1534/genetics.119.302452. - DOI - PMC - PubMed
    1. Brothers M, Rine J. Distinguishing between recruitment and spread of silent chromatin structures in Saccharomyces cerevisiae, (W. Dang, and J. K. Tyler, eds.). eLife. 2022;11:e75653. doi:10.7554/eLife.75653. - DOI - PMC - PubMed

Publication types

MeSH terms

Substances