. 2023 Feb:84:102696.
doi: 10.1016/j.media.2022.102696. Epub 2022 Nov 21.

Optimal transport features for morphometric population analysis

Affiliations

Optimal transport features for morphometric population analysis

Samuel Gerber et al. Med Image Anal. 2023 Feb.

Abstract

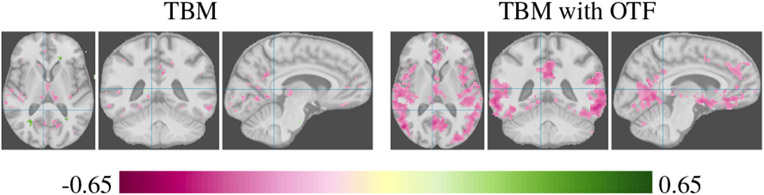
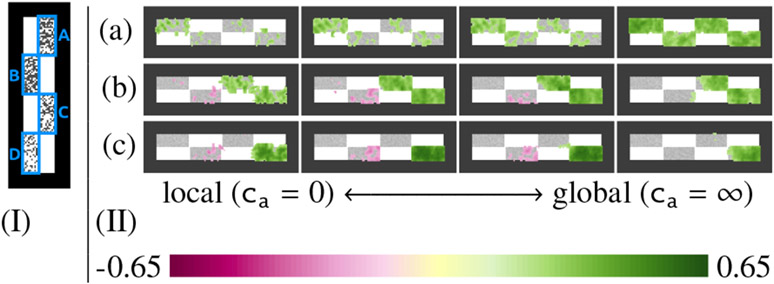
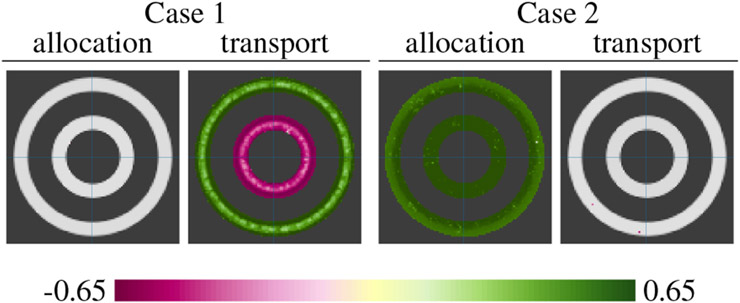
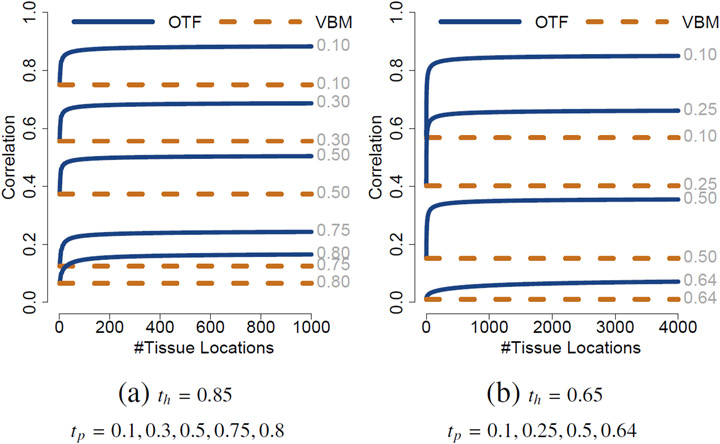
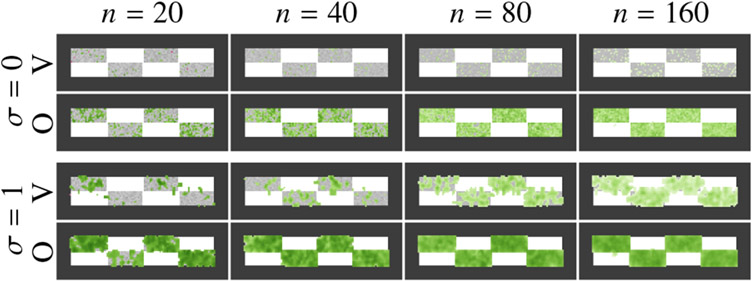
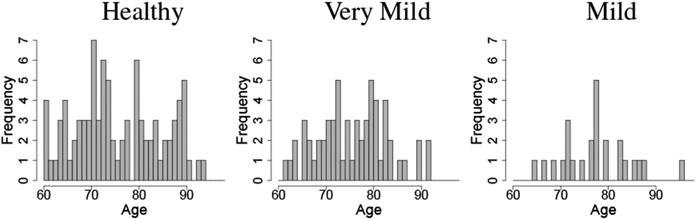
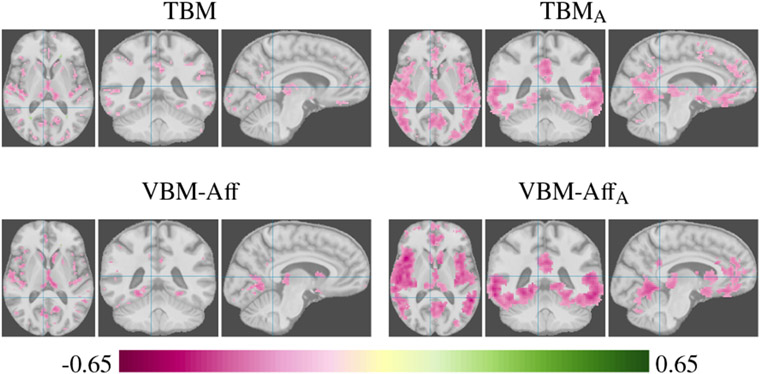
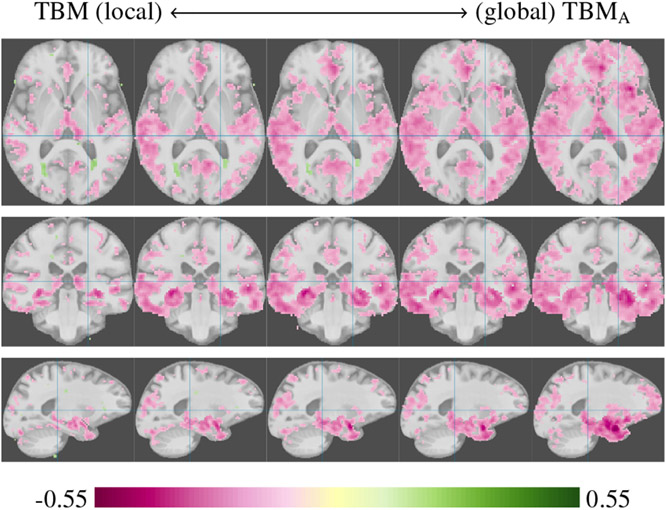
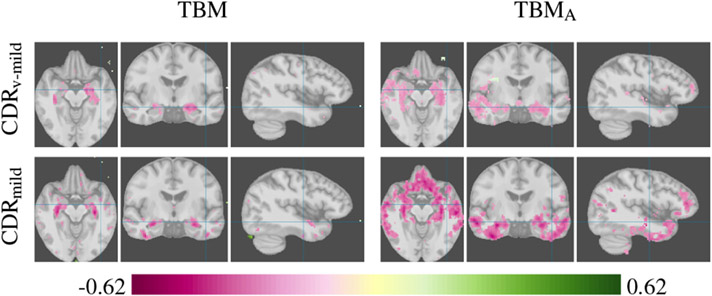
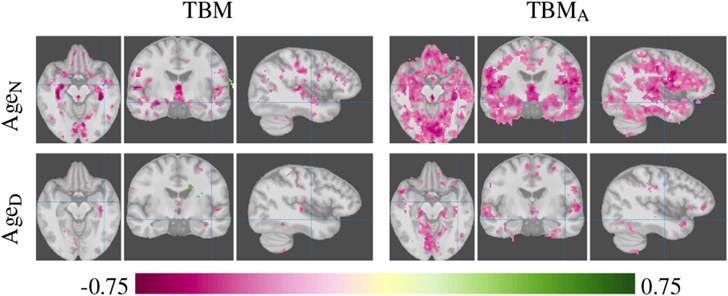
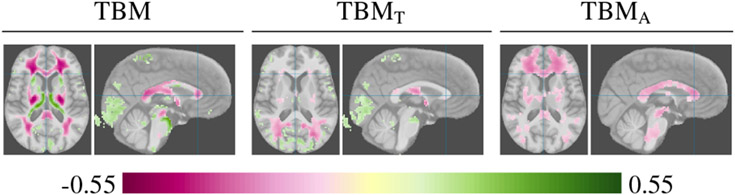
Brain pathologies often manifest as partial or complete loss of tissue. The goal of many neuroimaging studies is to capture the location and amount of tissue changes with respect to a clinical variable of interest, such as disease progression. Morphometric analysis approaches capture local differences in the distribution of tissue or other quantities of interest in relation to a clinical variable. We propose to augment morphometric analysis with an additional feature extraction step based on unbalanced optimal transport. The optimal transport feature extraction step increases statistical power for pathologies that cause spatially dispersed tissue loss, minimizes sensitivity to shifts due to spatial misalignment or differences in brain topology, and separates changes due to volume differences from changes due to tissue location. We demonstrate the proposed optimal transport feature extraction step in the context of a volumetric morphometric analysis of the OASIS-1 study for Alzheimer's disease. The results demonstrate that the proposed approach can identify tissue changes and differences that are not otherwise measurable.

Keywords: MRI; Morphometry; Optimal transport; Optimization; Population analysis.


Conflict of interest statement

Declaration of Competing Interest The authors declare that they have no known competing financial interests or personal relationships that could have appeared to influence the work reported in this paper.

Figures

Fig. 1.
Fig. 1.
Tensor-based morphometric analysis of gray matter tissue without and with the optimal transport feature extraction step. The pink color shows inverse correlation strength of gray matter between patients with mild dementia compared to normal aging controls for voxels with Bonferroni corrected p < 0.05. The optimal transport feature extraction improves the statistical power and shows regions of gray matter tissue loss associated with mild dementia that are not identified with a standard TBM analysis (more details of the analysis are in Section 5).
Fig. 2.
Fig. 2.
A toy example simulating tissue deterioration to illustrate the behaviour of the continuum from local to global mass-balancing. (I) Input image example; each of the regions (A,B,C,D) has various random amounts of white pixels removed, representing tissue deterioration. (II) Suppose that there is a disease (a) corresponding to tissue loss in regions A+B+C+D, a disease (b) corresponding to tissue loss in regions C+D, and a disease (c) corresponding to tissue loss in region D. Here we display the correlation of each disease with the mass allocation OTF at each voxel, and we do this for various choices of ca. The results illustrate that global mass-balancing leads to stronger correlations compared to local mass-balancing for tissue loss over a large region. However, if only a local region is affected as in (c) and there is confounding (i.e. uncorrelated) tissue loss in other regions, the correlation strength decreases compared to the more local approaches.
Fig. 3.
Fig. 3.
Correlation to allocation and transport features in two cases on a toy example. In Case 1, each sample image has the same overall mass, but the mass is differently distributed among the two annuli. Color shows correlation between the total mass of the outer annulus and the OTF (mass allocation and transport cost) at each pixel. We see that OTF correctly identified that the effect is due to a trade-off in mass between the inner and outer annuli, and not due to random variation of total mass. There is a statistically significant correlation to transport, but not to allocation. In Case 2, each sample image has a random overall mass which is randomly distributed between the two annuli. Color shows correlation between the total mass of both annuli and the OTF at each pixel. We see that OTF correctly identified the overall difference in mass.
Fig. 4.
Fig. 4.
Plots of the correlation strength for the analysis described in the text. Correlation as a function of the number of tissue locations with (a) th = 0.85 and (b) th = 0.65 and varying tp for p = 0.5. The OTF extraction step improves correlation for dispersed tissue loss: An increasing number of locations with tissue loss increases the correlation strength when using OTF.
Fig. 5.
Fig. 5.
Effects of smoothing and sample size on correlation of features to total mass. The sample images are generated as in Figure 2, and we look at two types of features: VBM (V), which considers voxel intensities, and OTF (O) which produces a mass allocation image out of a solution to the unbalanced optimal transport problem. The correlation strength is indicated in green at locations with statistical significance p < 0.05. VBM requires a large amount of smoothing (σ) and more samples (n) to find statistically significant correlations and results in weaker correlations than OTF with less smoothing and fewer samples. However, OTF with large smoothing can result in a loss of spatial resolution, which leads to the inclusion of large amounts of healthy tissue.
Fig. 6.
Fig. 6.
Histogram of ages per CDR group of the OASIS-1 data.
Fig. 7.
Fig. 7.
TBM and VBM analysis of gray matter tissue without and with the optimal transport feature extraction step. The color shows inverse correlation strength (pink) to clinical dementia rating for voxels with Bonferroni corrected p < 0.05.
Fig. 8.
Fig. 8.
Inverse correlations of gray matter to CDR, illustrating the continuum from TBM analysis to TBMA with global mass balancing. From left to right the cost of allocating mass is increased, causing a more global mass balancing to be enforced. The global TBMA analysis can mask local effects if there is no overall difference in tissue loss between the populations. Performing the analysis at different spatial scales improves the odds of discovering local and global effects.
Fig. 9.
Fig. 9.
Axial, coronal, and sagittal slices show the inverse correlation of gray matter tissue to very mild (CDRv-mild) and mild dementia (CDRmild).
Fig. 10.
Fig. 10.
Axial, coronal, and sagittal slices show the inverse correlation of gray matter tissue to age that is associated to normal aging (AgeN) and to age within the dementia group (AgeD).
Fig. 11.
Fig. 11.
Axial and coronal slices displaying the results of TBM, transport cost (TBMT), and mass allocation (TBMA) analysis of white matter with respect to Age. TBMT indicates that some of the correlations in TBM, in particular the correlations around the ventricles and in the posterior, are potentially caused by differences in tissue locations between the populations and not changes in tissue amounts.

References

    1. Ahuja RK, Magnanti TL, Orlin JB, 1993. Network Flows: Theory, Algorithms, and Applications. Prentice-Hall, Inc., Upper Saddle River, NJ, USA.
    1. Anderes E, Borgwardt S, Miller J, 2016. Discrete wasserstein barycenters: Optimal transport for discrete data. Mathematical Methods of Operations Research 84, 389–409.
    1. Ashburner J, 2007. A fast diffeomorphic image registration algorithm. Neuroimage 38, 95–113. - PubMed
    1. Ashburner J, Friston KJ, 2000. Voxel-based morphometry—the methods. Neuroimage 11, 805–821. - PubMed
    1. Ashburner J, Hutton C, Frackowiak R, Johnsrude I, Price C, Friston K, et al., 1998. Identifying global anatomical differences: deformation-based morphometry. Human brain mapping 6, 348–357. - PMC - PubMed

Publication types