. 2022 Nov-Dec;15(6):1552-1564.
doi: 10.1016/j.brs.2022.12.003. Epub 2022 Dec 7.

Differential dose responses of transcranial focused ultrasound at brain regions indicate causal interactions

Affiliations

Differential dose responses of transcranial focused ultrasound at brain regions indicate causal interactions

Pai-Feng Yang et al. Brain Stimul. 2022 Nov-Dec.

Abstract

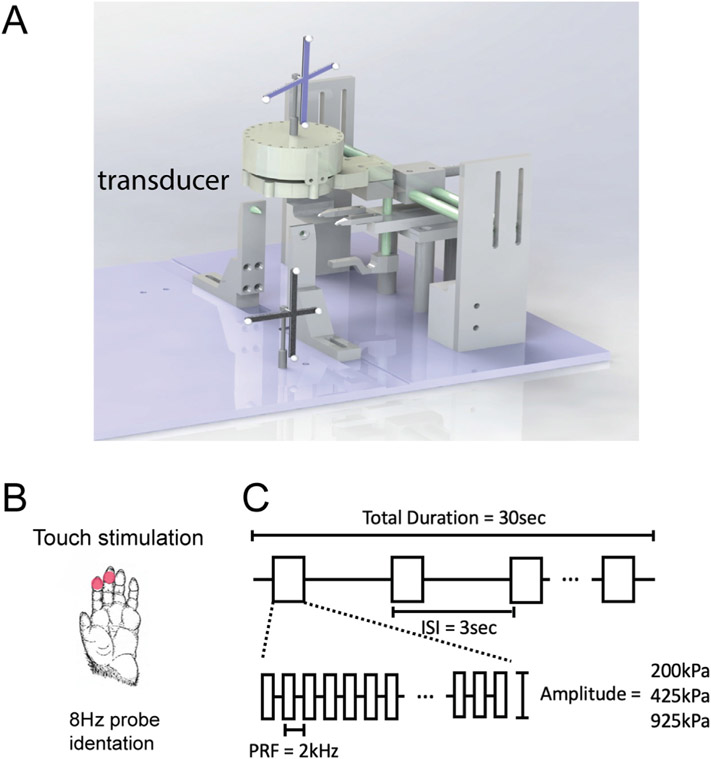
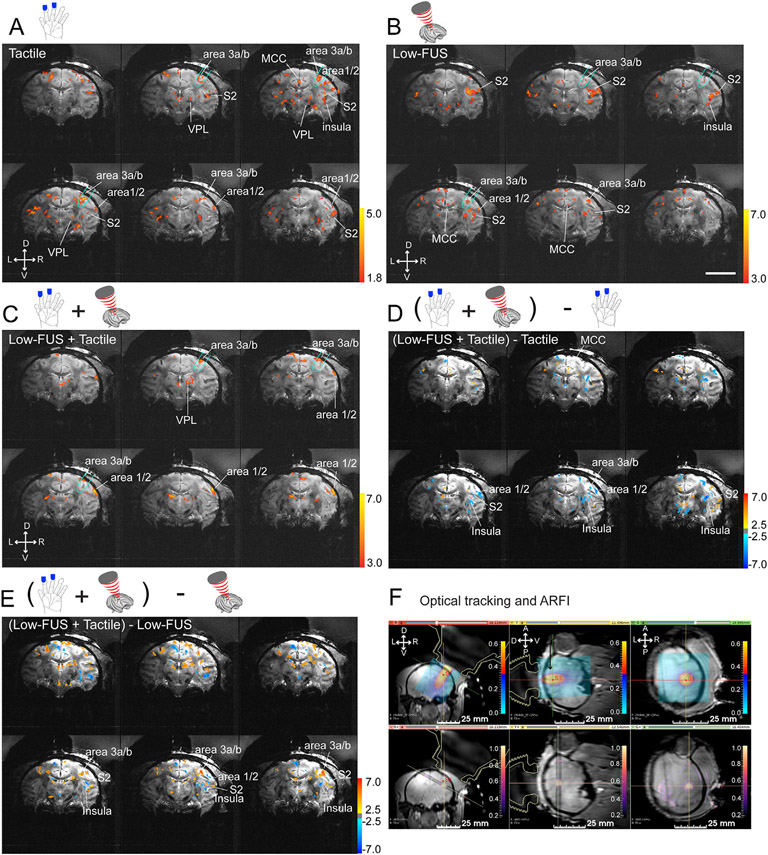
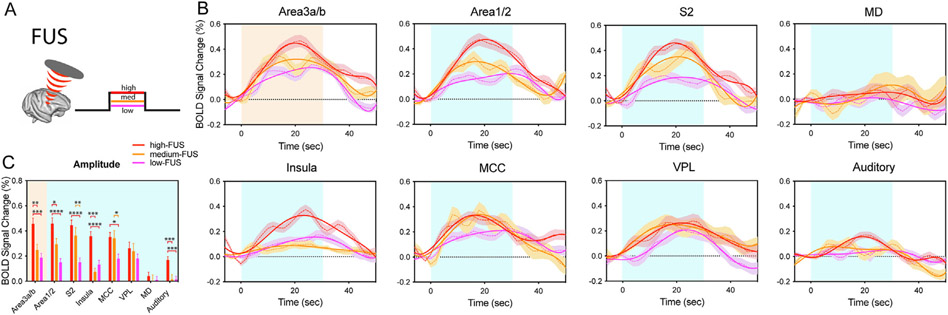
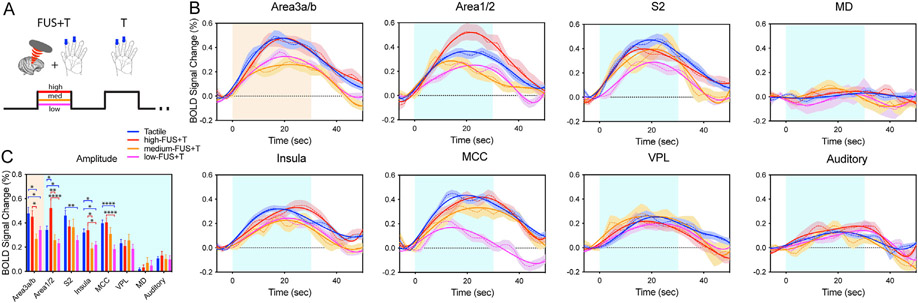
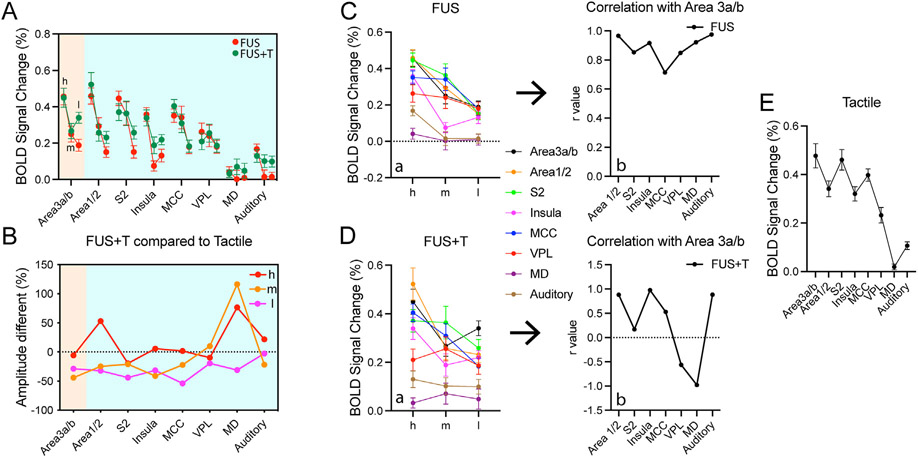
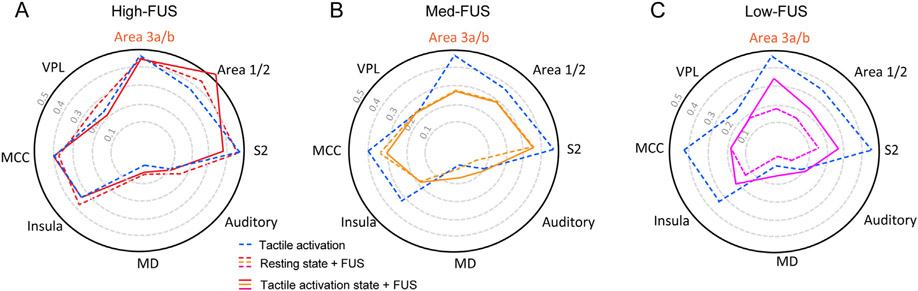
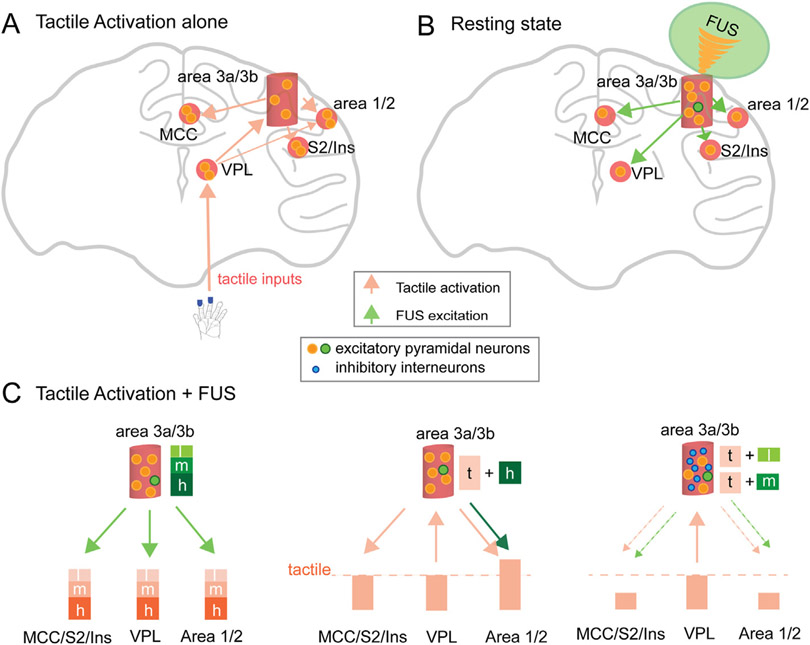
We have previously shown that focused ultrasound (FUS) pulses in low pressure range exerted bidirectional and brain state-dependent neuromodulation in the nonhuman primate somatosensory cortices by fMRI. Here we aim to gain insights about the proposed neuron selective modulation of FUS and probe feedforward versus feedback interactions by simultaneously quantifying the stimulus (FUS pressures: 925, 425, 250 kPa) and response (% BOLD fMRI changes) function at the targeted area 3a/3b and off-target cortical areas at 7T. In resting-state, lowered intensities of FUS resulted in decreased fMRI signal changes at the target area 3a/3b and off-target area 1/2, S2, MCC, insula and auditory cortex, and no signal difference in thalamic VPL and MD nuclei. In activated states, concurrent high-intensity FUS significantly enhanced touch-evoked signals in area 1/2. Medium- and low-intensity FUS significantly suppressed touch-evoked BOLD signals in all areas except in the auditory cortex, VPL and MD thalamic nuclei. Distinct state dependent and dose-response curves led us to hypothesize that FUS's neuromodulatory effects may be mediated through preferential activation of different populations of neurons. Area 3a/3b may have distinct causal feedforward and feedback interactions with Area 1/2, S2, MCC, insula, and VPL. FUS offers a noninvasive neural stimulation tool for dissecting brain circuits and probing causal functional connections.

Keywords: Brain circuit; Hand; Neuromodulation; Primates; Somatosensory; Transcranial focused ultrasound; fMRI.


Conflict of interest statement

Declaration of competing interest The authors declare no competing interests.

Figures

Fig. 1.
Fig. 1.. MRgFUS neuromodulation experimental setup.
(A) A single FUS transducer was placed over the somatosensory area (3a/3b) hand region. (B) locations of tactile stimulation. (C) FUS pulse parameters. Three intensities of FUS pluses were delivered: 200 kPa (low), 425 kPa (medium), and 925 kPa (high). Ultrasound stimulation blocks were 30 s total with an inter-stimulation interval (ISI) of 3 s and a burst length of 300 ms. Each burst consisted of a 2 kHz pulse repetition frequency with a 250 us sonication for a 50% duty cycle.
Fig. 2.
Fig. 2.. Concurrent sonication of areas 3a/3b with low-amplitude FUS pulses suppresses tactile stimulus-evoked fMRI BOLD activations in the brain of a macaque monkey.
(A) Multi-run coronal fMRI activation maps evoked by 8 Hz vibrotactile stimulation of the distal finger pads of digits 2 & 3 of the left hand. Activation maps are shown with thresholds t > 1.8, p = 0.01, q = 0.003, FDR (p < 0.05) corrected. Six coronal images are arranged from caudal to rostral direction (top left to bottom right). Aqua outlines indicate the FUS beam location. (B–C) Multi-run coronal fMRI activation maps evoked by low amplitude FUS alone (B) or with concurrent delivery of tactile stimulation (C) of the areas 3a/3b region of the right hemisphere. Activation maps are shown with thresholds t > 3.0, p = 0.001, q = 0.003, FDR (p < 0.05) corrected. (D) fMRI subtraction maps of tactile stimulation plus low amplitude FUS minus tactile stimulation. (E) fMRI subtraction maps of tactile stimulation plus low amplitude FUS minus low amplitude FUS. (F) Coronal (left), sagittal (middle) and oblique (right – perpendicular to the FUS beam) T1w images show optical tracking (top row) and MR-ARFI maps (bottom row, color scale bar: tissue displacement in mm) fMRI subtraction maps of tactile stimulation plus medium amplitude FUS minus tactile stimulation. VPL: thalamic ventro-posterior lateral nucleus. Scale bar: 20 mm. D: dorsal. V: ventral. L: left. R: right. A: anterior. P: posterior.
Fig. 3.
Fig. 3.. FUS intensity-dependent BOLD fMRI signal changes at the target and off-target regions.
(A) schematic illustration of the interleaved FUS and tactile stimulus presentation paradigm. Only one FUS intensity was presented in each fMRI run. (B) Dotted lines: mean time courses of % BOLD signal changes at the FUS-targeted area 3a/3b, and five off-target regions: area 1/2, secondary somatosensory cortex (S2), Insular cortex (insula), middle cingulate cortex (MCC), auditory cortex, and thalamic VPL and MD nuclei. Color shadow indicates +/− standard error of the mean. Solid lines: two gamma fitting curves of raw time course. Light orange and blue backgrounds indicate the 30-second duration of stimulation. (C) Bar plots of peak BOLD signal changes during tactile and FUS stimulation at three intensities shown for the target and off-target ROIs. * p<0.05, **p<0.01, *** p<0.001, *** p<0.0001, where the analysis was comprised of a one-way ANOVA test followed by Tukey’s test for FUS intensity.
Fig. 4.
Fig. 4.. FUS intensity-dependent suppression of tactile stimulation-evoked BOLD fMRI signal changes at the target and off-target regions.
(A) Schematic illustration of the interleaved simultaneous FUS + tactile and tactile stimulus presentation paradigm. Only one FUS intensity was presented in each fMRI run. (B) Time courses of % BOLD signal changes at the FUS target area 3a/3b, and five off-target regions of area 1/2, S2, insula, MCC, auditory cortex, and thalamus VPL and MD nuclei. Light orange and blue backgrounds indicate the 30 s duration of stimulation. (C) Bar plots of peak BOLD signal changes during tactile and FUS stimulation at three intensities shown for the target (light orange section) and off-target ROIs (light blue section). *p < 0.05, **p < 0.01, ***p < 0.001, ***p < 0.0001, where the analysis comprised a one-way ANOVA test followed by Tukey's test.
Fig. 5.
Fig. 5.. Correlation of FUS dose – fMRI responses between target and off-target regions in resting and activation states.
(A) Plots of peak BOLD signal changes at the FUS-targeted area 3a/3b and seven off-target regions in response to FUS stimulation at three FUS intensities (h: high, m: medium, l: low) during FUS alone (red curves) and simultaneous FUS + Tactile (green curves) stimulation. (B) Plots of % BOLD signal differences between simultaneous FUS + tactile and tactile stimulation conditions (set as 100%) at each region. (C-D) Ca & Da: plots of BOLD signal changes at three FUS intensities across all regions at rest (Ca, FUS-alone condition) and activation (Da, FUS + tactile condition) states. Cb & Db: plots of correlation (r values) between area 3a/3b and each of the off-target regions. E: plots of % BOLD signal changes across all regions in response to tactile stimulation at left hand digits.
Fig. 6.
Fig. 6.. Modulatory effects of FUS intensities on tactile network organization.
Plots of peak BOLD signal changes at FUS target and seven selected off-target ROIs during high-FUS (A), med-FUS (B), and low-FUS (C) stimulation in both resting (dotted lines) and tactile activation (solid lines) states.
Fig. 7.
Fig. 7.. Schematic model of neuron type selective modulation of 250 kHz FUS.
FUS modulation of two types of neurons is proposed: excitatory pyramidal neurons (large orange and green dots) and inhibitory interneurons (small blue dots). (A) Tactile stimulation of digits elicited peripheral neuron activation that projected to the thalamic VPL nucleus, then to area 3a/3b, area 1/2, and then to MCC and S2/insula. Light orange arrows indicate the direction of information flow between regions. (B) FUS directly activates area 3a/3b neurons and then the activation propagates to off-target regions. (C) Illustrations showing the net outcomes of neural signal changes at three groups of off-target regions: area 1/2, MCC/S2/insula, and VPL, and their connections to area 3a/3b. Arrows indicate the directions of activation propagation. Line thickness indicates the general strength of information flow. The dotted line indicates the magnitude of tactile stimulation evoked activation. Each of the three brain region groups represents different degrees and patterns of feedforward and feedback connections (indicated by colored arrows and directions). (Left) Three intensities of FUS-evoked graded neural activity at the targeted area 3a/3b and off-target regions at resting state. (Middle) In the high-FUS + tactile stimulation condition, high-FUS may predominantly activate a larger proportion of excitatory neurons at area 3a/3b evidenced by the lack of inhibition at this target area. Therefore, tactile responses remained unchanged in all regions except for an enhanced response in area 1/2, which receives extensive feedforward connections from area 3a/3b. (Right) Medium- and low-intensity FUS likely activated more inhibitory than excitatory neurons, therefore reducing the output signals from area 3a/3b (middle). Areas that receive inputs from area 3a/3b via feedforward connections (area 1/2, MCC, S2, and Insula) all exhibited reduced tactile signals. Tactile-evoked neural activation signals at VPL were not affected because it is a signal feeding region to area 3a/3b via thalamocortical afferents. Signal reductions in area 3a/3b has little effect on VPL.

Similar articles

Cited by

References

    1. Assaf M, Jagannathan K, Calhoun VD, Miller L, Stevens MC, Sahl R, et al. Abnormal functional connectivity of default mode sub-networks in autism spectrum disorder patients. Neuroimage 2010;53(1):247–56. - PMC - PubMed
    1. Fingelkurts AA, Kahkonen S. Functional connectivity in the brain–is it an elusive concept? Neurosci Biobehav Rev 2005;28(8):827–36. - PubMed
    1. Fox MD, Halko MA, Eldaief MC, Pascual-Leone A. Measuring and manipulating brain connectivity with resting state functional connectivity magnetic resonance imaging (fcMRI) and transcranial magnetic stimulation (TMS). Neuroimage 2012;62(4):2232–43. - PMC - PubMed
    1. Naor O, Krupa S, Shoham S. Ultrasonic neuromodulation. J Neural Eng 2016;13(3):031003. - PubMed
    1. Blackmore J, Shrivastava S, Sallet J, Butler CR, Cleveland RO. Ultrasound neuromodulation: a review of results, mechanisms and safety. Ultrasound Med Biol 2019;45(7):1509–36. - PMC - PubMed

Publication types