. 2023 Aug;21(4):742-755.
doi: 10.1016/j.gpb.2022.12.002. Epub 2022 Dec 7.

m6A Profile Dynamics Indicates Regulation of Oyster Development by m6A-RNA Epitranscriptomes

Affiliations

m6A Profile Dynamics Indicates Regulation of Oyster Development by m6A-RNA Epitranscriptomes

Lorane Le Franc et al. Genomics Proteomics Bioinformatics. 2023 Aug.

Erratum in

Abstract

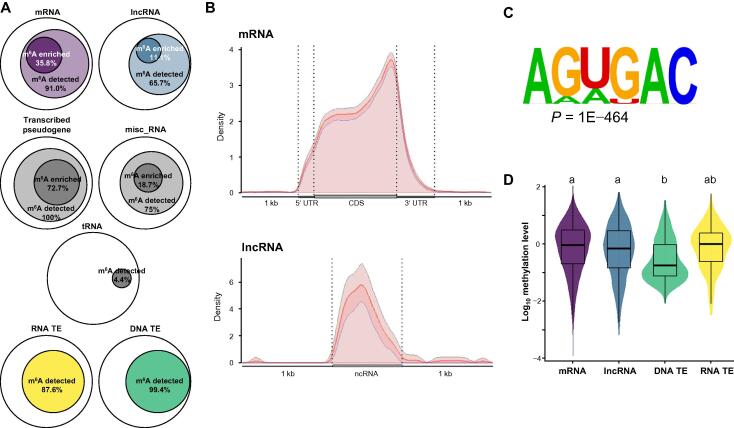
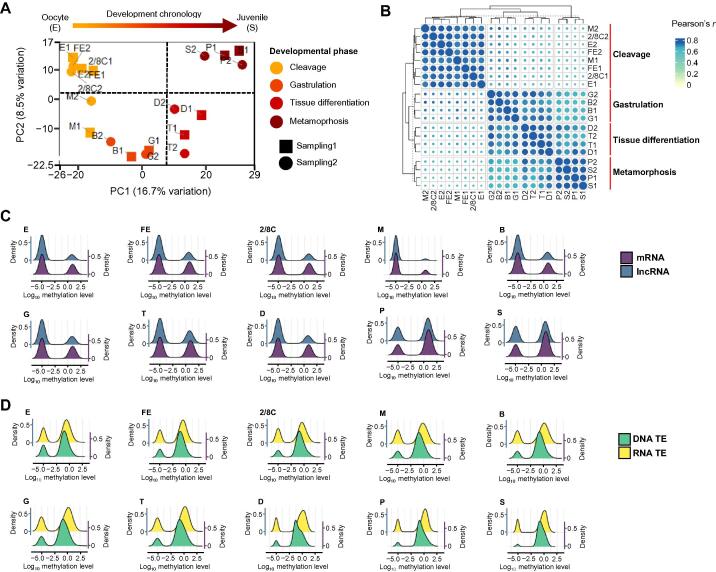
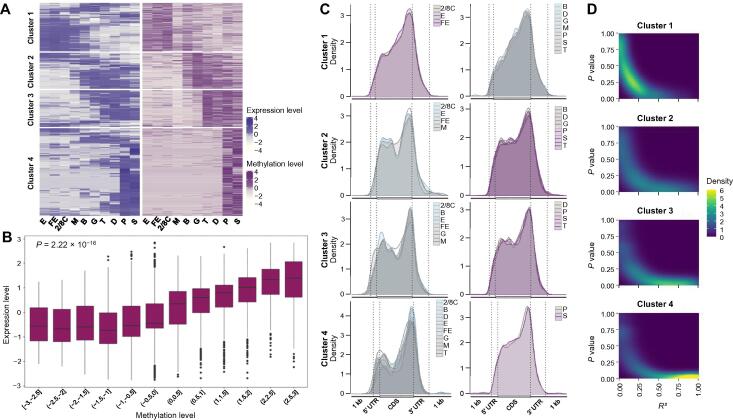
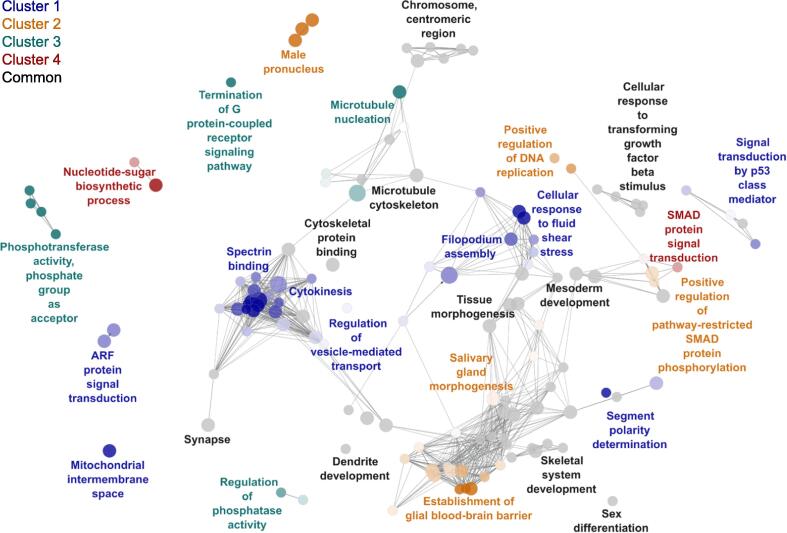
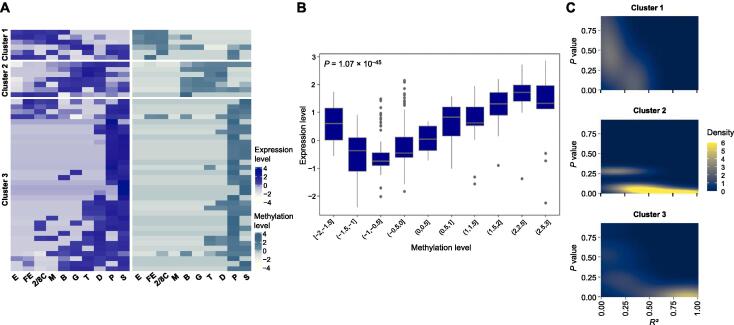
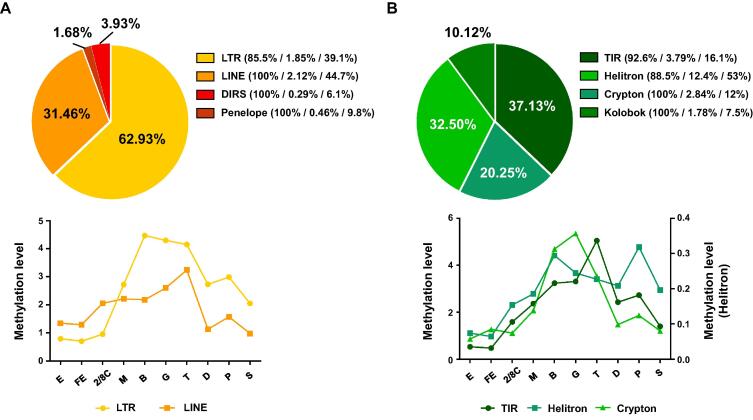
The N6-methylation of RNA adenosines (N6-methyladenosine, m6A) is an important regulator of gene expression with critical implications in vertebrate and insect development. However, the developmental significance of epitranscriptomes in lophotrochozoan organisms remains unknown. Using methylated RNA immunoprecipitation sequencing (MeRIP-seq), we generated transcriptome-wide m6A-RNA methylomes covering the entire development of the oyster from oocytes to juveniles. Oyster RNA classes display specific m6A signatures, with messenger RNAs (mRNAs) and long non-coding RNAs (lncRNAs) exhibiting distinct profiles and being highly methylated compared to transposable element (TE) transcripts. Epitranscriptomes are dynamic and correspond to the chronological steps of development (cleavage, gastrulation, organogenesis, and metamorphosis), with minimal mRNA and lncRNA methylation at the morula stage followed by a global increase. mRNA m6A levels are correlated with transcript levels, and shifts in methylation profiles correspond to expression kinetics. Differentially methylated transcripts cluster according to embryo-larval stages and bear the corresponding developmental functions (cell division, signal transduction, morphogenesis, and cell differentiation). The m6A level of TE transcripts is also regulated and peaks during the gastrulation. We demonstrate that m6A-RNA methylomes are dynamic and associated with gene expression regulation during oyster development. The putative epitranscriptome implication in the cleavage, maternal-to-zygotic transition, and cell differentiation in a lophotrochozoan model brings new insights into the control and evolution of developmental processes.

Keywords: Embryo; Evo-devo; Metamorphosis; RNA methylation; Transcription.


Conflict of interest statement

The authors have declared no competing interests.

Figures

Figure 1
Figure 1
m6A signatures of oyster RNA classes A. m6A distribution among RNA classes. Diagram diameter was normalized between RNA classes. The internal circles in diagrams represent the proportion of RNA displaying significant m6A methylation over background (light color) and significant m6A enrichment (dark color), respectively. B. m6A localization along mRNAs and lncRNAs (5′ to 3′). The mean m6A density and confidence interval are represented. C. Consensus sequence of the m6A motif in the oyster identified by HOMER. D. Mean methylation level of the methylated transcripts of mRNA, lncRNA, DNA TE, and RNA TE classes during oyster development. Letters discriminate significantly different methylation levels (ANOVA followed by Bonferroni’s post hoc test, P < 0.05). mRNA, messenger RNA; lncRNA, long non-coding RNA; DNA TE, DNA transposable element; RNA TE, retrotransposon; misc_RNA, miscellaneous RNA; tRNA, transfer RNA; ncRNA, non-coding RNA; ANOVA, analysis of variance; UTR, untranslated region; CDS, coding sequence; kb, kilobase.
Figure 2
Figure 2
Epitranscriptome dynamics during oyster development A. PCA of MeRIP-seq results. B. Similarity (pairwise Pearson’s correlation matrix) of m6A methylation between samples based on IP/Input signal (see Materials and methods). IP indicates the immunoprecipitated fraction, and Input indicates the input fraction. C. Dynamics of the m6A methylation level of the mRNA (purple) and lncRNA (blue) transcripts. All the transcripts found m6A-enriched over background using MetPeak in at least one development stage are represented. Areas under the curve are normalized for each RNA class, and undetectable methylation at certain stages was arbitrarily affected a value of −5 for representation purpose. D. Dynamics of the m6A methylation level of the DNA TE (green) and RNA TE (yellow) transcripts. All the transcripts found m6A-enriched over background using MetPeak in at least one development stage are represented. Areas under the curve are normalized for each RNA class, and undetectable methylation at certain stages was arbitrarily affected a value of −5 for representation purpose. E, egg (oocyte); FE, fertilized egg; 2/8C, 2-to-8-cell stage; M, morula; B, blastula; G, gastrula; T, trochophore; D, D-larva; P, pediveliger; S, spat/juvenile; PCA, principal component analysis; MeRIP-seq, methylated RNA immunoprecipitation sequencing; PC, principal component.
Figure 3
Figure 3
Dynamics of mRNA expression and m6A methylation during oyster development A. Normalized expression (TPM, purple) and m6A content (IP/Input, pink) of significantly differentially methylated mRNA genes during oyster development (n = 1494). The development stages are indicated below. B. Correlation between expression (Y-axis, TPM) and methylation (X-axis, IP/Input, divided into twelve quantiles). C. Methylation profiles of mRNAs displaying high (pink) or low (gray) expression within each cluster. The development stages in high and low expression groups are indicated (mean m6A density; confidence intervals were omitted for clarity). D. Correlation of expression vs. methylation dynamics throughout development. The linear correlation of the methylation variation vs. expression variation was assessed for each gene across oyster development per cluster and the results are given as surface plots (R2, X-axis; P value, Y-axis; density of genes, Z-axis). Yellow color in the right bottom corner (i.e., P < 0.05 and R2 > 0.5) indicates strong correlation. TPM, transcripts per million.
Figure 4
Figure 4
Functional annotation of differentially methylated mRNAs during oyster development Enriched GO terms (hypergeometric test, FDR < 0.05) associated with differential m6A mRNA methylation across oyster development. Enriched terms corresponding to specific clusters are colored, and common terms between clusters are in black. Color intensity is relative to cluster specificity, with color limit set to 51% of genes inside the respective clusters. Circle diameter is inversely proportional to the P value of the enrichment. GO, Gene Ontology; FDR, false discovery rate.
Figure 5
Figure 5
Dynamics of lncRNA expression and m6A methylation during oyster development A. Normalized expression (blue) and m6A content (turquoise) of significantly methylated lncRNA genes during oyster development. Transcript variants were pooled for each gene. B. Correlation between expression (Y-axis) and methylation (X-axis) levels. The methylation level was divided into ten quantiles. C. Correlation plot of expression vs. methylation dynamics throughout development. The linear correlation of the methylation vs. expression variation was assessed for each gene across oyster development per cluster, and the results are given as surface plots (R2, X-axis; P value, Y-axis; density of genes, Z-axis).
Figure 6
Figure 6
m6A dynamics of TE transcripts during oyster development A. m6A dynamics of RNA TE transcripts during oyster development. Top: relative representation of methylated RNA TE transcripts. The percentages in parenthesis indicate the proportion of transcripts methylated in the TE class, the initial proportion of the TE class in the genome, and the proportion of the TEs investigated, respectively. Bottom: relative representation of methylation level variation during oyster development. B. m6A dynamics of DNA TE transcripts during oyster development. Top: relative representation of methylated DNA TE transcripts. The percentages in parenthesis indicate the proportion of transcripts methylated in the TE class, the initial proportion of the TE class in the genome, and the proportion of the TEs investigated, respectively. Bottom: relative representation of methylation level variation during oyster development. Values are given as the mean of the two independent experiments. Only TEs representing more than 20% of their class are represented. Error bars were omitted for clarity. Reference methylation level is the mean methylation level of RNA TE or DNA TE in oocytes. LTR, long terminal repeat; LINE, long interspersed nuclear elements; TIR, terminal inverted repeat; DIRS, Dictyostelium intermediate repeat sequence.

Similar articles

Cited by

References

    1. Zhang M., Zhai Y., Zhang S., Dai X., Li Z. Roles of N6-methyladenosine (m6A) in stem cell fate decisions and early embryonic development in mammals. Front Cell Dev Biol. 2020;8:782. - PMC - PubMed
    1. Chang M., Lv H., Zhang W., Ma C., He X., Zhao S., et al. Region-specific RNA m6A methylation represents a new layer of control in the gene regulatory network in the mouse brain. Open Biol. 2017;7 - PMC - PubMed
    1. Coker H., Wei G., Moindrot B., Mohammed S., Nesterova T., Brockdorff N. The role of the Xist 5′ m6A region and RBM15 in X chromosome inactivation. Wellcome Open Res. 2020;5:31. - PMC - PubMed
    1. Patil D.P., Chen C.K., Pickering B.F., Chow A., Jackson C., Guttman M., et al. m6A RNA methylation promotes XIST-mediated transcriptional repression. Nature. 2016;537:369–373. - PMC - PubMed
    1. Zhao B.S., Wang X., Alana V., Lu Z., Shi H., Kuuspalu A., et al. m6A-dependent maternal mRNA clearance facilitates zebrafish maternal-to-zygotic transition. Nature. 2017;542:475–478. - PMC - PubMed

Publication types