. 2022 Dec 10;13(1):7637.
doi: 10.1038/s41467-022-35262-w.

Mitochondrial dysfunction induces ALK5-SMAD2-mediated hypovascularization and arteriovenous malformations in mouse retinas

Affiliations

Mitochondrial dysfunction induces ALK5-SMAD2-mediated hypovascularization and arteriovenous malformations in mouse retinas

Haifeng Zhang et al. Nat Commun. .

Abstract

Although mitochondrial activity is critical for angiogenesis, its mechanism is not entirely clear. Here we show that mice with endothelial deficiency of any one of the three nuclear genes encoding for mitochondrial proteins, transcriptional factor (TFAM), respiratory complex IV component (COX10), or redox protein thioredoxin 2 (TRX2), exhibit retarded retinal vessel growth and arteriovenous malformations (AVM). Single-cell RNA-seq analyses indicate that retinal ECs from the three mutant mice have increased TGFβ signaling and altered gene expressions associated with vascular maturation and extracellular matrix, correlating with vascular malformation and increased basement membrane thickening in microvesels of mutant retinas. Mechanistic studies suggest that mitochondrial dysfunction from Tfam, Cox10, or Trx2 depletion induces a mitochondrial localization and MAPKs-mediated phosphorylation of SMAD2, leading to enhanced ALK5-SMAD2 signaling. Importantly, pharmacological blockade of ALK5 signaling or genetic deficiency of SMAD2 prevented retinal vessel growth retardation and AVM in all three mutant mice. Our studies uncover a novel mechanism whereby mitochondrial dysfunction via the ALK5-SMAD2 signaling induces retinal vascular malformations, and have therapeutic values for the alleviation of angiogenesis-associated human retinal diseases.


Conflict of interest statement

The authors declare no competing interests.

Figures
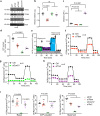
Fig. 1
Fig. 1. Distinct effects of Tfam, Cox10 and Trx2 silencing on mitochondrial function.
HUVECs were transfected with control, Tfam, Cox10 or Trx2 siRNAs. 48 h after transfection, cells were subjected to various assays. a Cell lysates were analyzed by Western blotting for TFAM, COX10 and TRX2 depletion with respective antibodies. Protein levels were quantified and presented as fold changes by taking control siRNA as 1.0. n = 3 (three independent experiments). b Mitochondrial DNA contents were quantitated by qPCR and presented as fold changes compared to control siRNA, n = 6 (duplicates from three independent experiments). c Mitochondrial ROS (mtROS) were assessed by a mitochondrial-specific ROS probe mitoSOX and fluorescence intensity was presented as arbitrary fluorescence unit (AFU). n = 6. d ATP production was measured and presented as mmol/cell, n = 6 (duplicates from three independent experiments). ei The oxygen consumption rate (OCR) measured by Seahorse. e A diagram for typical mitochondrial stress test profiles. The addition of the coupled respiration inhibitor oligomycin (1 μM) was used to assess ATP production and proton leak. Maximal respiration was measured by adding 1 μM carbonyl cyanide-4-(trifluoromethoxy) phenylhydrazone (FCCP), and spare respiratory capacity and non-mitochondrial respiration was measured by adding 0.5 μM rotenone and 0.5 μM antimycin A. fh OCR in siRNA-transfected HUVECs. i The basal, the ATP-coupled and the maximum oxygen consumption rate were calculated. n = 6 (Duplicates from three independent experiments). Data are means ± SEM. P values are indicated, using one-way ANOVA followed by Tukey’s multiple comparisons test. ns: non-significance (P > 0.05). Source data are provided as a Source Data file.
Fig. 2
Fig. 2. Mitochondrial activity is critical for EC sprouting in 3D sprouting models.
HUVECs were transfected with control, Tfam, Cox10 or Trx2 siRNAs. 48 h after transfection, cells were subjected to various assays. a, b EdU incorporation assays for EC proliferation. ECs were stained with anti-VE-cad with counterstaining by DAPI while EdU was detected by a Click-iT assay. % EdU+ ECs were quantified (b). 10 random fields were counted for each group. Data are duplicates from and three independent experiments. ce Cells were plated in fibronectin-coated Transwell filter and incubated for 4 h and 8 h. Migrated cells were visualized by crystal violet staining and quantified. 10 random fields were counted for each group. Data are duplicates from and three independent experiments. fh GFP-expressing HUVECs were transfected with control, Tfam, Cox10 or Trx2 siRNAs. 48 h after transfection, cells were applied to spheroid sprouting assays in the absence or presence of mito-TEMPO (10 μM). Quantification of the sprout number per spheroid (g) and mean sprout lengths (h) on day 7. 10 spheroids per sample were counted. Data are duplicates from and three independent experiments. I, k GFP-expressing HUVEC spheroids were cultured in the presence of rotenone (2.5 μM), antimycin (2.5 μM), oligomycin (5 μM) or menadione (1 μM). Quantification of the sprout number per spheroid (j) and mean sprout lengths (k) on day 7. 10 spheroids per sample were counted. Data are duplicates from and three independent experiments. Data are duplicates from and three independent experiments. Data are means ± SEM. P values are indicated, using one-way ANOVA followed by Tukey’s multiple comparisons test (b, d, e, j, k) or two-way ANOVA followed by Sidak’s multiple comparisons test (g, h). Scale bar: 10 μm (a); 50 μm (c, f, i). Source data are provided as a Source Data file.
Fig. 3
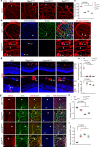
Fig. 3. Mitochondrial activity is critical for retinal sprouting in mice.
ac P6 retinas from WT, TfamECKO, Cox10ECKO and Trx2ECKO were subjected to whole-mount staining for IB4. a Different power images are shown. Arrows and arrowheads indicate normal and defective sprouts, respectively. bc Vascular progression (the distance of radial extension of the vascular plexus from the optic center) and number of sprouts was quantified. n = 6 mice per group. df Visualization of tip cells. P6 retinas were subjected to whole-mount staining for IB4 with ESM1. Arrows and arrowheads indicate normal and defective tip cells, respectively. ESM1+ Tip cell number (e) and relative vascular density (f) were quantified. n = 6 mice per group. gi WT, TfamECKO, Cox10ECKO and Trx2ECKO were received intraperitoneal injection of EdU (100 μg per gram of body weight). At 4 h, retinas were harvested and subjected to whole mount staining with ERG (red) with CD31 (blue) and EdU Click-iT assays (green). Arrows and arrowheads indicate EdU+ and EdU- EC, respectively. Total EdU+ERG+ cells (EdU+ EC) and EC proliferation index (EdU+ERG+/ERG+ ECs) were quantified (h, i). n = 6 mice per group. Data are means ± SEM. P values are indicated, using one-way ANOVA followed by Tukey’s multiple comparisons test. Scale bar: Three panels in (a) are indicated (500 μm, 100 μm and 20 μm, respectively). 100 μm (d, g top panel); 20 μm (g bottom panel). Source data are provided as a Source Data file.
Fig. 4
Fig. 4. TfamECKO, Cox10ECKO and Trx2ECKO retinas exhibit microaneurysm and arterialization at advanced ages.
ac P15 retinas from WT, TfamECKO, Cox10ECKO and Trx2ECKO treated with TAM at P1 were subjected to whole mount staining for CD31 (a). Vasculatures in three retinal layers (surface, intermediate and deep) were imaged by confocal microscopy analyses, and pseudo-colored by red, blue and green, respectively. WT had three layers of vasculature (unique vessels in each layer are indicated by arrows) while the mutant retinas had only the surface vessels with stalled diving vessels (arrowheads) (b). Vessel branch points were quantified (c). n = 6 mice per group. df Intraretinal vessels from GCL into intermediate IPL and deep INL/OPL layers were examined by CD31 staining of retina cross sections (d). Microaneurysm (e) and intraretinal vessels/section (f) were quantified. n = 6 mice per group. gi P15 retinas were subjected to whole mount co-staining with α-SMA, endomucin (EMCN) and CD31. Arrowheads and asterisks indicate normal α-SMA- microvessels in WT and α-SMA+ microvessels in the mutant retinas, respectively. A: artery/arterial; V: vein. Microvessel density (h) and α-SMA coverage (α-SMA:CD31) (i) were quantified by Image J. n = 6 mice per group. Data are means ± SEM. P values are indicated, using one-way ANOVA followed by Tukey’s multiple comparisons test. Scale bar: 50 μm (a, d); 25 μm (b); 100 μm (g). Source data are provided as a Source Data file.
Fig. 5
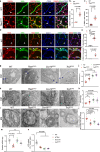
Fig. 5. High resolution images visualize mitochondrial abnormality in retinal microvessels of mutant mice.
ac P15 retinas were subjected to whole mount co-staining with α-SMA, endomucin (EMCN) and CD31. Arrowheads and arrows indicate normal α-SMA- microvessels in WT and α-SMA+ microvessels in the mutant retinas, respectively. A: artery/arterial. Capillary diameter (b) and % α-SMA coverage in total vessels (c) were quantified by Image J. df P15 retinas were subjected to whole mount co-staining with NG2, α-SMA and CD31 followed by imaging under STED microscope. Arrowheads and arrows indicate normal α-SMA-NG2+ microvessels in WT and α-SMA+NG2+ microvessels in the mutant retinas, respectively. α-SMA+CD31+ microvessels in the mutant retinas were indicated by asterisks. % α-SMA/NG2 overlap (e) and % α-SMA/CD31 overlap (f) were quantified by Image J. gl P15 retinas from WT and mutant mice were subjected to EM. gi Representative images of capillaries containing EC surrounded by pericyte (PC), basement membrane (BM) and mitochondria (M). L: capillary lumen. PC processes are indicated by white arrowheads. j Mean BM thickness, (k) Total mitochondrial number, (l) Cristae surface area/outer membrane surface area are quantified. 10 EM section per mouse. n = 6 mice per group. Data are means ± SEM. P values are indicated, using one-way ANOVA followed by Tukey’s multiple comparisons test. Scale bar: 25 μm (a); 10 μm (d); 2 μm (g); 1 μm (h); 150 nm (i). Source data are provided as a Source Data file.
Fig. 6
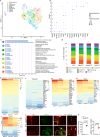
Fig. 6. Single-cell RNA-seq analyses reveal gene signatures in the mutant ECs.
a Uniform Manifold Approximation and Projection (UMAP) for single-cell transcriptomes in ECs from WT, TfamECKO, Cox10ECKO, and Trx2ECKO retinas colored accordingly to identified clusters. b Dotplots for specific marker genes in each cluster. c The representative GO pathways for each cluster. False discovery rate (FDR) was adjusted by p.adjust function in R with “method = ”BH”” parameter. d Percentage of cells for each cluster in WT and mutant retinas. Clusters 3, 4, and 5 in the mutant retinas were evidently altered compared to WT are indicated. e Heatmap of the log2 fold changes of the gene expression of the common differentially expressed genes (Common DEGs) (n = 138, adjusted p-value < 0.05) between each mutant and the WT. fi Heatmaps of the log2 fold changes of specific groups of genes (Transporters, ECM, and TGFβ signaling) from the 138 DEGs. n = 3 mice. Genes were considered significantly differentially expressed when the two-sided Wilcoxon Rank Sum test adjusted p-value, based on Bonferroni correction using the total number of genes in the dataset, was below 0.05. j, k Visualization of p-SMAD2. P15 TfamECKO retinas were subjected to whole mount co-staining with p-SMAD2 and CD31. j Low power images of vascular plexi at top and high-power images at bottom. Arrowheads and arrows indicate p-SMAD2- normal vessels in WT and p-SMAD2/3+ vessels in the mutant retinas, respectively. (k) SMAD2+ ECs and p-SMAD2+ microaneurysm were quantified. n = 6 mice per group. Data are means ± SEM. P values are indicated, using unpaired, two-tailed Student’s t test. Source data are provided as a Source Data file.
Fig. 7
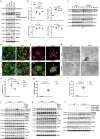
Fig. 7. Mitochondrial dysfunction augments TGFβ-ALK5-SMAD2 signaling.
HUVECs were transfected with control, Tfam, Cox10, or Trx2 siRNAs for 48 h. a Cell lysates were subjected to Western blotting with respective antibodies. Protein levels were quantified and presented as fold changes by taking control siRNA as 1.0. n = 3 (three independent experiments). b mRNA expression of Alk5, Tgfbr2, Smad1, and Smad2 was determined by qRT-PCR with specific primers. Relative mRNA levels were quantified and presented as fold changes by taking control siRNA as 1.0. n = 3 (three independent experiments). c Cells were treated with cycloheximide (10 μg/ml) for indicated times. Cell lysates were subjected to Western blotting with respective antibodies. Protein levels were quantified and presented as fold changes by taking control siRNA as 1.0. n = 3 (three independent experiments). d, e Cells were subjected to indirect immunofluorescence staining for SMAD2 or phosphor-SMAD2 and mitochondrial marker TOM20. Arrowheads and arrows (d) indicate SMAD2- and SMAD2+ nuclei, respectively. % nuclear SMAD2 was quantified (e). f Arrowheads and arrows indicate phosphor-SMAD2- and phosphor-SMAD2+ mitochondria, respectively. % phosphor-SMAD2+ mitochondria were quantified (g). n = 6 (duplicates from three independent experiments; 10 cells were counted for each biological sample). h, i Immuno-EM. HUVECs were transfected with control or Tfam siRNAs for 48 h and subjected to immunogold electron microscopy for TFAM and phosphor-SMAD2. Arrows and arrowheads indicate immunogold particles (5 nm) outside and inside mitochondria, respectively. %phosphor-SMAD2+ mitochondria were quantified (h). 10 EM section per sample. n = 3 per group. jl ECs were pre-treated with TGFβR1 inhibitors (5 μM each) for 60 min followed by treatment with TGF-β (10 ng/ml) for 30 min. l ECs were pre-treated with LY3214996 (ERK inhibitor), SP600125 (JNK inhibitor), SB203580 (p38 MAPK inhibitor) or GS444217 (ASK1 inhibitor) (5 μM each) for 2 h. Cell lysates were subjected to Western blotting with respective antibodies. Protein levels were quantified and presented as fold changes by taking control siRNA as 1.0. Ratios of p-SMAD2/SMAD2 and p-Akt/Akt are also presented. n = 3 (three independent experiments). Data are means ± SEM. P values are indicated, using one-way ANOVA followed by Tukey’s multiple comparisons test. Scale bar: 50 μm (d); 10 μm (f); 150 nm (h). Source data are provided as a Source Data file.
Fig. 8
Fig. 8. ALK5 inhibitor attenuates EC proliferation and the retarded vessel growth in TfamECKO retinas.
a A diagram for the ALK5 inhibitor protocols. WT and the mutant pups were received i.p. injection of vehicle or ALK5 inhibitor LY364947 compound at 5 μg/g body weight daily from P2-P6 (Protocol 1) or P2-P14 (Protocol 2). Mice were subjected to analyses at P7 or P15. b, c Retina lysates were subjected to Western blotting with respective antibodies. Protein levels were quantified and presented as fold changes by vehicle WT as 1.0. Ratios of p-SMAD2:SMAD2 are presented as a graph (c). Data presented from one of 3 mice per group. d, e P7 retinas were subjected to whole mount staining for CD31. Vascular progression (the distance of radial extension of the vascular plexus from the optic center) was quantified (e). n = 6 mice per group. f, h Vehicle or LY364947 treated WT and TfamECKO mice at P7 were injected with EdU (100 μg per gram of body weight). 4 h after i.p. injection of EdU, retinas were harvested and subjected to whole-mount staining with ERG (red) and CD31 (blue) followed by the EdU Click-iT assay (green). Arrows and arrowheads indicate EdU+ and EdU- EC, respectively. EC density (ERG+/mm2 retinal area) and EC proliferation (EdU+ERG+/total ERG+ ECs) were quantified by taking WT vehicle as 1.0 (g, h). n = 6 mice per group. Data are means ± SEM. P values are indicated, using one-way ANOVA followed by Tukey’s multiple comparisons test. Scale bar: 100 μm (b); 25 μm (d, g). Source data are provided as a Source Data file.
Fig. 9
Fig. 9. Smad2 genetic deficiency rescues the vascular malformation in TfamECKO mice.
Retinal tissues from WT, TfamECKO, Smad2ECKO and double knockout (DKO) mice were harvested at P15. ac Attenuation of arterialization and microaneurysm formation in the DKO retinas. Whole mount co-staining with α-SMA, endomucin (EMCN) and CD31. Arrowheads indicate normal or normalized vessels and arrows indicate microaneurysm in the mutant retinas. Asterisks indicate arterialized microvessels. α-SMA coverage (α-SMA/CD31 ratio) and vascular density were quantified. n = 6 mice per group. A: artery/arterial; V: vein. df Whole mount staining for CD31. Vasculatures in three retinal layers (surface, intermediate and deep) were imaged by confocal microscopy analyses, and pseudo-colored by red, blue and green, respectively. TfamECKO retinas had only the surface vessels with malformation and microaneurysms (arrows). Normal (WT and Smad2ECKO) or normalized capillaries in DKO are indicated by arrowheads. Vessel density and branch points were quantified. n = 6 mice per group. Data are means ± SEM. P values are indicated, using one-way ANOVA followed by Tukey’s multiple comparisons test. Scale bar: 50 μm (a); 25 μm (d). Source data are provided as a Source Data file.
Fig. 10
Fig. 10. A proposed model for TGFβ signaling mediates mitochondrial dysfunction-induced vascular malformation.
a A summary for mitochondrial dysfunction-induced vascular malformation. Normal retinal vessels begin to dive into the deep layers around P8 to form three layers of vascular network around P12-21 (the surface ganglier layer, the intermediate inner plexus layer and the deep outer plexus layer). Retinas in mice with an inducible deletion of Tfam, Cox10, or Trx2 exhibit retarded vessel growth without penetration into the deep plexi, and developed arteriovenous malformations (AVM) with microaneurysm formation. While tip EC retains a low level of TGFβ signaling with a high proliferation and migratory activity, the overactivated ALK5-SMAD2 signaling mediates both retarded vascular growth and malformations. Pharmacological blockade of ALK5 or genetic deletion of Smad2 prevent the retinal vascular malformation. b Mechanism for mitochondrial dysfunction-induced TGFβ signaling. We propose that that mitochondrial dysfunction induces activation of the MAPK pathway, leading to enhanced transcription of TGFβ signaling components (including TGFβ, ALK5 and SMAD2); increased TGFβ signaling can in turn attenuate mitochondrial function, forming feedback loop (see text for details).

References

    1. Potente, M., Gerhardt, H. & Carmeliet, P. Basic and therapeutic aspects of angiogenesis. Cell146, 873–887 (2011). - PubMed
    1. Herbert, S. P. & Stainier, D. Y. Molecular control of endothelial cell behaviour during blood vessel morphogenesis. Nat. Rev. Mol. Cell Biol.12, 551–564 (2011). - PMC - PubMed
    1. Adams, R. H. & Alitalo, K. Molecular regulation of angiogenesis and lymphangiogenesis. Nat. Rev. Mol. Cell Biol.8, 464–478 (2007). - PubMed
    1. Ferrara, N. & Kerbel, R. S. Angiogenesis as a therapeutic target. Nature438, 967–974 (2005). - PubMed
    1. Gilmour, D. F. Familial exudative vitreoretinopathy and related retinopathies. Eye (Lond.)29, 1–14 (2015). - PMC - PubMed

Publication types

MeSH terms