. 2022 Dec 10;13(1):7633.
doi: 10.1038/s41467-022-35335-w.

A brown fat-enriched adipokine Adissp controls adipose thermogenesis and glucose homeostasis

Affiliations

A brown fat-enriched adipokine Adissp controls adipose thermogenesis and glucose homeostasis

Qingbo Chen et al. Nat Commun. .

Abstract

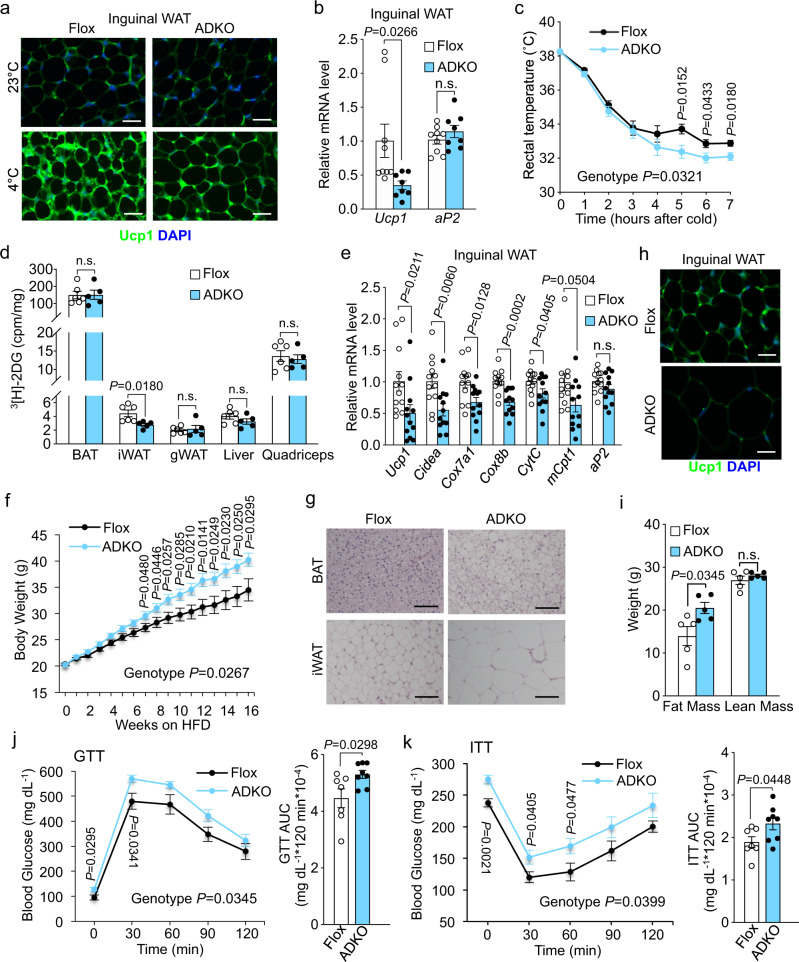
The signaling mechanisms underlying adipose thermogenesis have not been fully elucidated. Particularly, the involvement of adipokines that are selectively expressed in brown adipose tissue (BAT) and beige adipocytes remains to be investigated. Here we show that a previously uncharacterized adipokine (UPF0687 protein / human C20orf27 homolog) we named as Adissp (Adipose-secreted signaling protein) is a key regulator for white adipose tissue (WAT) thermogenesis and glucose homeostasis. Adissp expression is adipose-specific and highly BAT-enriched, and its secretion is stimulated by β3-adrenergic activation. Gain-of-functional studies collectively showed that secreted Adissp promotes WAT thermogenesis, improves glucose homeostasis, and protects against obesity. Adipose-specific Adissp knockout mice are defective in WAT browning, and are susceptible to high fat diet-induced obesity and hyperglycemia. Mechanistically, Adissp binds to a putative receptor on adipocyte surface and activates protein kinase A independently of β-adrenergic signaling. These results establish BAT-enriched Adissp as a major upstream signaling component in thermogenesis and offer a potential avenue for the treatment of obesity and diabetes.


Conflict of interest statement

The authors declare no competing interests.

Figures

Fig. 1
Fig. 1. Identification of Adipose-secreted signaling protein (Adissp).
a Strategies to identify brown adipocyte-secreted proteins. b Adissp-matched peptides identified by mass spectrometry are bold and underlined. c Adissp expression in wild-type (WT) mice tissues (n = 4). d Adissp expression in inguinal white adipose tissue (iWAT) from 2-month-old WT female mice administrated with PBS (n = 5) or CL-316,243 (CL) (n = 6). e Adissp expression in iWAT from WT mice housed at 22 °C (n = 5) or cold (4 °C) (n = 4) for 3 days from published data. f Adissp mRNA expression in BAT and iWAT from 3-month-old male ob/ob mice (n = 3) and lean controls (n = 5). g Human ADISSP expression in different tissues (Bone marrow, Heart, Small Intestine, Kidney and Spleen, n = 4; Adipose tissue, Liver and Stomach, n = 3; Lung and Colon, n = 5) from published data. h Expression of human ADISSP in subcutaneous adipocytes from lean (n = 10) and subjects with obesity (Men, n = 9; Women, n = 10) from published data. i Linear regression analysis of Body Mass Index (BMI) and ADISSP expression from adipose tissue of 770 men from published data. j Detection of secreted Adissp-Flag from brown adipocytes containing a Flag knock-in. k Detection of Adissp secretion from brown adipocytes. N.S., non-specific band. l, Detection of Adissp secretion from brown adipocytes treated with Brefeldin A and Monensin for 6 h. m Subcellular localization of Adissp in brown adipocytes treated with or without CL-316,243 for 45 min. Scale bar, 20μm. n Detection of Adissp secretion from brown adipocytes treated with CL-316,243 at indicated time intervals. o Detection of Adissp secretion from brown adipocytes treated with oligomycin or Carbonyl cyanide-4 (trifluoromethoxy) phenylhydrazone (FCCP) for 1 h or 3 h. In Fig. 1j–o, experiments were repeated twice independently with similar results. Data are mean ± s.e.m. P values were determined by two-tailed Student’s t test (d, e, f and h) or Linear regression analysis (i). Source data are provided as a Source Data file.
Fig. 2
Fig. 2. Targeted expression of Adissp enhances thermogenesis.
a Gene expression in iWAT from 2-month-old male Adissp transgenic (Tg) mice (n = 5) and littermate controls (n = 4). b Western blot of Ucp1 in iWAT from Adissp Tg mice and controls (n = 2 mice per group). c Representative images of hematoxylin and eosin (H&E) staining and Ucp1 immunofluorescence (IF) staining in iWAT from Adissp Tg mice (n = 3 mice per group). Scale bar, 200 μm. d Oxygen consumption rate in iWAT from another cohort of 2-month-old male Adissp Tg mice and littermate controls (n = 4 mice per group). e Rectal temperature of 4-month-old female Adissp Tg mice (n = 9) and littermate controls (n = 5) during cold exposure. f Glucose tolerant test (GTT) in 10-month-old male Adissp Tg mice and littermate controls on normal chow diet (n = 8 mice per group). g Body weight of male Adissp Tg mice (n = 8) and littermate controls (n = 5) on high-fat diet (HFD). h Fat mass of mice from (g) after 24 weeks of HFD feeding. i Fat mass and lean mass of a second cohort of mice after 16 weeks of HFD feeding (WT, n = 6; Tg, n = 7). j Representative images of H&E staining of iWAT and epididymal white adipose tissue (eWAT) from mice in (g) after 24 weeks of HFD feeding. Scale bar, 200 μm. k GTT in mice from (g) on 16 weeks of HFD. Data are mean ± s.e.m. P values were determined by two-tailed Student’s t test (a, d, h, i and AUC in f and k) and two-way repeated measures ANOVA with post hoc test by Fisher’s LSD test (e, f, g, and k), n.s. (not significant). Source data are provided as a Source Data file.
Fig. 3
Fig. 3. Adissp is required for iWAT browning and energy homeostasis.
a Representative images of Ucp1 immunofluorescence staining in iWAT from 3-month-old male Adissp adipose-specific knockout (ADKO) mice and Flox controls housed at room temperature and after 8 h cold exposure (n = 3 mice per group). Scale bar, 200 μm. b Gene expression analysis in iWAT from 5-month-old female Adissp ADKO mice (n = 8) and Flox controls (n = 9) after 7 h cold exposure. c Rectal temperature of mice from (b) during cold exposure. d Quantification of 3H-2DG uptake in indicated tissues from female Adissp ADKO mice (n = 5) and Flox controls (n = 6) after 3 h cold exposure. e Gene expression analysis in iWAT from 2 days CL-316,243 (1 mg/kg body weight) administrated 3-month-old female mice (n = 12 mice per group). f Body weight of male Adissp ADKO mice (n = 15) and Flox controls (n = 12) on HFD. g, h Representative images of H&E staining in BAT and iWAT (g) and Ucp1 immunofluorescence staining in iWAT (h) from mice in (f) on 21 weeks of HFD (n = 3 mice per group). Scale bar, 200 μm. i Fat mass and lean mass of a second cohort of mice after 16 weeks of HFD feeding (n = 5 mice per group). j, GTT in mice from (f) on 18 weeks of HFD (Flox, n = 7; ADKO, n = 8). k Insulin tolerant test (ITT) in mice from (f) on 19 weeks of HFD (Flox, n = 7; ADKO, n = 8). Data are mean ± s.e.m. P values were determined by two-tailed Student’s t test (b, d, e, i and AUC in j and k) and two-way repeated measures ANOVA with post hoc test by Fisher’s LSD test (c, f, j, and k), n.s. (not significant). Source data are provided as a Source Data file.
Fig. 4
Fig. 4. Endocrine action of Adissp.
a Detection of circulating ADISSP protein (n = 3 mice per group). b Representative images of H&E staining and Ucp1 immunofluorescence staining in iWAT from indicated adenovirus-injected mice (n = 3 mice per group). Scale bar, 200 μm. c mRNA expression of indicated genes in iWAT from adenovirus-injected mice (GFP, n = 5; Adissp, n = 6). d GTT in adenovirus-injected mice fasted for 5 h (GFP, n = 5; Adissp, n = 6). e Quantification of 3H-2DG uptake in indicated tissues from adenovirus-injected mice (GFP, n = 5; Adissp, n = 6) after 5 h fasting. f GTT in HFD-induced obese mice that were fasted overnight (GFP, n = 5; Adissp, n = 6). g Basal glucose of mice in (f) that were fasted for 5 h (GFP, n = 5; Adissp, n = 6). h Gene expression in iWAT from 3-month-old WT male mice intravenously injected with Adissp protein or vehicle once a day for 9 days (Vehicle, n = 10; Adissp, n = 9). i Representative images of Ucp1 immunofluorescence staining in iWAT from mice in (h) (n = 7 mice per group). Scale bar, 200 μm. j GTT in another cohort of 3-month-old WT male mice at day 7 of injection (n = 7 mice per group). Data are mean ± s.e.m. P values were determined by two-tailed Student’s t test (c, e, g, h and AUC in d, f, and j) and two-way repeated measures ANOVA with post hoc test by Fisher’s LSD test (d, f, and j), n.s. (not significant). Source data are provided as a Source Data file.
Fig. 5
Fig. 5. Adissp functions through PKA signaling.
a Gene expression in inguinal adipocytes that overexpressing Adissp and treated with β-blocker (100 nM) for 24 h (n = 3). b Ucp1 expression in iWAT from 2-month-old female Adissp Tg mice and WT controls after administrated with β-blocker (25 mg/kg body weight) for 7 days (WT, n = 5; WT + β-blocker, n = 6; Tg, n = 5; Tg+β-blocker, n = 5). c, d Gene expression in inguinal adipocytes overexpressing Adissp and treated with 30 μM H-89 dihydrochloride hydrate (H89) (GFP and GFP + H89, n = 6; Adissp and Adissp+H89, n = 5) for 2 h (c) or 1 μM Melittin (n = 3) for 24 h (d). e Western blot of phosphorylated protein kinase A (PKA) substrates and Hormone-sensitive lipase (HSL) in inguinal adipocytes transduced with indicated adenovirus. f Western blot of phosphorylated PKA substrates and HSL in iWAT from 3-month-old female Adissp ADKO mice and Flox controls after 3 h cold exposure. g cAMP levels in iWAT from 2-month-old male Adissp Tg mice (n = 8) and WT controls (n = 7). h cAMP levels in iWAT from mice in (f) (Flox, n = 8; ADKO, n = 6). i Western blot of phosphorylated PKA substrates and HSL in brown adipocytes treated with Adissp protein. j Binding of biotin-labeled Adissp to iWAT from WT mice housed at 23 °C or cold (4 °C) challenged for 8 h (n = 3 mice per group). Scale bar, 20 μm. k Binding of biotin-labeled Adissp to brown adipocyte surface. Scale bar, 20 μm. l Working model of Adissp. Data are mean ± s.e.m. P values were determined by two-tailed Student’s t test, n.s. (not significant). Source data are provided as a Source Data file.

References

    1. Collins S. beta-Adrenoceptor signaling networks in adipocytes for recruiting stored fat and energy expenditure. Front. Endocrinol. 2012;2:102. - PMC - PubMed
    1. Cannon B, Nedergaard J. Brown adipose tissue–function and physiological significance. Physiol. Rev. 2004;84:277–359. doi: 10.1152/physrev.00015.2003. - DOI - PubMed
    1. Harms M, Seale P. Brown and beige fat: development, function and therapeutic potential. Nat. Med. 2013;19:1252–1263. doi: 10.1038/nm.3361. - DOI - PubMed
    1. Rosen ED, Spiegelman BM. What we talk about when we talk about fat. Cell. 2014;156:20–44. doi: 10.1016/j.cell.2013.12.012. - DOI - PMC - PubMed
    1. Kajimura S, Spiegelman BM, Seale P. Brown and beige fat: physiological roles beyond heat generation. Cell Metab. 2015;22:546–559. doi: 10.1016/j.cmet.2015.09.007. - DOI - PMC - PubMed