. 2022 Dec 10;13(1):7634.
doi: 10.1038/s41467-022-35297-z.

Single-cell profiling of healthy human kidney reveals features of sex-based transcriptional programs and tissue-specific immunity

Affiliations

Single-cell profiling of healthy human kidney reveals features of sex-based transcriptional programs and tissue-specific immunity

Caitriona M McEvoy et al. Nat Commun. .

Abstract

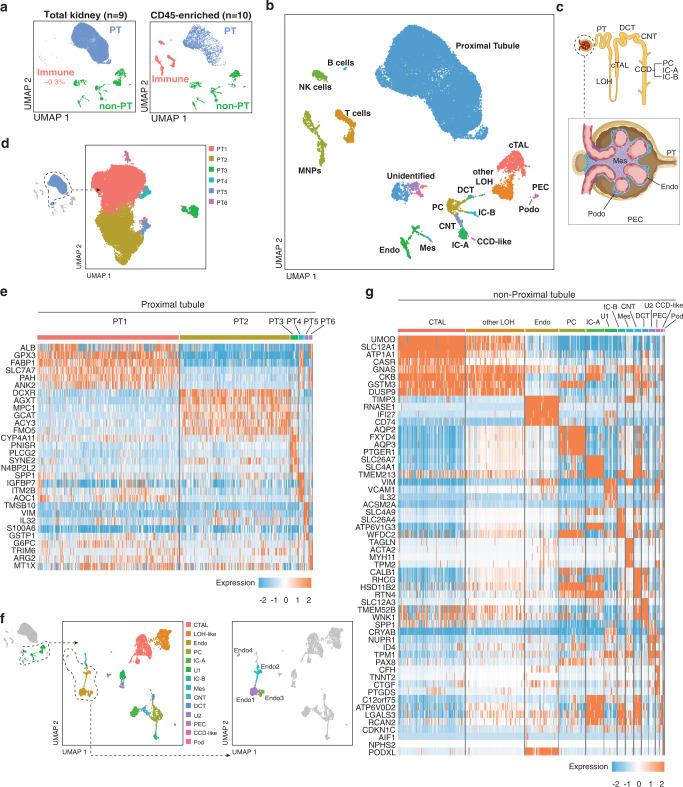
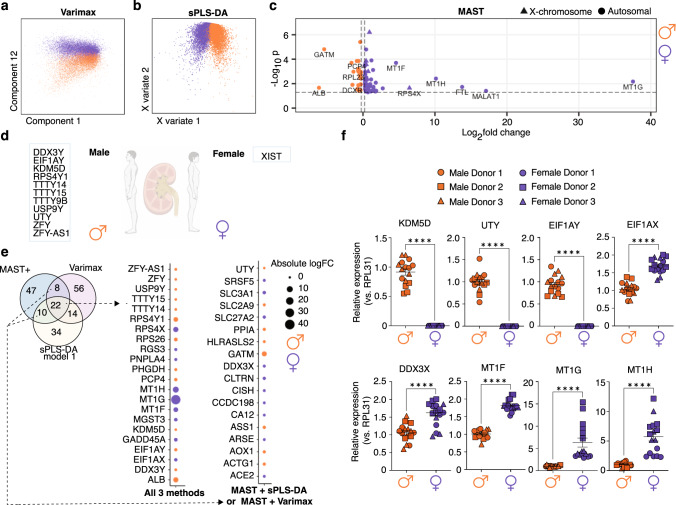
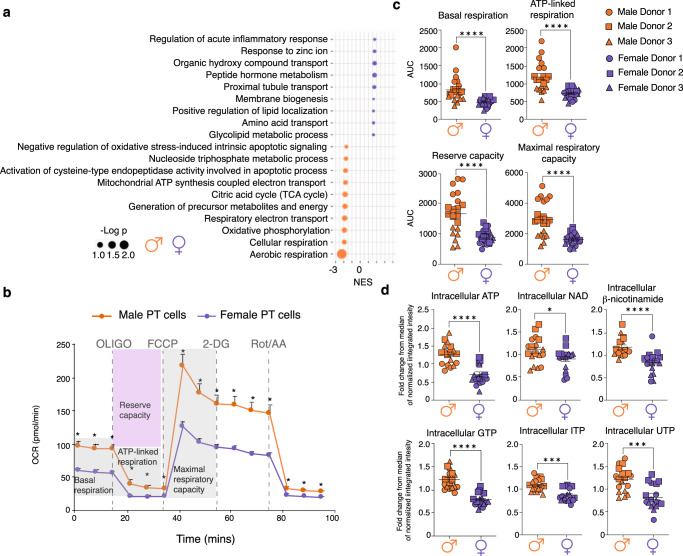
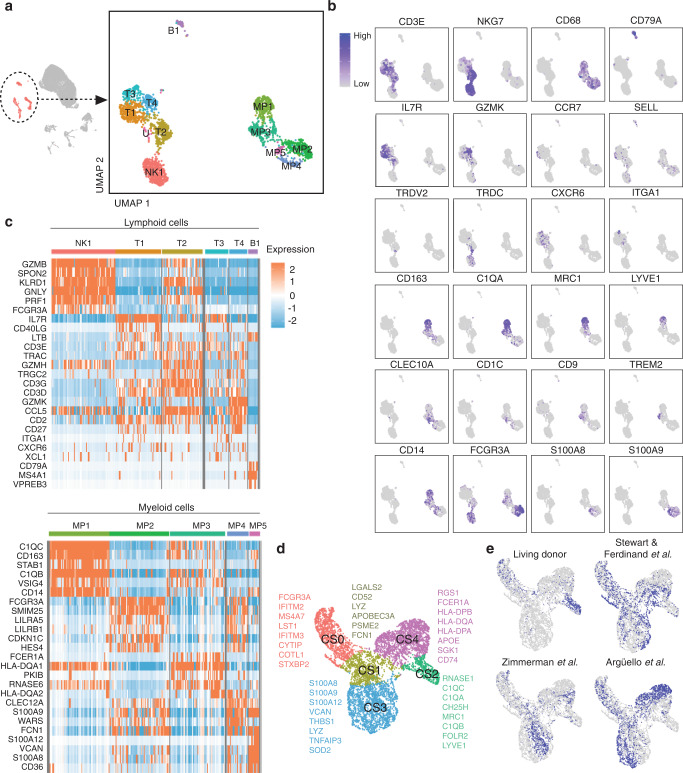
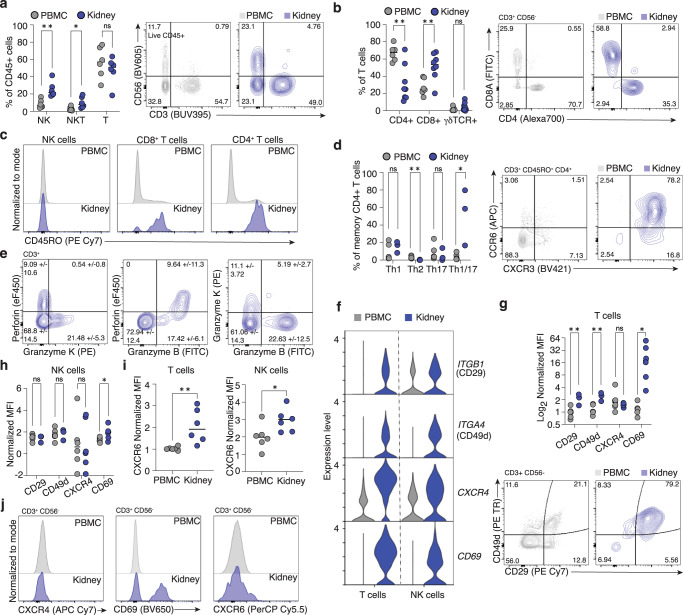
Knowledge of the transcriptional programs underpinning the functions of human kidney cell populations at homeostasis is limited. We present a single-cell perspective of healthy human kidney from 19 living donors, with equal contribution from males and females, profiling the transcriptome of 27677 cells to map human kidney at high resolution. Sex-based differences in gene expression within proximal tubular cells were observed, specifically, increased anti-oxidant metallothionein genes in females and aerobic metabolism-related genes in males. Functional differences in metabolism were confirmed in proximal tubular cells, with male cells exhibiting higher oxidative phosphorylation and higher levels of energy precursor metabolites. We identified kidney-specific lymphocyte populations with unique transcriptional profiles indicative of kidney-adapted functions. Significant heterogeneity in myeloid cells was observed, with a MRC1+LYVE1+FOLR2+C1QC+ population representing a predominant population in healthy kidney. This study provides a detailed cellular map of healthy human kidney, and explores the complexity of parenchymal and kidney-resident immune cells.


Conflict of interest statement

GDB is an advisor for Deep Genomics and is on the Scientific Advisory Board of Adela Bio. The remaining authors have no competing interests to declare.

Figures

Fig. 1
Fig. 1. Identification and annotation of kidney parenchymal cells.
a Different cell type proportions were captured by sequencing total kidney homogenate and CD45-enriched samples to create the total combined dataset. b UMAP clustering of total combined dataset with cell type annotations. c Graphical depiction of location of nephron cell types captured within the data. d UMAP plot of compartment-specific analysis of 20772 proximal tubular cells, comprising 6 clusters. e Heat map showing the expression levels of cluster marker genes. f UMAP plot of compartment-specific analysis of 4436 non-proximal tubular parenchymal cells, with 14 cell populations represented, including four distinct endothelial clusters. g Heat map showing the expression levels of cell type marker genes across the 14 non-PT cell populations. PT Proximal tubule, DCT Distal convoluted tubule, CNT Connecting tubule, LOH Loop of Henle, cTAL Cortical thick ascending limb, CCD Cortical collecting duct, PC Principal cell, IC Intercalated cell, Mes Mesangial, Podo Podocyte, Endo Endothelial, PEC Parietal epithelial cell, NK Natural Killer, MNP Mononuclear phagocyte.
Fig. 2
Fig. 2. Identifying genes differentially expressed between male and female proximal tubular cells.
2-Dimensional plots of (a) Varimax-rotated PCA and (b) sPLS-DA showing separation of male and female cells, and (c) volcano plot showing differential expression of genes between sexes from MAST analysis with sample random effect. d Genes expressed exclusively by all samples of one sex and none of the opposite sex, which were added to the MAST results for comparison across methods in e (termed MAST + ). e Venn diagram depicting genes identified through each analysis, with bubble plots highlighting genes identified by all three methods or by MAST plus one additional method. The size of the circle is proportional to absolute logFC and the colour indicates whether the gene was higher in male (orange) or female (dark purple) PT cells. Source data are provided in Supplementary Data 1. f Differences in gene expression of KDM5D (p < 0.0001, t = 17.32, df=30), UTY (p < 0.0001, t = 18.75, df=30), EIF1AY (p < 0.0001, t = 18.04, df=30), EIF1AX (p < 0.0001, t = 9.077, df=29), DDX3X (p < 0.0001, t = 5.619, df=29), MT1F (p < 0.0001, t = 16.04, df=30), MT1G (p < 0.0001, u = 0), and MT1H (p < 0.0001, t = 6.286, df=30) were determined in primary male and female PT cells, and normalized to RPL31 (n = 3 donors/sex; n = 16 replicates/sex). Source data are provided as a source data file. Group-to-group differences were assessed using two-tailed unpaired t-tests for variables following a normal distribution (KDM5D, UTY, EIF1AY, EIF1AX, DDX3X, MT1F, MT1H), and Mann-Whitney tests for variables with a non-parametric distribution (MT1G). Data are presented as mean values + /- SEM. ****p < 0.0001. Orange = males, dark purple = females. Circle, square, and triangle symbols indicate biologically independent donors for each sex.
Fig. 3
Fig. 3. Sex differences in mitochondrial respiration and energy precursor metabolism of proximal tubular cells.
a Depiction of selected significant (FDR < 0.25) terms identified by GSEA analysis as being enriched in males and females, respectively. Source data are provided in Supplementary Data 3. P values were calculated by Wilcoxon rank sum test without multiple comparison adjustment. b Oxygen consumption rate (OCR) was monitored to assess the mitochondrial respiration of male and female PT cells at baseline and after metabolic stress (n = 3 donors/sex; n = 21 replicates/male sex, and 23 replicates/female sex). To induce metabolic stress, the following sequence of drugs was injected: 1 μM oligomycin, 0.3 μM FCCP, 100 mM 2-DG, 1 mM Rot/AA. The OCR was monitored in male and female PT cells (n = 3 donors/sex; n = 21 replicates/male sex, and 23 replicates/female sex). Data are presented as mean values + /- SEM. c The basal OCR (p < 0.0001, u = 48), ATP-linked respiration (p < 0.0001, t = 5.223, df=42), reserve capacity (p < 0.0001, t = 5.018, df=42) and maximal respiratory capacity (p < 0.0001, t = 5.281, df=42) of male and female PT cells were calculated from the OCR curves in b. Group-to-group differences were assessed using two-tailed unpaired T tests for variables following a normal distribution (ATP-linked respiration, reserve capacity, maximal respiratory capacity), and Mann-Whitney tests for variables with a non-parametric distribution (Basal respiration). Data are presented as mean values + /- SEM. d In a separate experiment, the intracellular levels of ATP (p < 0.0001, t = 5.959, df=34), NAD (p = 0.029, u = 93), β-nicotinamide mononucleotide (p < 0.0001, t = 4.575, df=34), GTP (p < 0.0001, t = 7.45, df=34), ITP (p = 0.0001, u = 46), and UTP (p = 0.0001, t = 4.316, df=34) were determined in male and female PT cells (n = 3 donors/sex; n = 6 replicates/donor). Data are presented as mean values + /- SEM. Source data for (bd) are provided as a source data file. Group-to-group differences were assessed using two-tailed unpaired T tests for variables following a normal distribution (ATP, β-nicotinamide, GTP, UTP), and Mann-Whitney tests for variables with a non-parametric distribution (NAD, ITP). *p < 0.05;**p < 0.01;***p < 0.001;****p < 0.0001. PT proximal tubule, AUC area under the curve, OCR oxygen consumption rate, FCCP p-trifluoromethoxy carbonyl cyanide phenyl hydrazone, 2-DG 2-deoxyglucose, Rot rotenone, AA antimycin A, df degrees of freedom. Orange = males, dark purple = females. Circle, square, and triangle symbols indicate biologically independent donors for each sex.
Fig. 4
Fig. 4. Identification and annotation of kidney immune cells.
a Compartment-specific analysis of 2491 immune cells comprising 12 clusters and b cell type markers used for cluster annotations. c Heatmap of cell-type defining and highly expressed genes by each cluster separated by lymphoid and myeloid lineage. d UMAP plot showing the living donor myeloid cell data clustered together with Stewart and Ferdinand et al., Zimmerman et al., and Argüello et al. to define five cell states across datasets and their respective cluster markers. e UMAP plots highlighting the distribution of dataset membership across the cell states.
Fig. 5
Fig. 5. Characterization of kidney-resident T and NK cells.
a NK cells (p = 0.0025, t = 3.998, df=10) and NKT cells (p = 0.0327, t = 2.476, df=10) are proportionally enriched in kidney relative to blood, while T cell (p = 0.379, t = 0.918, df=10) abundance is unchanged. (n = 6) (b) Within the kidney T cell population, there is an enrichment of CD8+ T cells (p = 0.0060, t = 3.327, df=12) and a reduction in CD4 + T cell abundance (p = 0.0025, t = 3.815, df=12) with no change in TCRγδ+ T cells (p = 0.2158, u = 14) relative to blood. (n = 6) (c) Kidney T cells are predominantly antigen-experienced, marked by expression of CD45RO, while NK cells express minimal CD45RO. d Within kidney memory CD4+ T cells, there is an enrichment in the Th1/17 subpopulation (CXCR3+CCR6+) (p = 0.0238, u = 0) and a reduction in Th2 subpopulation (CRTh2+) abundance (p = 0.0098, t = 3.513, df=7) relative to blood while Th1 (CXCR3+) (p = 0.3810, u = 5) and Th17 (CCR6+) (p = 0.5476, u = 6) proportions were unchanged. (n = 3) (e) T cells expressing Granzyme K do not co-express perforin, indicating that they are a distinct T cell subset from Granzyme B+ Perforin+ cytotoxic T cells. f Violin plots showing differential gene expression of select markers in kidney T cells and NK cells relative to blood. g Surface levels of CD29 (p = 0.0061, t = 3.869, df=7), CD49d (p = 0.0027, t = 4.519, df=7) and CD69 (p = 0.0203, t = 2.756, df=10) were higher on kidney T cells relative to blood as measured by flow cytometry, while CXCR4 (p = 0.5887, u = 14) was not (n = 6). h Surface CD69 (p = 0.0427, t = 2.321, df=10) was higher on kidney NK cells relative to blood while CD29 (p = 0.6899, t = 0.4159, df=7), CD49d (p = 0.9040, t = 0.1250, df=7), and CXCR4 (p = 0.9326, t = 0.0868, df=10) were not. (n = 6) (i) CXCR6 abundance was higher at the protein level on both T cells (p = 0.0086, t = 3.258, df=10) (n = 6) and NK cells (p = 0.0364, t = 2.414, df=10) (n = 6) relative to blood. (j) Histograms showing no difference in CXCR4, increased CD69 and increased CXCR6 protein abundance in kidney T cells relative to blood. Group-to-group differences were assessed using two-tailed unpaired T tests for variables following a normal distribution, and Mann-Whitney tests for variables with a non-parametric distribution. *p < 0.05;**p < 0.01;***p < 0.001;****p < 0.0001. PBMC Peripheral blood mononuclear cells, NK Natural Killer cell, NKT Natural Killer T cells. Gray = PBMCs, Blue = Kidney. Source data for all panels provided as a source data file.

References

    1. Kurts C, Panzer U, Anders HJ, Rees AJ. The immune system and kidney disease: basic concepts and clinical implications. Nat. Rev. Immunol. 2013;13:738–753. doi: 10.1038/nri3523. - DOI - PubMed
    1. Rogers NM, Ferenbach DA, Isenberg JS, Thomson AW, Hughes J. Dendritic cells and macrophages in the kidney: a spectrum of good and evil. Nat. Rev. Nephrol. 2014;10:625–643. doi: 10.1038/nrneph.2014.170. - DOI - PMC - PubMed
    1. Stewart BJ, et al. Spatiotemporal immune zonation of the human kidney. Science. 2019;365:1461–1466. doi: 10.1126/science.aat5031. - DOI - PMC - PubMed
    1. Saat TC, et al. A comparison of inflammatory, cytoprotective and injury gene expression profiles in kidneys from brain death and cardiac death donors. Transplantation. 2014;98:15–21. doi: 10.1097/TP.0000000000000136. - DOI - PubMed
    1. Damman J, et al. Hypoxia and Complement-and-Coagulation Pathways in the Deceased Organ Donor as the Major Target for Intervention to Improve Renal Allograft Outcome. Transplantation. 2015;99:1293–1300. doi: 10.1097/TP.0000000000000500. - DOI - PubMed