. 2022 Dec 10;13(1):7645.
doi: 10.1038/s41467-022-35355-6.

An HSV-1-H129 amplicon tracer system for rapid and efficient monosynaptic anterograde neural circuit tracing

Affiliations

An HSV-1-H129 amplicon tracer system for rapid and efficient monosynaptic anterograde neural circuit tracing

Feng Xiong et al. Nat Commun. .

Abstract

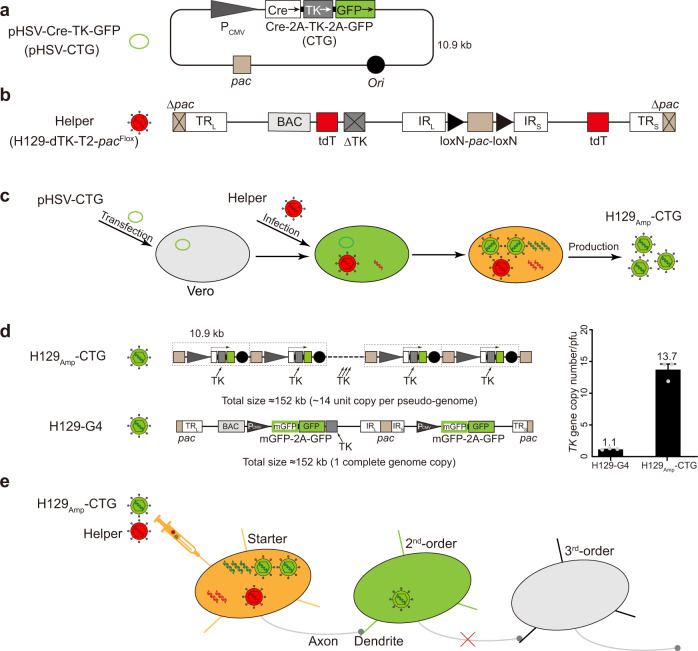
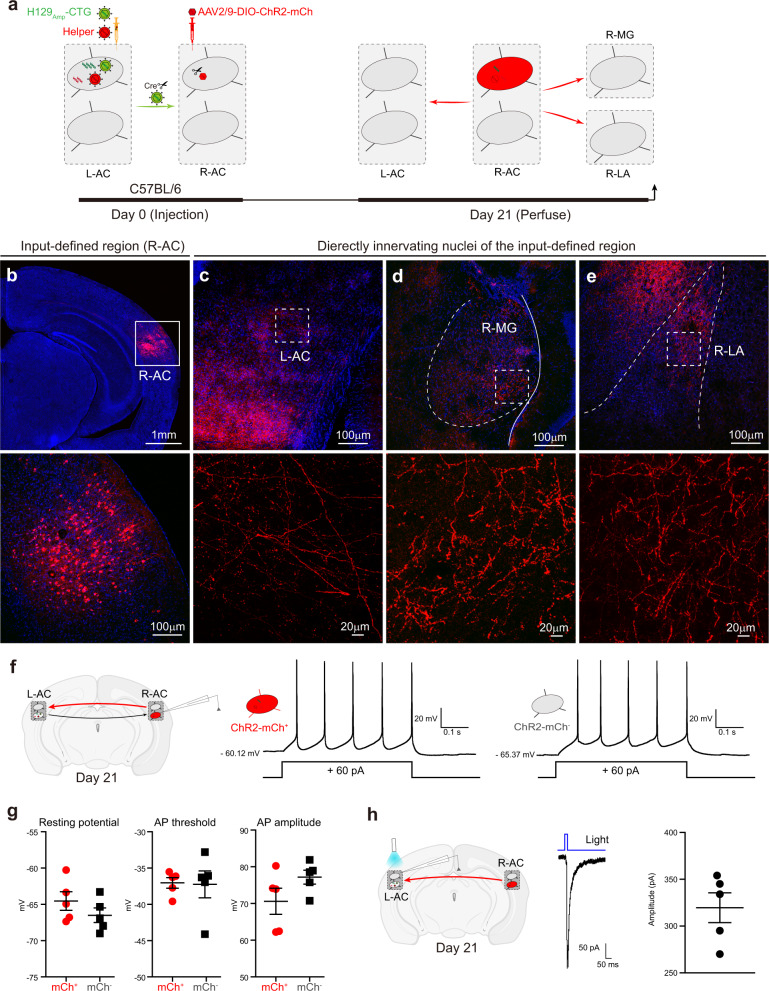
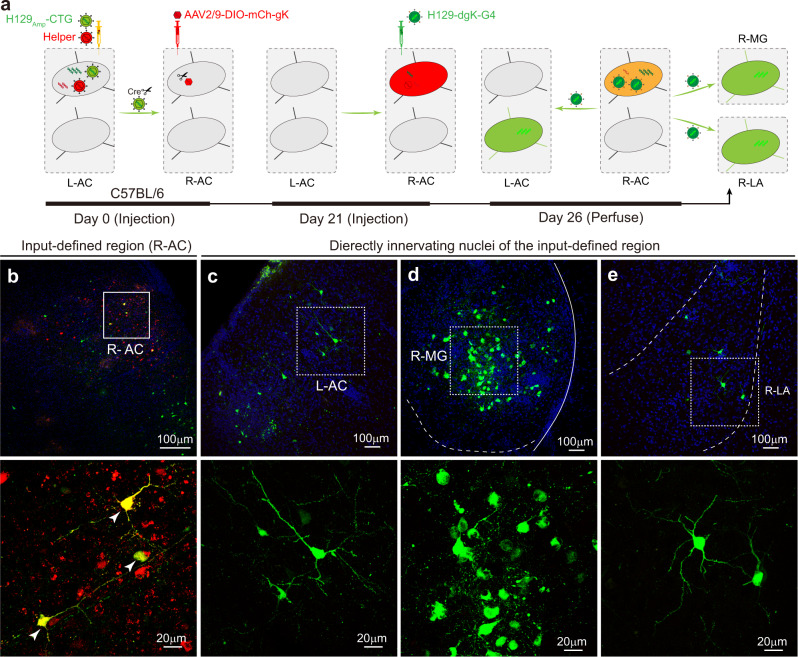
Monosynaptic viral tracers are essential tools for dissecting neuronal connectomes and for targeted delivery of molecular sensors and effectors. Viral toxicity and complex multi-injection protocols are major limiting application barriers. To overcome these barriers, we developed an anterograde monosynaptic H129Amp tracer system based on HSV-1 strain H129. The H129Amp tracer system consists of two components: an H129-dTK-T2-pacFlox helper which assists H129Amp tracer's propagation and transneuronal monosynaptic transmission. The shared viral features of tracer/helper allow for simultaneous single-injection and subsequent high expression efficiency from multiple-copy of expression cassettes in H129Amp tracer. These improvements of H129Amp tracer system shorten experiment duration from 28-day to 5-day for fast-bright monosynaptic tracing. The lack of toxic viral genes in the H129Amp tracer minimizes toxicity in postsynaptic neurons, thus offering the potential for functional anterograde mapping and long-term tracer delivery of genetic payloads. The H129Amp tracer system is a powerful tracing tool for revealing neuronal connectomes.


Conflict of interest statement

The authors declare no competing interests.

Figures

Fig. 1
Fig. 1. H129 amplicon-derived anterograde monosynaptic tracer system: H129Amp-CTG tracer and H129-dTK-T2-pacFlox helper.
a Schematic structure of amplicon plasmid pHSV-Cre-TK-GFP (pHSV-CTG). Ori and pac of H129 were cloned into pcDNA3.0 to generate the backbone pHSV. Then CMV-promoter-controlled expression cassette of Cre, HSV-TK, and GFP was inserted into pHSV, generating pHSV-CTG. b Schematic genome structure of H129-dTK-T2-pacFlox helper. H129-dTK-T2-pacFlox carries a viral genome with the TK deletion (dTK), two tdTomato (tdT) expression cassettes (T2), one pac removed (Δpac), and the remaining pac flanked by LoxN sequences (LoxN-pac-LoxN, pacFlox), which can be excised by Cre-recombinase. c Production of H129Amp tracer. Vero cells are transfected with pHSV-CTG for 24 h, then infected with H129-dTK-T2-pacFlox. The helper provides all the viral proteins for amplicon replication and packaging. Cre expressed by H129Amp-CTG excises the floxed-pac in H129-dTK-T2-pacFlox genome, disarms its genome packaging to produce helper virus. The replicated pHSV-CTG, containing pac signal, is packaged into viral particle as a pseudo-genome, generates the H129Amp-CTG tracer. d Schematic genome structure of the representative amplicon tracer H129Amp-CTG. The amplicon pseudo-genome, a similar size to the wild-type H129 genome (~152 kb), contains multiunit pHSV-CTG sequences (~14 units) (upper panel). While H129-G4 contains only 1-copy TK gene (lower panel). The absolute copy numbers of TK gene in the H129Amp-CTG pseudo-genome and H129-G4 genome were determined by quantitative PCR, then normalized to the corresponding virus titer determined by plaque-forming assay. The experiment was performed in triplicate, results are presented as means ± SEM from three independent experiments. The results indicate that H129Amp-CTG contains 13.7 ± 0.90 (means ± SEM) copies and H129-G4 contains only 1.1 ± 0.05 (means ± SEM) copies of TK gene/pfu on average (right panel). e The schematic mechanism for monosynaptic tracing with H129Amp-CTG tracer system. Neither H129Amp-CTG nor H129-dTK-T2-pacFlox propagates alone in neurons. When co-infecting the same neuron, H129-dTK-T2-pacFlox provides all the necessary viral proteins to support H129Amp-CTG replication and packaging, while its own encapsidation is disarmed since the floxed-pac is excised by Cre expressed from H129Amp-CTG. The newly produced H129Amp-CTG tracer, with the identical viral particle structure and transportation properties with wild-type H129, anterogradely transmits to postsynaptic neurons, and massively expresses GFP labeling these cells. H129Amp-CTG is restrained in the 2nd-order cells without further spread due to the lack of helper. Source data are provided as a Source Data file.
Fig. 2
Fig. 2. Fast-bright tracing the auditory cortex projection pathways with H129Amp tracer system.
a Schema of the simplified projection pathways of the auditory cortex. AC auditory cortex, Cont. AC contralateral AC, MG medial geniculate nucleus, LA lateral amygdala, GPe external globus pallidus, LC locus coeruleus. b Tracing AC outputs with H129Amp tracer system in wild-type C57BL/6 mice. The H129Amp- tracer system (H129Amp-CTG 1.5 × 108 pfu/ml and helper 1.5 × 108 pfu/ml, in 300 nl) was injected into the AC (AP: −2.80 mm; ML: −4.13 mm; DV: −2.38 mm) of wild-type C57BL/6 mice. The brains were collected at 1 and 5 days post-injection (Day 1 and Day 5), and images were obtained after cryosection and DAPI counterstaining. c Labeled neurons in the injection site at Day 1. Representative images of the injection site AC at Day 1 are shown (left panel), and the boxed region is displayed with higher magnification (middle panel). The numbers of AC neurons doubled-labeled by tdT/GFP (Yellow, 588 ± 103), or single-labeled by GFP (Green, 352 ± 95) or tdT (red, 210 ± 56) were quantified and presented as means ± SEM from three mice (right panel). di Representative tracing results at Day 5. Representative images of the injection site AC (d), and representative AC-innervating regions (ei) are shown. Images with higher magnifications of the boxed areas are presented in the right panels. Potential starter neurons labeled by both GFP and tdTomato (merged as yellow) are indicated with white arrowheads. A representative GFP-labeled neuron in Cont. AC is further magnified and the morphological details are displayed (h1 and h2). Source data are provided as a Source Data file.
Fig. 3
Fig. 3. Anatomical and functional outputs mapping of the input-defined neurons with H129Amp tracer system.
a Schematic illustration of the experiment setup and tracing strategy. The H129Amp tracer system (H129Amp-CTG 1.5 × 108 pfu/ml and helper 1.5 × 108 pfu/ml, in 300 nl) was injected into the auditory cortex of the left hemisphere (L-AC, AP: −2.80 mm; ML: −4.13 mm; DV: −2.38 mm) of wild-type C57BL/6 mice; AAV2/9-DIO-ChR2-mCh (3.0 × 1012 vg/ml, 100 nl), a reporter, was simultaneously injected into the R-AC (AP: −2.80 mm; ML: +4.13 mm; DV: −2.38 mm) of the same mice. The brains were collected at Day 21 for imaging or physiological assays. L-AC auditory cortex of the left hemisphere, R-AC AC of the right hemisphere, R-MG medial geniculate nucleus of the right hemisphere, R-LA lateral amygdala of the right hemisphere. be Representative tracing results. Shown are the representative images of input-defined region R-AC (b) and the R-AC-innervating regions (ce). Images with higher magnifications of the boxed areas are presented in the lower panels. f, g Electrophysiological comparison of H129Amp labeled postsynaptic neurons and the adjacent non-labeled neurons. Current-clamp recordings were performed on the R-AC neurons to measure the electrophysiological parameters (f, left panel). Representative membrane responses of the H129Amp labeled postsynaptic R-AC neurons (mCh+, f, middle panel) and the adjacent non-labeled normal neuron controls (mCh, f, right panel). Other electrophysiological parameters include resting potential (−64.54 ± 1.28 for mCh+, −66.50 ± 1.01 for mCh), AP threshold (−37.05 ± 0.73 for mCh+, −37.25 ± 1.86 for mCh) and AP amplitude (70.60 ± 3.56 for mCh+, 77.17 ± 1.88 for mCh) expressed as means ± SEM (n = 10 from 3 mice) (g). AP, action potential. h Optogenetic connectivity mapping. Excitatory currents were recorded on the L-AC neurons of the brain slice at Day 21 with LED stimulation (n = 11 from 3 mice) (left panel). The excitatory currents (−70 mV) of a representative L-AC neuron (middle panel) and the mean amplitudes 319.6 ± 15.97 (means ± SEM) with LED-on are shown (right panel). Light stimulation duration is marked by the blue bar. Source data are provided as a Source Data file.
Fig. 4
Fig. 4. Input-defined postsynaptic neurons’ anterograde monosynaptic tracing with H129Amp tracer system together with other tracers.
a Schematic illustration of the experiment setup and tracing strategy. The H129Amp tracer system (H129Amp-CTG 1.5 × 108 pfu/ml and helper 1.5 × 108 pfu/ml, in 300 nl) was injected into the L-AC (AP: −2.80 mm; ML: −4.13 mm; DV: −2.38 mm) of wild-type C57BL/6 mice, and AAV2/9-DIO-mCh-gK (1.0 × 1012 vg/ml, 100 nl) was simultaneously injected into the R-AC (AP: −2.80 mm; ML: +4.13 mm; DV: −2.38 mm). At Day 21, H129-dgK-G4 (5.0 × 108 pfu/ml, 100 nl) was injected into the R-AC of the same mice. Brains were collected at Day 26, and images were obtained after cryosection and DAPI counterstaining. H129Amp-CTG propagates in the L-AC neurons (1st order) with helper assistance, and transmits through the first synapse to the 2nd-order neuron in the R-AC. There, H129Amp-CTG expresses Cre to initiate AAV2/9-DIO-mCh-gK expressing mCherry and gK, labeling the neurons and supporting H129-dgK-G4 propagation, respectively. The newly produced H129-dgK-G4 then transmits through the second synapse to the 3rd-order neurons, labeling them with GFP. be Representative input-defined postsynaptic neurons’ anterograde monosynaptic tracing result at Day 26. Shown are the representative images of the 2nd-order brain region, R-AC (b), and the 3rd-order regions, including L-AC, R-MG, and R-LA (ce). The 1st-order starter neurons were not visible anymore and the potential 2nd−order starter neurons are labeled by both GFP and mCherry (merged as yellow), indicated with white arrowheads (b). Images with higher magnifications of the boxed areas are presented in the lower panels.

Similar articles

Cited by

References

    1. Wickersham IR, et al. Monosynaptic restriction of transsynaptic tracing from single, genetically targeted neurons. Neuron. 2007;53:639–647. doi: 10.1016/j.neuron.2007.01.033. - DOI - PMC - PubMed
    1. Osakada F, Callaway EM. Design and generation of recombinant rabies virus vectors. Nat. Protoc. 2013;8:1583–1601. doi: 10.1038/nprot.2013.094. - DOI - PMC - PubMed
    1. Ciabatti E, Gonzalez-Rueda A, Mariotti L, Morgese F, Tripodi M. Life-long genetic and functional access to neural circuits using self-inactivating rabies virus. Cell. 2017;170:382–392 e314. doi: 10.1016/j.cell.2017.06.014. - DOI - PMC - PubMed
    1. Xu X, et al. Viral vectors for neural circuit mapping and recent advances in trans-synaptic anterograde tracers. Neuron. 2020;107:1029–1047. doi: 10.1016/j.neuron.2020.07.010. - DOI - PMC - PubMed
    1. Nassi JJ, Cepko CL, Born RT, Beier KT. Neuroanatomy goes viral! Front. Neuroanat. 2015;9:80. doi: 10.3389/fnana.2015.00080. - DOI - PMC - PubMed