

Microsatellite Analysis Revealed Potential DNA Markers for Gestation Length and Sub-Population Diversity in Kari Sheep
- PMID: 36496813
- PMCID: PMC9736151
- DOI: 10.3390/ani12233292
Microsatellite Analysis Revealed Potential DNA Markers for Gestation Length and Sub-Population Diversity in Kari Sheep
Abstract
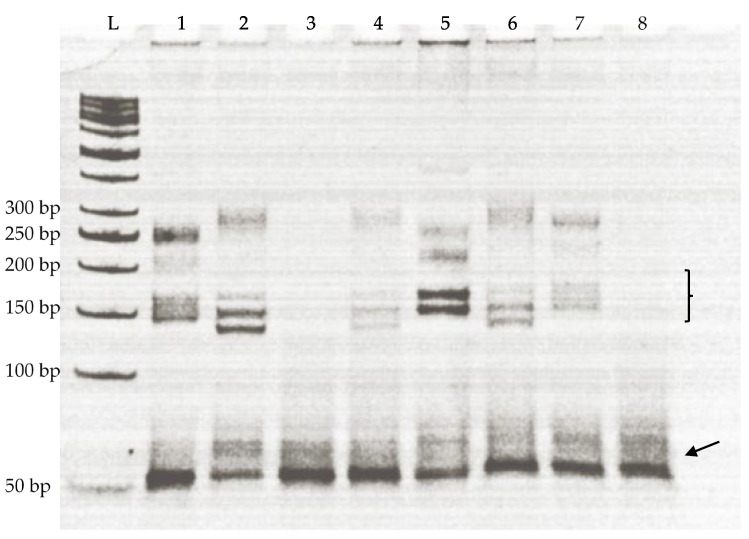
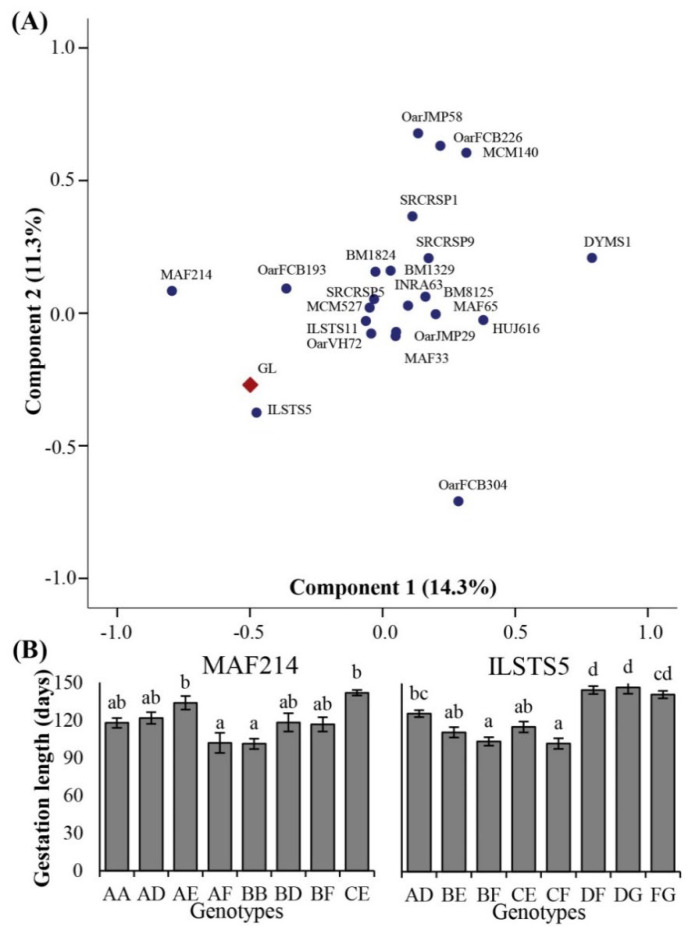
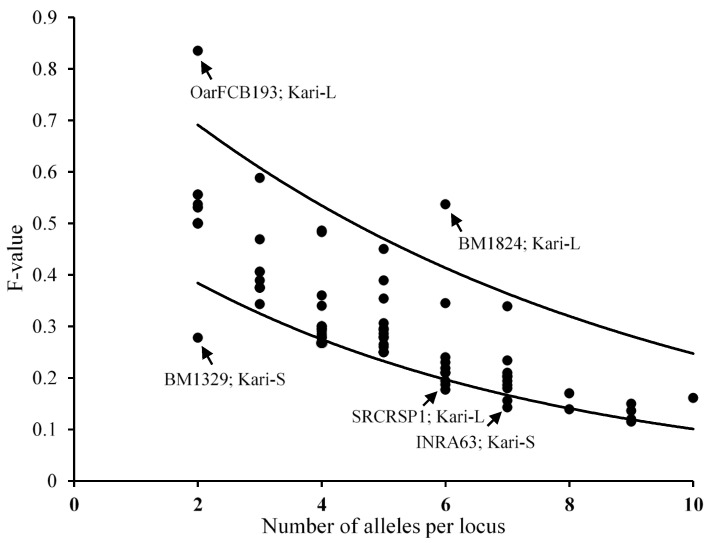
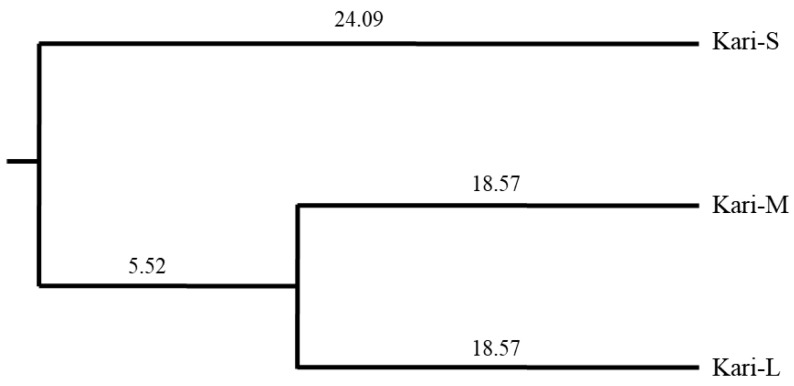
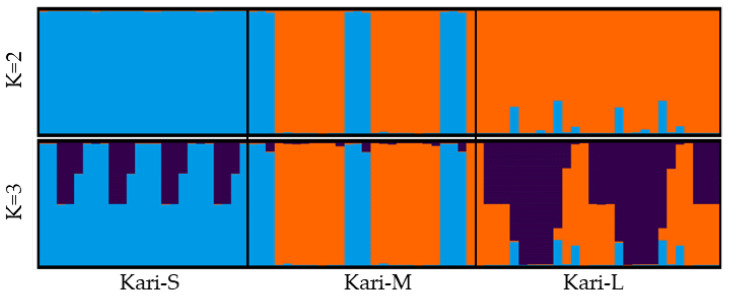
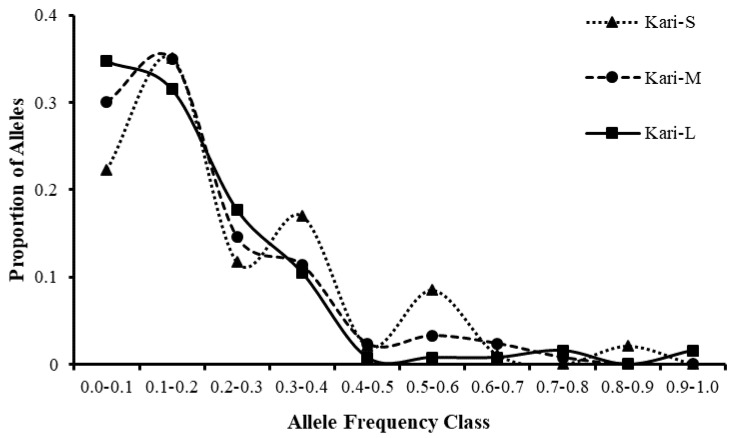
Kari sheep inhabiting the Chitral district of Pakistan show variation in gestation length. In this study, we have analyzed the genetic differences between the three subtypes of Kari sheep (based on variation in gestation length) using microsatellite markers. Kari sheep samples were collected from their breeding tract and were characterized for gestation length and genetic diversity using microsatellite markers. A total of 78 Kari ewes were grouped into three categories based on gestation length (GL), i.e., Kari-S (with a shorter GL), Kari-M (with a medium GL), and Kari-L (with a longer GL). DNA from these samples was used to amplify 31 ovine-specific microsatellite loci through PCR. Of the total 78 Kari specimens, 24 were grouped in Kari-S (GL = 100.7 ± 1.8), 26 were from the Kari-M subtype (GL = 123.1 ± 1.0), and 28 were Kari-L (GL = 143.8 ± 1.5). Microsatellite analysis revealed an association of genotypes at two marker sites (MAF214 and ILSTS5) with variation in GL. A total of 158 alleles were detected across the 22 polymorphic loci with an average of 7.18 alleles per locus. Unique alleles were found in all three subtypes. The highest number of unique alleles was observed in Kari-L (15), followed by Kari-S (10) and Kari-M (8). The results indicated that Kari-S is a genetically distinct subtype (with higher genetic differentiation and distance) from Kari-M and Kari-L. The genetic uniqueness of Kari-S is important for further exploration of the genetic basis for shorter gestation length, and exploitation of their unique values.
Keywords: Kari sheep; bottleneck analysis; genetic diversity; gestation length; microsatellite association.
Conflict of interest statement
The authors declare no conflict of interest.
Figures
Similar articles
-
Genetic variation in zona pellucida-3 (ZP3) gene and its association with litter size variation in Kari sheep.Anim Biotechnol. 2025 Dec;36(1):2450364. doi: 10.1080/10495398.2025.2450364. Epub 2025 Jan 24. Anim Biotechnol. 2025. PMID: 39851258
-
Genetic diversity and bottleneck analysis of Indian bellary sheep by microsatellite markers.Genetika. 2007 Sep;43(9):1198-208. Genetika. 2007. PMID: 17990518
-
WITHDRAWN:Microsatellite based genetic characterization and bottleneck analysis of Kari and Madakhlasht sheep breeds from Chitral district of Khyber Pakhtunkhwa, Pakistan.Asian-Australas J Anim Sci. 2020 Apr 12. doi: 10.5713/ajas.19.0418. Online ahead of print. Asian-Australas J Anim Sci. 2020. PMID: 32299166
-
[Genetic diversity of microsatellite loci in captive Amur tigers].Yi Chuan. 2004 Sep;26(5):620-4. Yi Chuan. 2004. PMID: 15640074 Chinese.
-
Microsatellite based Genetic Variation among the Buffalo Breed Populations in Pakistan.J Vet Res. 2017 Dec 27;61(4):535-542. doi: 10.1515/jvetres-2017-0057. eCollection 2017 Dec. J Vet Res. 2017. PMID: 29978120 Free PMC article.
Cited by
-
Identification of microsatellites and their effect on economic traits of Texel × Kazakh sheep.Front Vet Sci. 2025 May 29;12:1583625. doi: 10.3389/fvets.2025.1583625. eCollection 2025. Front Vet Sci. 2025. PMID: 40548249 Free PMC article.
References
-
- Ahmad S. Performance and Phylogenetic Position of Kari Sheep in Pakistan. University of Agriculture Faisalabad; Faisalabad, Pakistan: 2008.
-
- IUCN . NWFP Chitral—An Integrated Development Vision (Chitral Coservation Strategy) IUCN The World Conservation Union Pakistan and NWFP; Karachi, Pakistan: 2004. p. 103.
-
- Ahmad S., Riaz M., Siddiqui M.M., Habib G. The Kari sheep—A genetic heritage. J. Anim. Plant. Sci. 2002;12:14–16.
-
- AKRSP . The Wheel of Fortune, a Study of the Patti Production System in Chitral. Agha Khan Rural Support Program, Agha Khan Foundation; London, UK: 1996. p. 70.
LinkOut - more resources
Full Text Sources
