. 2022 Nov 30;12(23):3371.
doi: 10.3390/ani12233371.

Daily Rhythms in the IGF-1 System in the Liver of Goldfish and Their Synchronization to Light/Dark Cycle and Feeding Time

Affiliations

Daily Rhythms in the IGF-1 System in the Liver of Goldfish and Their Synchronization to Light/Dark Cycle and Feeding Time

Aitana Alonso-Gómez et al. Animals (Basel). .

Abstract

The relevance of the insulin-like growth factor-1 (IGF-1) system in several physiological processes is well-known in vertebrates, although little information about their temporal organization is available. This work aims to investigate the possible rhythmicity of the different components of the IGF-1 system (igf-1, the igf1ra and igf1rb receptors and the paralogs of its binding proteins IGFBP1 and IGFBP2) in the liver of goldfish. In addition, we also study the influence of two environmental cues, the light/dark cycle and feeding time, as zeitgebers. The hepatic igf-1 expression showed a significant daily rhythm with the acrophase prior to feeding time, which seems to be strongly dependent on both zeitgebers. Only igfbp1a-b and igfbp1b-b paralogs exhibited a robust daily rhythm of expression in the liver that persists in fish held under constant darkness or randomly fed. The hepatic expression of the two receptor subtypes did not show daily rhythms in any of the experimental conditions. Altogether these results point to the igf-1, igfbp1a-b, and igfbp1b-b as clock-controlled genes, supporting their role as putative rhythmic outputs of the hepatic oscillator, and highlight the relevance of mealtime as an external cue for the 24-h rhythmic expression of the IGF-1 system in fish.

Keywords: biological clock; chronobiology; circadian; fish; gene expression; insulin-like binding proteins; insulin-like growth factor 1; insulin-like growth factor receptors.


Conflict of interest statement

The authors declare no conflict of interest. The funders had no role in the design of the study; in the collection, analyses, or interpretation of data; in the writing of the manuscript; or in the decision to publish the results.

Figures

Figure 1
Figure 1
Tissue distribution of the IGF-1 system in peripheral tissues of goldfish. Relative expression of (A) igf-1, (B) igf1ra, (C) igf1rb, (D) the four paralogs (a-a, a-b, b-a, b-b) of igfbp1 and igfbp2 in the liver. Data are expressed as mean ± s.e.m. (n = 6) relative to the posterior intestine (igf-1, igf1ra and igf1rb). Different letters indicate statistical differences among tissues or subtypes. Interrenal gland (IG), gill (GILL), heart (HEA), esophagus (OES), intestinal bulb (IB), anterior intestine (AI), middle intestine (MI), posterior intestine (PI), spleen (SPL), liver (LIV), adipose tissue (ADT), kidney (KID), gonad (GON), skin (SKIN), muscle (MUS).
Figure 2
Figure 2
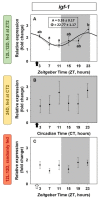
Daily variations of igf-1 expression in the liver of goldfish. (A) standard conditions group (12L:12D photoperiod, feeding time at ZT2); (B) 24D group (24 h darkness, feeding time at CT2); (C) random feeding group (12L:12D photoperiod, randomly fed). Data are expressed as mean ± s.e.m. (n = 7/sampling time). Different letters indicate statistical differences among sampling times (ANOVA). Sinusoidal waves represent significant rhythm by cosinor analysis. Dashed lines represent significant differences among sampling points by ANOVA. Black arrows indicate feeding time. The white arrow indicates the time of the last feeding. The dark period is represented in grey. Parameters defining the rhythms (A: amplitude, ϕ: acrophase).
Figure 3
Figure 3
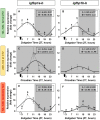
Daily variations of igfbp1a-b (A,C,E) and igfbp1b-a (B,D,F) expression in the liver of goldfish. (A,B) Standard conditions group (12L:12D photoperiod, feeding time at ZT2); (C,D) 24D group (24 h darkness, feeding time at CT2); (E,F) random feeding group (12L:12D photoperiod, randomly fed). Data are expressed as mean ± s.e.m. (n = 7/sampling time). Different letters indicate statistical differences among sampling times (ANOVA). Sinusoidal waves represent significant rhythms by cosinor analysis. Dashed lines represent significant differences among sampling points by ANOVA. Black arrows indicate feeding time. White arrows indicate the time of the last feeding. The dark period is represented in grey. Parameters defining the rhythms (A: amplitude, ϕ: acrophase).
Figure 4
Figure 4
Daily variations of igf1ra (A,C,E) and igf1rb (B,D,F) expression in the liver of goldfish. (A,B) Standard conditions group (12L:12D photoperiod, feeding time at ZT2); (C,D) 24D group (24 h darkness, feeding time at CT2); (E,F) random feeding group (12L:12D photoperiod, randomly fed). Data are expressed as mean ± s.e.m. (n = 7/sampling time). Different letters indicate statistical differences among sampling times (ANOVA). Dashed lines represent significant differences among sampling points by ANOVA. Black arrows indicate feeding time. White arrows indicate the time of the last feeding. The dark period is represented in grey.
Figure 5
Figure 5
Effect of a shifted mealtime on the daily expression of igf-1 in the liver of goldfish. (A) ML group (fish fed at the mid-photophase, ZT6). (B) MD group (fish fed at mid-scotophase, ZT18). Data are expressed as mean ± s.e.m. (n = 6/sampling time). Different letters indicate statistical differences among sampling times (ANOVA). Sinusoidal waves represent significant rhythms by Cosinor analysis. Dashed lines represent significant differences among sampling points by ANOVA. Black arrows indicate feeding time. The dark period is represented in grey. Parameters defining the rhythms (A: amplitude, ϕ: acrophase).
Figure 6
Figure 6
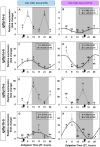
Effect of a shifted mealtime on the daily expression of igfbp1 paralogs in the liver of goldfish. (A,B) igfbp1a-a; (C,D) igfbp1a-b; (E,F) igfbp1b-b; (G,H) igfbp1b-a. On the right (A,C,E), fish fed at mid-photophase, ZT6); on the left (B,D,F), fish fed at mid-scotophase, ZT18). Data are expressed as mean ± s.e.m. (n = 7/sampling time). Different letters indicate statistical differences among sampling points (ANOVA). Sinusoidal curves represent significant rhythms by Cosinor analysis. Dashed lines represent significant differences among sampling points by ANOVA. Black arrows indicate feeding time. The dark period is represented in grey.
Figure 7
Figure 7
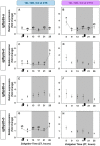
Effect of a shifted mealtime on the daily expression of igfbp2 paralogs in the liver of goldfish. (A,B) igfbp2a-a; (C,D) igfbp2a-b; (E,F) igfbp2b-b; (G,H) igfbp2b-a. On the right (A,C,E), fish fed at mid-photophase, ZT6); on the left (B,D,F), fish fed at mid-scotophase, ZT18. Data are expressed as mean ± s.e.m. (n = 7/sampling time). Different letters indicate statistical differences among sampling points (ANOVA). Dashed lines represent significant differences among sampling points by ANOVA. Black arrows indicate feeding time. The dark period is represented in grey.
Figure 8
Figure 8
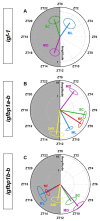
Polar representations of cosinor-derived rhythmic parameters of igf-1 (A), igfbp1a-b (B) and igfbp1b-b (C) gene expressions under the different experimental conditions. Amplitude and acrophase are represented by a single vector starting from the center. The length of the vector (radial axis) indicates the magnitude of the amplitude (fold change of relative expression,) and the phase angle of the vector represents the acrophase (ϕ, ZT, Zeitgeber Time). The ellipse at the tip of the vector represents the confidence limits for the amplitude-acrophase pair. SC: Standard conditions, RF: random feeding, 24D: total darkness, ML: fish fed at mid-light, MD: fish fed at midnight.

References

    1. Ohlsson C., Mohan S., Sjögren K., Tivesten Å., Isgaard J., Isaksson O., Jansson J.O., Svensson J. The role of liver-derived insulin-like growth factor-I. Endocr. Rev. 2009;30:494–535. doi: 10.1210/er.2009-0010. - DOI - PMC - PubMed
    1. Triantaphyllopoulos K.A., Cartas D., Miliou H. Factors influencing GH and IGF-I gene expression on growth in teleost fish: How can aquaculture industry benefit? Rev. Aquac. 2019;12:1637–1662. doi: 10.1111/raq.12402. - DOI
    1. Shimizu M. Insulin-Like Growth Factor-1. In: Ando H., Ukena K., Nagata S., editors. Handbook of Hormones. Comparative Endocrinology for Basic and Clinical Research. Academic Press; London, UK: 2021. pp. 285–296.
    1. Hakuno F., Takahashi S.I. 40 years of IGF1: IGF1 receptor signaling pathways. J. Mol. Endocrinol. 2018;61:T69–T86. doi: 10.1530/JME-17-0311. - DOI - PubMed
    1. Duan C. Nutritional and developmental roles of insulin-like growth factors between species: A brief history and introduction. J. Nutr. 1998;128:306–314. doi: 10.1093/jn/128.2.306S. - DOI - PubMed

LinkOut - more resources