Oxygen Gradient Induced in Microfluidic Chips Can Be Used as a Model for Liver Zonation
- PMID: 36496994
- PMCID: PMC9738923
- DOI: 10.3390/cells11233734
Oxygen Gradient Induced in Microfluidic Chips Can Be Used as a Model for Liver Zonation
Abstract
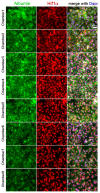
Availability of oxygen plays an important role in tissue organization and cell-type specific metabolism. It is, however, difficult to analyze hypoxia-related adaptations in vitro because of inherent limitations of experimental model systems. In this study, we establish a microfluidic tissue culture protocol to generate hypoxic gradients in vitro, mimicking the conditions found in the liver acinus. To accomplish this, four microfluidic chips, each containing two chambers, were serially connected to obtain eight interconnected chambers. HepG2 hepatocytes were uniformly seeded in each chamber and cultivated under a constant media flow of 50 µL/h for 72 h. HepG2 oxygen consumption under flowing media conditions established a normoxia to hypoxia gradient within the chambers, which was confirmed by oxygen sensors located at the inlet and outlet of the connected microfluidic chips. Expression of Hif1α mRNA and protein was used to indicate hypoxic conditions in the cells and albumin mRNA and protein expression served as a marker for liver acinus-like zonation. Oxygen measurements performed over 72 h showed a change from 17.5% to 15.9% of atmospheric oxygen, which corresponded with a 9.2% oxygen reduction in the medium between chamber1 (inlet) and 8 (outlet) in the connected microfluidic chips after 72 h. Analysis of Hif1α expression and nuclear translocation in HepG2 cells additionally confirmed the hypoxic gradient from chamber1 to chamber8. Moreover, albumin mRNA and protein levels were significantly reduced from chamber1 to chamber8, indicating liver acinus zonation along the oxygen gradient. Taken together, microfluidic cultivation in interconnected chambers provides a new model for analyzing cells in a normoxic to hypoxic gradient in vitro. By using a well-characterized cancer cell line as a homogenous hepatocyte population, we also demonstrate that an approximate 10% reduction in oxygen triggers translocation of Hif1α to the nucleus and reduces albumin production.
Keywords: CoCl2; DFX; HepG2; Hif1α; albumin; hypoxic condition; in vitro; liver; microfluidic chips; oxygen.
Conflict of interest statement
The authors declare no conflict of interest.
Figures


Similar articles
-
Design, fabrication, and characterization of a user-friendly microfluidic device for studying liver zonation-on-chip (ZoC).Biomed Microdevices. 2025 Feb 14;27(1):8. doi: 10.1007/s10544-025-00738-1. Biomed Microdevices. 2025. PMID: 39953294 Free PMC article.
-
3D microperfusion of mesoscale human microphysiological liver models improves functionality and recapitulates hepatic zonation.Acta Biomater. 2023 Nov;171:336-349. doi: 10.1016/j.actbio.2023.09.022. Epub 2023 Sep 19. Acta Biomater. 2023. PMID: 37734628
-
Progressive hypoxia-on-a-chip: An in vitro oxygen gradient model for capturing the effects of hypoxia on primary hepatocytes in health and disease.Biotechnol Bioeng. 2020 Mar;117(3):763-775. doi: 10.1002/bit.27225. Epub 2019 Nov 28. Biotechnol Bioeng. 2020. PMID: 31736056 Free PMC article.
-
Metabolic zonation of the liver: The oxygen gradient revisited.Redox Biol. 2017 Apr;11:622-630. doi: 10.1016/j.redox.2017.01.012. Epub 2017 Jan 17. Redox Biol. 2017. PMID: 28126520 Free PMC article. Review.
-
Liver Zonation in Health and Disease: Hypoxia and Hypoxia-Inducible Transcription Factors as Concert Masters.Int J Mol Sci. 2019 May 11;20(9):2347. doi: 10.3390/ijms20092347. Int J Mol Sci. 2019. PMID: 31083568 Free PMC article. Review.
Cited by
-
Construction of in vitro liver-on-a-chip models and application progress.Biomed Eng Online. 2024 Mar 15;23(1):33. doi: 10.1186/s12938-024-01226-y. Biomed Eng Online. 2024. PMID: 38491482 Free PMC article. Review.
-
Purinergic Signaling in Non-Parenchymal Liver Cells.Int J Mol Sci. 2024 Aug 30;25(17):9447. doi: 10.3390/ijms25179447. Int J Mol Sci. 2024. PMID: 39273394 Free PMC article. Review.
-
Histopathological fingerprints and biochemical changes as multi-stress biomarkers in fish confronting concurrent pollution and parasitization.iScience. 2024 Nov 19;27(12):111432. doi: 10.1016/j.isci.2024.111432. eCollection 2024 Dec 20. iScience. 2024. PMID: 39687020 Free PMC article.
-
Design, fabrication, and characterization of a user-friendly microfluidic device for studying liver zonation-on-chip (ZoC).Biomed Microdevices. 2025 Feb 14;27(1):8. doi: 10.1007/s10544-025-00738-1. Biomed Microdevices. 2025. PMID: 39953294 Free PMC article.
-
A Novel Microfluidic Platform for Personalized Anticancer Drug Screening Through Image Analysis.Micromachines (Basel). 2024 Dec 21;15(12):1521. doi: 10.3390/mi15121521. Micromachines (Basel). 2024. PMID: 39770275 Free PMC article.
References
MeSH terms
Substances
Grants and funding
LinkOut - more resources
Full Text Sources
Miscellaneous

