. 2022 Nov 25;11(23):3769.
doi: 10.3390/cells11233769.

Dynamic Changes in the Extracellular Matrix in Primary, Metastatic, and Recurrent Ovarian Cancers

Affiliations

Dynamic Changes in the Extracellular Matrix in Primary, Metastatic, and Recurrent Ovarian Cancers

Arkadiusz Gertych et al. Cells. .

Abstract

Cancer-associated fibroblasts (CAFs) and their extracellular matrix are active participants in cancer progression. While it is known that functionally different subpopulations of CAFs co-exist in ovarian cancer, it is unclear whether certain CAF subsets are enriched during metastatic progression and/or chemotherapy. Using computational image analyses of patient-matched primary high-grade serous ovarian carcinomas, synchronous pre-chemotherapy metastases, and metachronous post-chemotherapy metastases from 42 patients, we documented the dynamic spatiotemporal changes in the extracellular matrix, fibroblasts, epithelial cells, immune cells, and CAF subsets expressing different extracellular matrix components. Among the different CAF subsets, COL11A1+ CAFs were associated with linearized collagen fibers and exhibited the greatest enrichment in pre- and post-chemotherapy metastases compared to matched primary tumors. Although pre- and post-chemotherapy metastases were associated with increased CD8+ T cell infiltration, the infiltrate was not always evenly distributed between the stroma and cancer cells, leading to an increased frequency of the immune-excluded phenotype where the majority of CD8+ T cells are present in the tumor stroma but absent from the tumor parenchyma. Overall, most of the differences in the tumor microenvironment were observed between primary tumors and metastases, while fewer differences were observed between pre- and post-treatment metastases. These data suggest that the tumor microenvironment is largely determined by the primary vs. metastatic location of the tumor while chemotherapy does not have a significant impact on the host microenvironment.

Keywords: CAF; COL11A1; ECM; carcinoma-associated fibroblasts; collagen; computational imaging; extracellular matrix; high-grade serous ovarian cancer; tumor microenvironment.


Conflict of interest statement

The authors declare no conflict of interest. The funders had no role in the design of the study; in the collection, analyses, or interpretation of data; in the writing of the manuscript; or in the decision to publish the results.

Figures

Figure 1
Figure 1
Workflow diagram of TMA generation, cell type annotation/positive cell detection, and statistical analysis. HGSOC, high-grade serous ovarian cancer; TMA, tissue microarray; H&E, hematoxylin, and eosin; IHC, immunohistochemistry; ISH, in situ hybridization.
Figure 2
Figure 2
Percentages of fibroblasts, epithelial cancer cells, and immune cells in primary tumors and synchronous and metachronous metastases. (A) Example of H&E-stained HGSOC before and after annotation of fibroblasts, epithelial cancer cells, and immune cells by QuPath analysis. (B) Box and whisker plots show percentages of fibroblasts, epithelial cancer cells, and immune cells in primary HGSOC and synchronous and metachronous recurrent metastases. The Y-axis represents the percentage of a specific cell type among all detected cells. The table shows p values for comparisons between every two groups of samples within the three groups.
Figure 3
Figure 3
Distribution of three CAF subsets during HGSOC progression. (A) t-SNE plots of COL11A1, ACTA2 (encoding for α-SMA), and PDPN mRNA expression in ovarian CAFs. The images were generated using SCope software and public single-cell RNA sequencing data deposited into the ArrayExpress database at EMBL-EBI under accession numbers E-MTAB-8107. (B) Box and whisker plots show percentages of COL11A1+, α-SMA+, and PDPN+ CAFs in primary tumors, synchronous metastases, and metachronous recurrent metastases. The Y-axis represents the percentage of the CAF subtype among all morphologically defined CAFs. The table shows p values for comparisons between every two groups of samples within the three groups.
Figure 4
Figure 4
Metastatic and recurrent tumors have a different ECM texture and pattern than primary HGSOC. (A) Workflow diagram of tile selection for feature extraction and analysis. Shown is a randomly selected (not necessarily representative) set of TMA cores from primary, metastatic, and recurrent tumors and the corresponding manually selected stroma tiles (green squares in cores shown at higher magnification below). The number of differentially expressed features identified through statistical analysis is shown in the Venn diagram. (B) Examples of expression boxplots for two image features differentially expressed between Primary vs. Metastasis + Recurrence groups of image tiles.
Figure 5
Figure 5
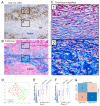
COL11A1+ ECM exhibits altered texture and organization. Tumor sections were processed for (A) COL11A1 ISH and (B) Masson’s trichrome staining. (C) COL11A1+ ECM (rectangles labeled [1] in (A,B)) contains thin linear collagen fibers while COL11A1 ECM (rectangles labeled [2] in (A,B)) contains thick curly collagen fibers. ISH, in situ hybridization; BV, blood vessel. (D) UMAP plot of images characterized by the 50 differentially expressed features identified by statistical analysis of the discovery set of Masson’s trichrome tiles with known COL11A1 status. (E,F) Examples of expression boxplots for two mean blue intensity features quantitated in (E) image areas with strong staining (an SFTA feature) and (F) the entire image. (G) Confusion matrix showing predicted COL11A1 positivity in the validation set of Masson’s trichrome images. The classifier correctly predicted COL11A1+ and COL11A1 scores in 107/151 images (70.86% accuracy).
Figure 6
Figure 6
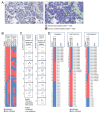
Compared to primary tumors, matched metastatic and recurrent tumors have an increased CD8+ T cell infiltration, however, CD8+ T cells are not necessarily reaching the tumor parenchyma. (A) Representative IHC staining with CD8 antibody (left panel) and QuPath annotation of the stroma- and cancer cell-associated CD8+ T cells (right panel). (B) Topography of stroma- and cancer cell-associated CD8+ T cells in matched primary, metastatic, and recurrent tumors from 40 HGSOC patients. An arbitrary threshold of 2% of CD8+ T cells was used to assign the ‘infiltrated’ or ‘not infiltrated’ phenotype. (C) Quantification of the same patients with different patterns of the ‘infiltrated’ and ‘not infiltrated’ phenotype in the stroma and cancer cell area across patient-matched primary, metastatic, and recurrent tumors. The patterns of immune infiltration are represented by diagrams. The number of patients exhibiting a specific pattern is shown on the left of each corresponding diagram. (D) Classification of the same patients into hot, cold, and excluded tumor phenotypes. EXCLUDED = infiltrated in stroma but not cancer, HOT = infiltrated in stroma and cancer, HOT CANCER = infiltrated in cancer but not stroma, COLD = not infiltrated.

References

    1. Desbois M., Udyavar A.R., Ryner L., Kozlowski C., Guan Y., Dürrbaum M., Lu S., Fortin J.P., Koeppen H., Ziai J., et al. Integrated digital pathology and transcriptome analysis identifies molecular mediators of T-cell exclusion in ovarian cancer. Nat. Commun. 2020;11:5583. doi: 10.1038/s41467-020-19408-2. - DOI - PMC - PubMed
    1. Mariathasan S., Turley S.J., Nickles D., Castiglioni A., Yuen K., Wang Y., Kadel Iii E.E., Koeppen H., Astarita J.L., Cubas R., et al. TGFbeta attenuates tumour response to PD-L1 blockade by contributing to exclusion of T cells. Nature. 2018;554:544–548. doi: 10.1038/nature25501. - DOI - PMC - PubMed
    1. Tauriello D.V.F., Palomo-Ponce S., Stork D., Berenguer-Llergo A., Badia-Ramentol J., Iglesias M., Sevillano M., Ibiza S., Canellas A., Hernando-Momblona X., et al. TGFbeta drives immune evasion in genetically reconstituted colon cancer metastasis. Nature. 2018;554:538–543. doi: 10.1038/nature25492. - DOI - PubMed
    1. Grauel A.L., Nguyen B., Ruddy D., Laszewski T., Schwartz S., Chang J., Chen J., Piquet M., Pelletier M., Yan Z., et al. TGFβ-blockade uncovers stromal plasticity in tumors by revealing the existence of a subset of interferon-licensed fibroblasts. Nat. Commun. 2020;11:6315. doi: 10.1038/s41467-020-19920-5. - DOI - PMC - PubMed
    1. Salmon H., Franciszkiewicz K., Damotte D., Dieu-Nosjean M.C., Validire P., Trautmann A., Mami-Chouaib F., Donnadieu E. Matrix architecture defines the preferential localization and migration of T cells into the stroma of human lung tumors. J. Clin. Investig. 2012;122:899–910. doi: 10.1172/JCI45817. - DOI - PMC - PubMed