. 2022 Nov 26;11(23):3785.
doi: 10.3390/cells11233785.

SARS-CoV-2-Associated ssRNAs Activate Human Neutrophils in a TLR8-Dependent Fashion

Affiliations

SARS-CoV-2-Associated ssRNAs Activate Human Neutrophils in a TLR8-Dependent Fashion

Elisa Gardiman et al. Cells. .

Abstract

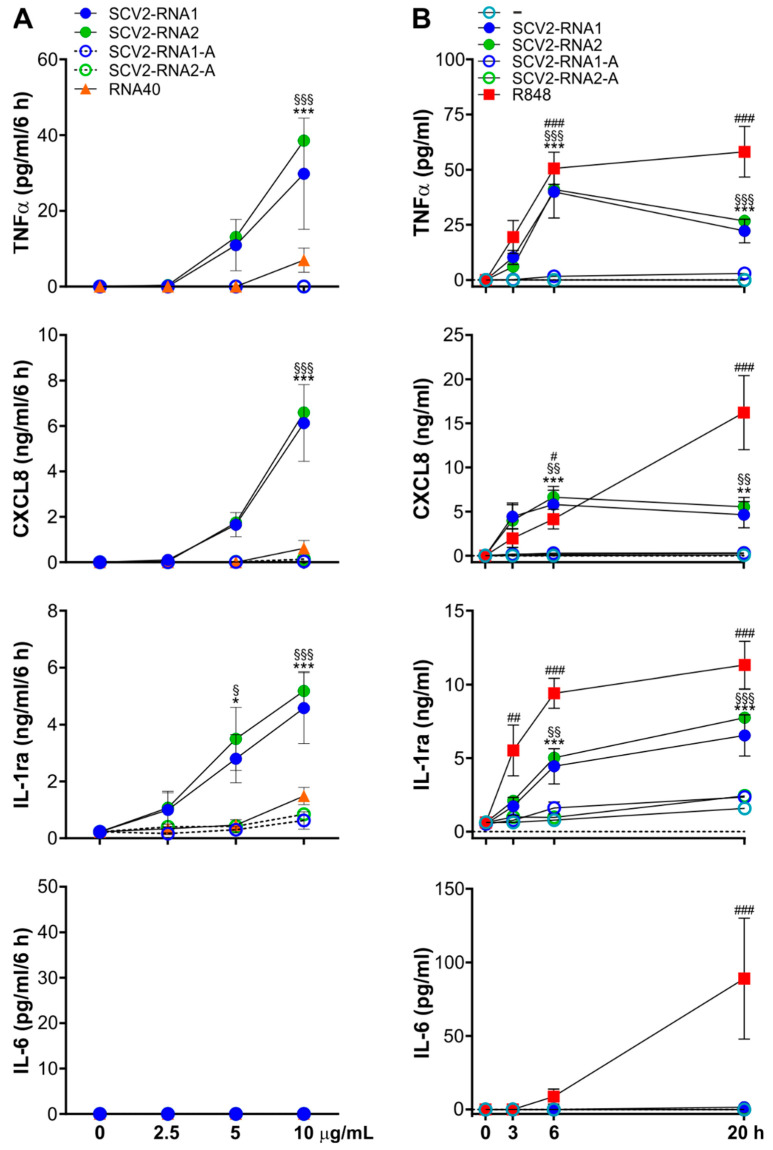
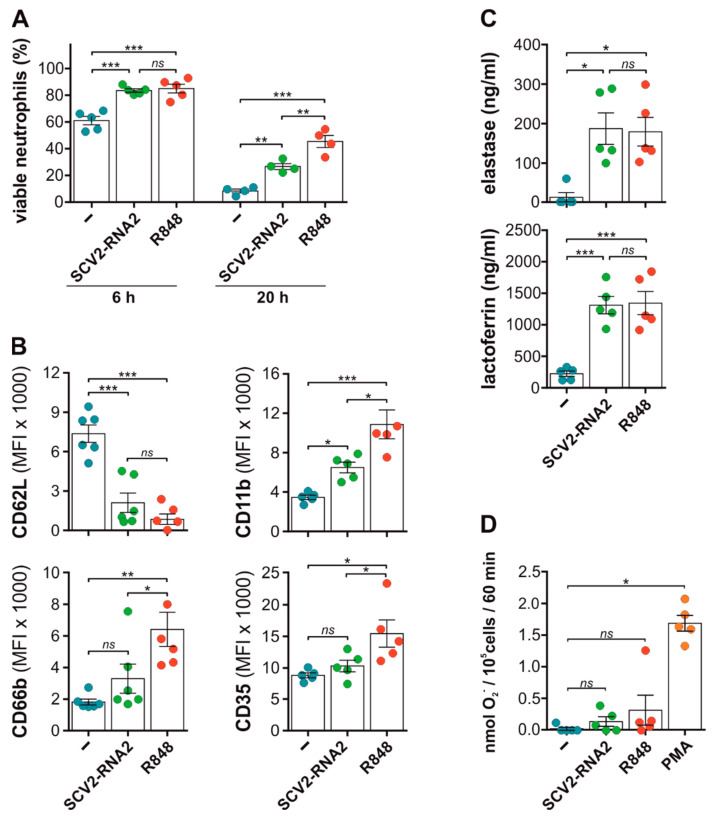
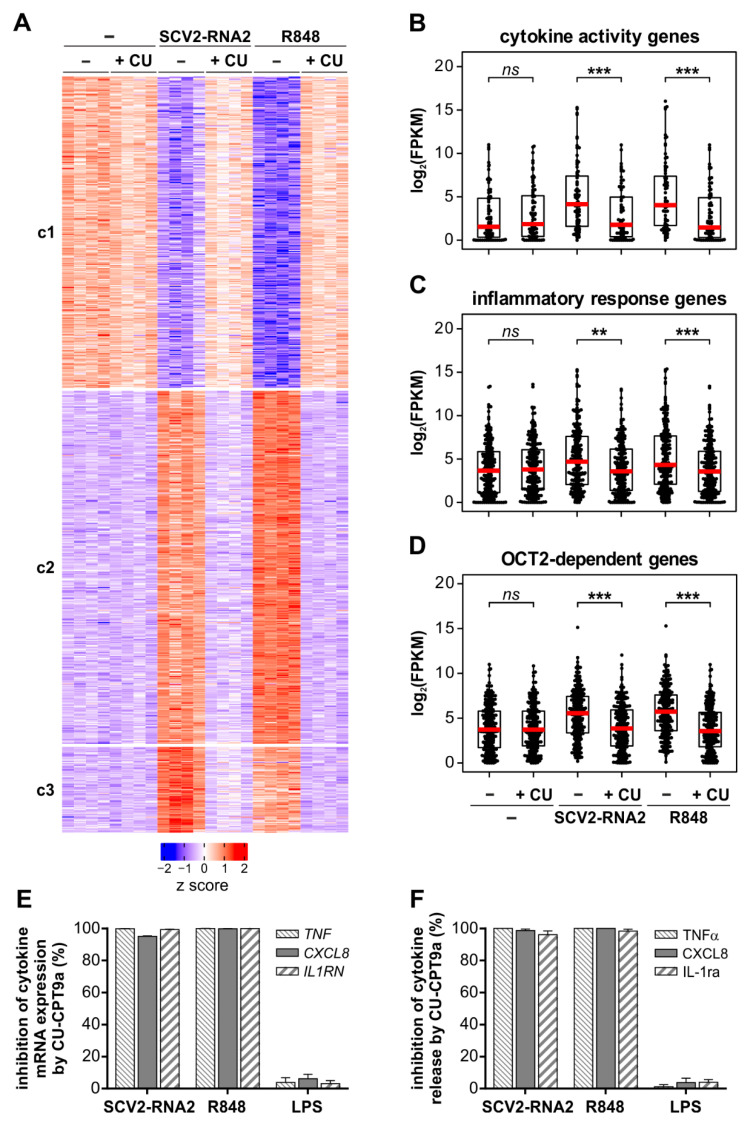
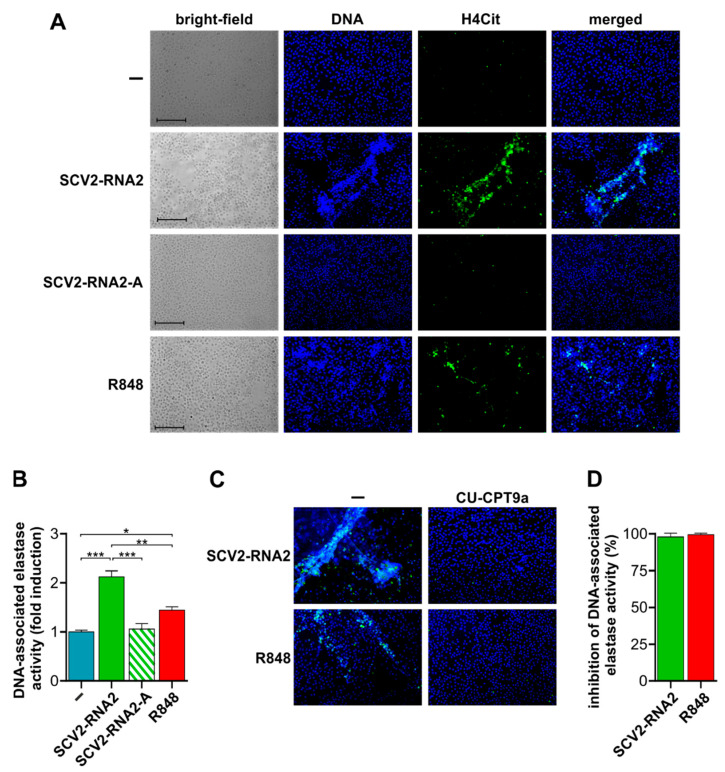
COVID-19 disease is characterized by a dysregulation of the innate arm of the immune system. However, the mechanisms whereby innate immune cells, including neutrophils, become activated in patients are not completely understood. Recently, we showed that GU-rich RNA sequences from the SARS-CoV-2 genome (i.e., SCV2-RNA1 and SCV2-RNA2) activate dendritic cells. To clarify whether human neutrophils may also represent targets of SCV2-RNAs, neutrophils were treated with either SCV2-RNAs or, as a control, R848 (a TLR7/8 ligand), and were then analyzed for several functional assays and also subjected to RNA-seq experiments. Results highlight a remarkable response of neutrophils to SCV2-RNAs in terms of TNFα, IL-1ra, CXCL8 production, apoptosis delay, modulation of CD11b and CD62L expression, and release of neutrophil extracellular traps. By RNA-seq experiments, we observed that SCV2-RNA2 promotes a transcriptional reprogramming of neutrophils, characterized by the induction of thousands of proinflammatory genes, similar to that promoted by R848. Furthermore, by using CU-CPT9a, a TLR8-specific inhibitor, we found that SCV2-RNA2 stimulates neutrophils exclusively via TLR8-dependent pathways. In sum, our study proves that single-strand RNAs from the SARS-CoV-2 genome potently activate human neutrophils via TLR8, thus uncovering a potential mechanism whereby neutrophils may contribute to the pathogenesis of severe COVID-19 disease.

Keywords: COVID-19; RNA-seq; SARS-CoV-2; TLR8; neutrophil extracellular trap; neutrophils; ssRNA.


Conflict of interest statement

The authors declare no conflict of interest.

Figures

Figure 1
Figure 1
Cytokines production in neutrophils stimulated by SCV2-RNA1 and SCV2-RNA2. Production of TNFα, CXCL8, IL-1ra, and IL-6, by ssRNA-stimulated neutrophils in (A) dose-response and (B) time course experiments. In (A) neutrophils were stimulated for six hours with 2.5, 5 and 10 µg/mL of SCV2-RNA1, SCV2-RNA1-A, SCV2-RNA2, SCV2-RNA2-A, and RNA40. In (B) neutrophils were stimulated for three, six, and 20 h with 5 µM R848 and 10 µg/mL of SCV2-RNA1, SCV2-RNA1-A, SCV2-RNA2 and SCV2-RNA2-A. (A,B) Supernatants were collected, and cytokines levels were measured by ELISA. Results are expressed as the mean value ± SEM of n = 3–14 independent experiments. */§/# p < 0.05, **/§§/## p < 0.01, ***/§§§/### p < 0.001 by two-way ANOVA corrected for Tukey (A) or Dunnett’s (B) multiple comparisons test. § symbol indicates statistically significant differences between SCV2-RNA1 and SCV2-RNA1-A (A) or unstimulated cells (B), * symbol indicates statistically significant differences between SCV2-RNA2 and SCV2-RNA2-A (A) or unstimulated cells (B), # symbol indicates statistically significant differences between unstimulated cells and R848 (B).
Figure 2
Figure 2
SCV2-RNA2 efficiently activates neutrophil effector functions. (A,B) Neutrophils were incubated for six (A,B) or 20 h (A) with or without 10 µg/mL SCV2-RNA2 or 5 µM R848. Cells were then collected, and neutrophil viability (A) and surface marker expression (B) were evaluated by flow cytometry. (A) Histograms show the percentage of viable cells (mean ± SEM, n = 4–5) defined as Vybrant™/Sytox™ double negative cell population (see Section 2). (B). After stimulation, neutrophils were incubated with specific fluorochrome-conjugated antibodies anti-CD66b, -CD11b, -CD62L, and -CD35 to evaluate their membrane expression by flow cytometry. Histograms show the median of the mean fluorescence intensity (MFI) ± SEM, obtained from n = 5–6 independent experiments. (C) Release of granule protein in stimulated neutrophils. Neutrophils were incubated for three hours with or without 5 µM R848 and 10 µg/mL SCV2-RNA2 and supernatants were collected. The release of elastase (upper panel) and lactoferrin (lower panel) was assessed by ELISA assays. Results are expressed as mean value ±SEM from n = 4–5 independent experiments. (AC) * p < 0.05, ** p < 0.01, *** p < 0.001, analysis was performed using one-way ANOVA corrected for Holm–Sidak’s multiple comparison test. (D) Superoxide anion (O2) production in SCV2-RNA2 stimulated neutrophils. Isolated neutrophils were left untreated or stimulated with 10 µg/mL SCV2-RNA2, 5 µM R848 and 20 ng/mL PMA. Histograms show the amount of nmol of O2 produced by neutrophils after 60 min of stimulation, measured by cytochrome C reduction assay (see Section 2). Results are expressed as the mean value ±SEM of n = 5 independent experiments. ns (not significant) p > 0.05, * p < 0.05, ** p < 0.01, *** p < 0.001, by Kruskal–Wallis and Dunn’s post hoc test. (AD) Results for every experiment are indicated by colored dots.
Figure 3
Figure 3
Gene expression profile of neutrophils treated with SCV2-RNA2 or R848. (A,B) Volcano plot displaying differentially expressed genes (DEGs) in neutrophils incubated with SCV2-RNA2 (A) or R848 (B) for six hours. Each dot in the plot represents a single DEG. DEGs showing significantly increased or decreased expression (p < 0.01, calculated by Wald’s test) are marked by red and blue dots, respectively, while genes not significantly modulated by stimulation are shown as grey dots. (C) A PCA scatterplot based on the DEGs identified among neutrophils incubated with or without SCV2-RNA2 or R848 for six hours. Blue, red, and green circles represent, respectively, samples from resting, R848-stimulated, and SCV2-RNA2-stimulated cells (n = 4). (D) Heatmap displaying the expression patterns of the gene clusters (c1–c3) resulting from the k-means clustering analysis of DEGs. Relative expression levels for a single transcript were calculated by z score. Selected genes of each cluster are depicted on the right y axis. (E) KEGG pathways enriched by genes associated with the gene cluster c2. No statistically significant enriched KEGG pathways were present in c1 and c3. The top 10 KEGG pathways with Benjamini–Hochberg-corrected p values < 0.05 (one-sided Fisher’s exact test) are shown. ‘Counts’ indicate the fraction of DEGs present in the given KEGG pathway. (F) Heatmap representations of gene set variation analysis (GSVA) comparisons among untreated and SCV2-RNA2- or R848-treated neutrophil. Gene set signatures were obtained from KEGG pathways enriched in c2 (E). Color intensity of the squares is indicative of the GSVA score, which varies from 1 (maximal signature enrichment, indicated by red) to −1 (absent signature enrichment, indicated by blue).
Figure 4
Figure 4
Effects of TLR8 inhibition in the transcriptome profiles of SCV2-RNA2 or R848 treated neutrophils, in cytokine mRNA expression and release. Neutrophils were stimulated with 10 µg/mL SCV2-RNA2 and 5 µM R848 in the presence or absence of the TLR8-specific inhibitor CU-CTP9a (10 µM) and subjected to RNA-seq analysis. (A) Heatmap displaying the expression patterns of the gene cluster (c1–c3) resulting from the k-means clustering analysis of DEGs from Figure 3D. Relative expression levels for a single transcript were calculated by z score. (BD) Box plots showing the distribution of mRNA expression levels [as log2(FPKM + 1)] for genes associated with the GO terms “cytokine activity” (B) and “inflammatory response” (C), and for OCT2-dependent genes (D). The box plot shows the median (red line) with the lower and upper quartiles representing a 25th to 75th percentile range. (BD) Asterisks stand for significant inhibition caused by CU-CPT9a treatment (ns p > 0.05, ** p < 0.01,*** p < 0.001 by Wilcoxon signed-rank test). (E,F) Neutrophils were pretreated for 30 min with 20 μM CU-CPT9a and then incubated for six hours with 5 μM R848, 10 µg/mL of SCV2-RNA2, or 1 μg/mL LPS. Cells were then lysed for RNA extraction (E) and cell-free supernatant was collected for evaluation of cytokine release (F). The mRNA expression and release (F) of TNFα, CXCL8, and IL-1ra were measured by RT-qPCR and ELISA, respectively. Graphs depict the percentage of inhibition exerted by CU-CPT9a expressed as mean ± SEM, n = 4.
Figure 5
Figure 5
SCV2-RNA2 efficiently stimulates neutrophil extracellular trap (NET) formation which is blocked by TLR8 inhibition. Isolated neutrophils were left untreated (-) or stimulated with 10 µg/mL SCV2-RNA2, 10 µg/mL SCV2-RNA2-A, or 5 µM R848 for one hour (A) and four hours (B). (A) NETs were identified, using fluorescence microscopy, by the co-localization of citrullinated histone-4 (H4Cit) stained in green (AF-488) and DNA stained in blue (Hoechst). Bright-field images are also shown. Scale bar: 100 µm. (B) NETs were also quantified in cell supernatants by analyzing DNA-associated elastase activity after a limited DNase I digestion. Elastase activity associated with DNA was quantified by a fluorogenic elastase substrate and monitored with a fluorescent plate reader. Results are expressed as fold induction of elastase activity compared to unstimulated cells. * p < 0.05, ** p < 0.01, *** p < 0.001, one-way ANOVA followed by Tukey’s post hoc test. (C,D) Isolated neutrophils were pre-treated with or without 5 μM CU-CTP9a for 30 min and left untreated or stimulated with 10 µg/mL SCV2-RNA2 or 5 µM R848 for one hour (C) or four hours (D). (C) Merged images of NETs as identified in panel A. Scale bar: 100 µm. Representative experiments out of three. (D) NETs were quantified in cell supernatants by analyzing DNA-associated elastase activity after a limited DNase I digestion. Graphs depict the percentage of inhibition exerted by CU-CPT9a expressed as mean ± SEM, n = 3.

Similar articles

Cited by

References

    1. Dong E., Du H., Gardner L. An interactive web-based dashboard to track COVID-19 in real time. Lancet Infect. Dis. 2020;20:533–534. doi: 10.1016/S1473-3099(20)30120-1. - DOI - PMC - PubMed
    1. Hu B., Guo H., Zhou P., Shi Z.-L. Characteristics of SARS-CoV-2 and COVID-19. Nat. Rev. Microbiol. 2021;19:141–154. doi: 10.1038/s41579-020-00459-7. - DOI - PMC - PubMed
    1. Lu R., Zhao X., Li J., Niu P., Yang B., Wu H., Wang W., Song H., Huang B., Zhu N., et al. Genomic characterisation and epidemiology of 2019 novel coronavirus: Implications for virus origins and receptor binding. Lancet. 2020;395:565–574. doi: 10.1016/S0140-6736(20)30251-8. - DOI - PMC - PubMed
    1. Wang M.-Y., Zhao R., Gao L.-J., Gao X.-F., Wang D.-P., Cao J.-M. SARS-CoV-2: Structure, Biology, and Structure-Based Therapeutics Development. Front. Cell Infect. Microbiol. 2020;10:587269. doi: 10.3389/fcimb.2020.587269. - DOI - PMC - PubMed
    1. Gupta A., Madhavan M.V., Sehgal K., Nair N., Mahajan S., Sehrawat T.S., Bikdeli B., Ahluwalia N., Ausiello J.C., Wan E.Y., et al. Extrapulmonary manifestations of COVID-19. Nat. Med. 2020;26:1017–1032. doi: 10.1038/s41591-020-0968-3. - DOI - PMC - PubMed