. 2022 Nov 26;11(23):3789.
doi: 10.3390/cells11233789.

Efficacy of Clinically Used PARP Inhibitors in a Murine Model of Acute Lung Injury

Affiliations

Efficacy of Clinically Used PARP Inhibitors in a Murine Model of Acute Lung Injury

Vanessa Martins et al. Cells. .

Abstract

Poly(ADP-ribose) polymerase 1 (PARP1), as a potential target for the experimental therapy of acute lung injury (ALI), was identified over 20 years ago. However, clinical translation of this concept was not possible due to the lack of clinically useful PARP inhibitors. With the clinical introduction of several novel, ultrapotent PARP inhibitors, the concept of PARP inhibitor repurposing has re-emerged. Here, we evaluated the effect of 5 clinical-stage PARP inhibitors in oxidatively stressed cultured human epithelial cells and monocytes in vitro and demonstrated that all inhibitors (1-30 µM) provide a comparable degree of cytoprotection. Subsequent in vivo studies using a murine model of ALI compared the efficacy of olaparib and rucaparib. Both inhibitors (1-10 mg/kg) provided beneficial effects against lung extravasation and pro-inflammatory mediator production-both in pre- and post-treatment paradigms. The underlying mechanisms include protection against cell dysfunction/necrosis, inhibition of NF-kB and caspase 3 activation, suppression of the NLRP3 inflammasome, and the modulation of pro-inflammatory mediators. Importantly, the efficacy of PARP inhibitors was demonstrated without any potentiation of DNA damage, at least as assessed by the TUNEL method. These results support the concept that clinically approved PARP inhibitors may be repurposable for the experimental therapy of ALI.

Keywords: cell death; cytokines; inflammation; olaparib.


Conflict of interest statement

The authors declare no conflict of interest.

Figures

Figure 1
Figure 1
Experimental design used for the in vivo experiments.
Figure 2
Figure 2
Effect of the clinical-stage PARP inhibitors olaparib or rucaparib on H2O2-induced suppression of cellular MTT-converting activity in U937 cells. Cells were treated for 2 h (A) or 24 h (B) with 600 µM H2O2; the PARP inhibitors were applied at different concentrations (1, 3, 10, and 30 µM). * p < 0.05 and ** p < 0.01 indicate the beneficial effect of PARP inhibition to counteract the effect of oxidative stress. Data are shown as mean ± SEM of n = 5 independent experiments.
Figure 3
Figure 3
Effect of the clinical-stage PARP inhibitors olaparib or rucaparib on H2O2-induced cell necrosis in U937 cells. Cells were treated for 2 h (A) or 24 h (B) with 600 µM H2O2; the PARP inhibitors were applied at different concentrations (1, 3, 10, and 30 µM). Cell necrosis was measured by measurement of LDH levels in the supernatant. * p < 0.05 and ** p < 0.01 indicate the beneficial effect of PARP inhibition to counteract the effect of oxidative stress. Data are shown as mean ± SEM of n = 5 independent experiments.
Figure 4
Figure 4
Effect of the clinical-stage PARP inhibitors talazoparib, veliparib, or niraparib on H2O2-induced suppression of cellular MTT-converting activity in U937 cells. Cells were treated for 2 h (A) or 24 h (B) with 600 µM H2O2; the PARP inhibitors were applied at different concentrations (1, 3, 10, and 30 µM). * p < 0.05 and ** p < 0.01 indicate the beneficial effect of PARP inhibition to counteract the effect of oxidative stress. Data are shown as mean ± SEM of n = 5 independent experiments.
Figure 5
Figure 5
Effect of the clinical-stage PARP inhibitors talazoparib, veliparib, or niraparib on H2O2-induced cell necrosis in U937 cells. Cells were treated for 2 h (A) or 24 h (B) with 600 µM H2O2; the PARP inhibitors were applied at different concentrations (1, 3, 10, and 30 µM). Cell necrosis was measured by measurement of LDH levels in the supernatant. ** p < 0.01 indicates the beneficial effect of PARP inhibition to counteract the effect of oxidative stress. Data are shown as mean ± SEM of n = 5 independent experiments.
Figure 6
Figure 6
Effect of the clinical-stage PARP inhibitors olaparib or rucaparib on H2O2-induced suppression of cellular MTT-converting activity in BEAS-2B cells. Cells were treated for 2 h (A) or 24 h (B) with 30 µM H2O2; the PARP inhibitors were applied at different concentrations (1, 3, 10, and 30 µM). * p < 0.05 indicates the beneficial effect of PARP inhibition to counteract the effect of oxidative stress. Data are shown as mean ± SEM of n = 5 independent experiments.
Figure 7
Figure 7
Effect of the clinical-stage PARP inhibitors olaparib or rucaparib on H2O2-induced cell necrosis in BEAS-2B cells. Cells were treated for 2 h (A) or 24 h (B) with 30 µM H2O2; the PARP inhibitors were applied at different concentrations (1, 3, 10, and 30 µM). Cell necrosis was measured by measurement of LDH levels in the supernatant. * p < 0.05 and ** p < 0.01 indicate the beneficial effect of PARP inhibition to counteract the effect of oxidative stress. Data are shown as mean ± SEM of n = 5 independent experiments.
Figure 8
Figure 8
Effect of the clinical-stage PARP inhibitors talazoparib, veliparib, or niraparib on H2O2-induced suppression of cellular MTT-converting activity in BEAS-2B cells. Cells were treated for 2 h (A) or 24 h (B) with 30 µM H2O2; the PARP inhibitors were applied at different concentrations (1, 3, 10, and 30 µM). * p < 0.05 and ** p < 0.01 indicate the beneficial effect of PARP inhibition to counteract the effect of oxidative stress. Data are shown as mean ± SEM of n = 5 independent experiments.
Figure 9
Figure 9
Effect of the clinical-stage PARP inhibitors talazoparib, veliparib, or niraparib on H2O2-induced cell necrosis in BEAS-2B cells. Cells were treated for 2 h (A) or 24 h (B) with 30 µM H2O2; the PARP inhibitors were applied at different concentrations (1, 3, 10, and 30 µM). Cell necrosis was measured by measurement of LDH levels in the supernatant. * p < 0.05 and ** p < 0.01 indicate the effect of PARP inhibition in oxidatively stressed cells. Data are shown as mean ± SEM of n = 5 independent experiments.
Figure 10
Figure 10
Effect of various clinical-stage PARP inhibitors on H2O2-induced DNA damage in (A) U937 and (B) BEAS-2B cells. U937 or BEAS-2B cells were treated for 2 h with 600 µM or 30 µM H2O2, respectively; the PARP inhibitors were added at different concentrations (3 and 30 µM). After 24 h, DNA damage was measured by the TUNEL assay. * p < 0.05 and ** p < 0.01 indicate the beneficial effect of the PARP inhibitors tested to reduce the degree of DNA damage in H2O2-treated cells. Data are shown as mean ± SEM of n = 5 independent experiments.
Figure 11
Figure 11
Effect of olaparib and rucaparib on lung histology in a murine model of ALI. C57Bl/6 mice received either PBS (30 µL) or LPS (50 µg in 30 µL PBS) by intratracheal instillation (n = 8 and 12, respectively). After 24 h, lung tissues were analyzed histologically. Representative histological pictures are shown. Please note the increased cell infiltration and inflammation after LPS and the improvement by either of the two PARP inhibitors in the LPS-treated animals.
Figure 12
Figure 12
Effect of olaparib and rucaparib on the protein and cell content of bronchoalveolar lavage fluid in a murine model of ALI. C57Bl/6 mice received either PBS (30 µL) or LPS (50 µg in 30 µL PBS) by intratracheal instillation in the absence or presence of various doses (1, 3, or 10 mg/kg) of olaparib or rucaparib. After 24 h, bronchoalveolar lavage fluid was collected, protein content was measured, and inflammatory cell numbers (total cell count as well as neutrophils and mononuclear cells) were quantified. ** p < 0.01 indicates the beneficial effect of the PARP inhibitors tested in LPS-treated animals. Data are shown as mean ± SEM, n = 8–12/group.
Figure 13
Figure 13
Effect of olaparib and rucaparib on DNA damage in the lung in a murine model of ALI. Representative histological images are shown. Note the increased number of TUNEL-positive cells (brown dots) after LPS and the fewer number of TUNEL-positive cells in the groups treated with the PARP inhibitors. Data were quantified and are expressed in numerical units in Figure 14.
Figure 14
Figure 14
Effect of olaparib and rucaparib on DNA damage in the lung in a murine model of ALI. C57Bl/6 mice received either PBS (30 µL) or LPS (50 µg in 30 µL PBS) by intratracheal instillation in the absence or presence of various doses (1, 3, or 10 mg/kg) of olaparib or rucaparib. After 24 h, DNA damage in the lung was quantified by the TUNEL assay. Top panels show representative histological images. ** p < 0.01 indicates the beneficial effect of the PARP inhibitors tested. Data are shown as mean ± SEM, n = 8–12/group.
Figure 15
Figure 15
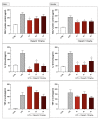
Bronchoalveolar lavage fluid in a murine model of ALI. C57Bl/6 mice received either PBS (30 µL) or LPS (50 µg in 30 µL PBS) by intratracheal instillation in the absence or presence of various doses (1, 3, or 10 mg/kg) of olaparib or rucaparib. After 24 h, bronchoalveolar lavage fluid was collected, and TNFα, IL-1β, IL-6, and MIP-1α or neutrophil elastase levels were measured. * p < 0.05 and ** p < 0.01 indicates inhibitory effects of the PARP inhibitors tested on various mediator levels in LPS-treated animals. Data are shown as mean ± SEM, n = 8–12/group.
Figure 16
Figure 16
Effect of olaparib and rucaparib on NF-κB, caspase 3, ERK2/ERK1 and pAKT/AKT levels in the lung tissue in a murine model of ALI. C57Bl/6 mice received either PBS (30 µL) or LPS (50 µg in 30 µL PBS) by intratracheal instillation in the absence or presence of various doses (1, 3, or 10 mg/kg) of olaparib or rucaparib. After 24 h, lungs were collected, and NF-κB (65 kDa) and caspase 3 levels, ERK1/ERK2 ratio, and pAKT/AKT ratio were measured by Western blotting. * p < 0.05 indicates an inhibitory effect of the PARP inhibitors tested in LPS-treated animals. Data are shown as mean ± SEM, n = 8–12/group.
Figure 17
Figure 17
Effect of olaparib and rucaparib on NLPR3 inflammasome activation and β-catenin expression in the lung tissue in a murine model of ALI. C57Bl/6 mice received either PBS (30 µL) or LPS (50 µg in 30 µL PBS) by intratracheal instillation in the absence or presence of various doses (1, 3, or 10 mg/kg) of olaparib or rucaparib. After 24 h, lungs were collected, and NLPR3 inflammasome activation and β-catenin expression were measured by Western blotting. * p < 0.05 indicates an inhibitory effect of the PARP inhibitors tested in LPS-treated animals. Data are shown as mean ± SEM, n = 8–12/group.
Figure 18
Figure 18
Effect of olaparib post-treatment on lung histology in a murine model of ALI. C57Bl/6 mice received either PBS (30 µL) or LPS (50 µg in 30 µL PBS) by intratracheal instillation in the absence or presence of 10 mg/kg olaparib delayed to 1, 2, or 3 h post-LPS. After 24 h, lung tissues were analyzed histologically. Representative histological pictures are shown. Please note the increased cell infiltration and inflammation after LPS and the improvement by olaparib in the LPS-treated animals.
Figure 19
Figure 19
Effect of olaparib post-treatment on the protein and cell content of bronchoalveolar lavage fluid in a murine model of ALI. C57Bl/6 mice received either PBS (30 µL) or LPS (50 µg in 30 µL PBS) by intratracheal instillation in the absence or presence of 10 mg/kg olaparib, delayed to 1, 2, or 3 h post-LPS. After 24 h, bronchoalveolar lavage fluid was collected, and protein content was measured, and inflammatory cell numbers (total cell count as well as neutrophils and mononuclear cells) were quantified. * p < 0.05 indicates the beneficial effect of olaparib in LPS-treated animals. Data are shown as mean ± SEM, n = 8–12/group.
Figure 20
Figure 20
Effect of olaparib post-treatment on DNA damage in the lung in a murine model of ALI. C57Bl/6 mice received either PBS (30 µL) or LPS (50 µg in 30 µL PBS) by intratracheal instillation in the absence or presence of 10 mg/kg olaparib, delayed to 1, 2, or 3 h post-LPS. After 24 h, DNA damage in the lung was quantified by the TUNEL assay. ** p < 0.01 indicates the beneficial effect of olaparib against DNA damage in LPS-treated animals. Data are shown as mean ± SEM, n = 8–12/group.
Figure 21
Figure 21
Effect of olaparib post-treatment on selected cytokine and chemokine levels in the bronchoalveolar lavage fluid in a murine model of ALI. C57Bl/6 mice received either PBS (30 µL) or LPS (50 µg in 30 µL PBS) by intratracheal instillation in the absence or presence of 10 mg/kg olaparib, delayed to 1, 2, or 3 h post-LPS. After 24 h, bronchoalveolar lavage fluid was collected, and mediator levels were measured. * p < 0.05 and ** p < 0.01 indicate the beneficial effect of olaparib in LPS-treated animals. Data are shown as mean ± SEM, n = 8–12/group.
Figure 22
Figure 22
Effect of olaparib post-treatment on NF-κB, caspase 3, ERK2/ERK1, and pAKT/AKT levels in the lung tissue in a murine model of ALI. C57Bl/6 mice received either PBS (30 µL) or LPS (50 µg in 30 µL PBS) by intratracheal instillation in the absence or presence of 10 mg/kg olaparib, delayed to 1, 2, or 3 h post-LPS. After 24 h, lungs were collected, and NF-κB (65 kDa) and caspase 3 levels, ERK1/ERK2 ratio, and pAKT/AKT ratio were measured by Western blotting. * p < 0.05 and ** p < 0.01 indicate inhibitory effects of olaparib on the various parameters in LPS-treated animals. Data are shown as mean ± SEM, n = 8–12/group.
Figure 23
Figure 23
Effect of olaparib post-treatment on NLPR3 inflammasome activation and β-catenin expression in the lung tissue in a murine model of ALI. C57Bl/6 mice received either PBS (30 µL) or LPS (50 µg in 30 µL PBS) by intratracheal instillation in the absence or presence of 10 mg/kg olaparib, delayed to 1, 2, or 3 h post-LPS. After 24 h, lungs were collected, and NLPR3 inflammasome activation and β-catenin expression were measured by Western blotting. * p < 0.05 and ** p < 0.01 indicate inhibitory effects of olaparib in LPS-treated animals. Data are shown as mean ± SEM, n = 8–12/group.
Figure 24
Figure 24
Lack of sex difference in the effect of PARP inhibitors in the LPS-induced ALI model in mice in the pre-treatment paradigm. C57Bl/6 mice received either PBS (30 µL) or LPS (50 µg in 30 µL PBS) by intratracheal instillation in the absence or presence of various doses (1, 3, or 10 mg/kg) of olaparib or rucaparib pre-treatment. After 24 h, bronchoalveolar lavage fluid was collected, and protein content, TNFα, and IL-1β levels were measured. * p < 0.05 indicates inhibitory effects of the PARP inhibitors tested in LPS-treated animals. Data are shown as mean ± SEM, n = 4–6/group.
Figure 25
Figure 25
Lack of sex difference in the effect of olaparib in the LPS-induced ALI model in mice in the post-treatment paradigm. C57Bl/6 mice received either PBS (30 µL) or LPS (50 µg in 30 µL PBS) by intratracheal instillation in the absence or presence of 10 mg/kg of olaparib, applied 1, 2, or 3 h after LPS challenge. After 24 h, bronchoalveolar lavage fluid was collected, and protein content, TNFα, and IL-1β levels were measured. * p < 0.05 indicates inhibitory effects of olaparib in LPS-treated animals. Data are shown as mean ± SEM, n = 4–6/group.

References

    1. Jagtap P., Szabo C. Poly(ADP-ribose) polymerase and the therapeutic effects of its inhibitors. Nat. Rev. Drug Discov. 2005;4:421–440. doi: 10.1038/nrd1718. - DOI - PubMed
    1. Pacher P., Szabo C. Role of the peroxynitrite-poly(ADP-ribose) polymerase pathway in human disease. Am. J. Pathol. 2008;173:2–13. doi: 10.2353/ajpath.2008.080019. - DOI - PMC - PubMed
    1. Gupte R., Liu Z., Kraus W.L. PARPs and ADP-ribosylation: Recent advances linking molecular functions to biological outcomes. Genes Dev. 2017;31:101–126. doi: 10.1101/gad.291518.116. - DOI - PMC - PubMed
    1. Eisemann T., Pascal J.M. Poly(ADP-ribose) polymerase enzymes and the maintenance of genome integrity. Cell Mol. Life Sci. 2020;77:19–33. doi: 10.1007/s00018-019-03366-0. - DOI - PMC - PubMed
    1. Curtin N.J., Szabo C. Poly(ADP-ribose) polymerase inhibition: Past, present and future. Nat. Rev. Drug. Discov. 2020;19:711–736. doi: 10.1038/s41573-020-0076-6. - DOI - PubMed

Substances