. 2022 Nov 27;11(23):3800.
doi: 10.3390/cells11233800.

Anatomical Development of the Cerebellothalamic Tract in Embryonic Mice

Affiliations

Anatomical Development of the Cerebellothalamic Tract in Embryonic Mice

Daniël B Dumas et al. Cells. .

Abstract

The main connection from cerebellum to cerebrum is formed by cerebellar nuclei axons that synapse in the thalamus. Apart from its role in coordinating sensorimotor integration in the adult brain, the cerebello-thalamic tract (CbT) has also been implicated in developmental disorders, such as autism spectrum disorders. Although the development of the cerebellum, thalamus and cerebral cortex have been studied, there is no detailed description of the ontogeny of the mammalian CbT. Here we investigated the development of the CbT at embryonic stages using transgenic Ntsr1-Cre/Ai14 mice and in utero electroporation of wild type mice. Wide-field, confocal and 3D light-sheet microscopy of immunohistochemical stainings showed that CbT fibers arrive in the prethalamus between E14.5 and E15.5, but only invade the thalamus after E16.5. We quantified the spread of CbT fibers throughout the various thalamic nuclei and found that at E17.5 and E18.5 the ventrolateral, ventromedial and parafascicular nuclei, but also the mediodorsal and posterior complex, become increasingly innervated. Several CbT fiber varicosities express vesicular glutamate transporter type 2 at E18.5, indicating cerebello-thalamic synapses. Our results provide the first quantitative data on the developing murine CbT, which provides guidance for future investigations of the impact that cerebellum has on thalamo-cortical networks during development.

Keywords: cerebello-thalamic tract; cerebellum; embryonic development; mouse; thalamus.


Conflict of interest statement

The authors declare no conflict of interest.

Figures

Figure 1
Figure 1
Example of NeuN and RFP staining in adult CN. (A) 20× tilescan of a coronal P48 cerebellar slice, zoomed in on the left CN. Stainings: red fluorescent protein (RFP) in red, NeuN in green, yellow indicating colocalization of these two stainings. (BD) Zoom in of boxed region in (A). (B) NeuN stained cells. (C) RFP-stained cells and fibers. (D) Merge of B and C. Note that the RFP+ neurons are relatively big and all small neurons are RFP. A bar plot representation of the quantification of RFP+ cells as a proportion of NeuN+ cells (N = 3 mice). Scale bars: (A) = 150 µm, (BD) = 25 µm. CN = cerebellar nuclei, MCN = medial cerebellar nucleus, Int = interposed nucleus, LCN = lateral cerebellar nucleus.
Figure 2
Figure 2
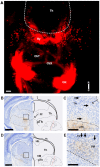
RFP+ fibers in the prethalamus at E15.5 and E16.5. (A,B) A sagittal section at E15.5 showing the presence of DAB-stained RFP+ fibers in the pTh and absence of RFP+ fibers in the thalamus at this age. Counterstained with thionin. Finer dotted line outlines RFP+ fibers. (C,D) Coronal section of an E16.5 mouse brain with inset, respectively, showing presence of DAB-stained RFP+ fibers in the pTh and absence of RFP+ fibers in the thalamus at this age. Counterstained with thionin. Inset in (C) indicating the rostro-caudal level and angle of the coronal slice with the red line. Scale bars: (A) = 100 µm, (B) = 50 µm, (C) = 250 µm, (D) = 100 µm. Hy = hypothalamus, Th = thalamus, pTh = prethalamus.
Figure 3
Figure 3
RFP+ fibers in the diencephalon at E17.5. (A) Horizontal view of a maximum intensity projection of a 3DISCO cleared E17.5 mouse brain. Compass in bottom right indicating directions of rostral (R) and caudal (C) sides. (BE) Coronal section of an E17.5 mouse brain, where (C,E) are zoomed in on the boxes in (B) and (D), respectively. In the bottom right of (B,D), schematic showing the angle and rostro-caudal level of the coronal slices. Fibers can be seen in the Th, though they are much less bundled than in the medial pTh. Scale bars: (A) = 100 µm; (B,D) = 250 µm; (C,E) = 100 µm. CbT = cerebellothalamic tract, CbX = decussation of the cerebellar tract, CN = cerebellar nuclei, fr = fasciculus retroflexus, Th = thalamus, pTh = prethalamus, Hc = hippocampus, Hb = habenula, Pf = parafascicular nucleus, VM = ventromedial nucleus.
Figure 4
Figure 4
RFP+ fibers in the diencephalon at E18.5. (A) Coronal section of an E18.5 mouse brain stained for FoxP2 (in green), calbindin (magenta) and Red Fluorescent Protein (in red) showing an example of delineation of the ventromedial (VM), posterior (POm), mediodorsal (MD), ventrobasal (VB), ventrolateral (VL), lateral posterior (LP) and dorsal lateral geniculate (dLGN) nuclei, the fasciculus retroflexus (fr) and the mamillothalamic tract (mt). Bottom right shows a schematic showing the angle and rostro-caudal level of the coronal section. (B) Zoom in of boxed region in (A). In the inset, a single axon with multiple putative boutons is visible. Arrows indicate the putative boutons. (C) Binarized version of B after applying the threshold. Inset is a binarized version of the inset in C. Scale bars: (A) = 200 µm; (B,C) = 100 µm, insets = 25 µm.
Figure 5
Figure 5
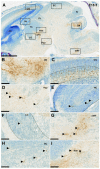
Ntsr1+ cells DAB-stained in an E18.5 embryonic mouse brain; counterstained with thionin. (A) Sagittal section showing all the regions in which Ntsr1 is expressed. Scale bar = 1000 µm (BH) 20× zoom in pictures of the CN, the Ctx, the Hyp, the HC, the LG, the mRF and the SC, respectively. (I) 20× zoom in image of a region at the interface between thalamus and pTh with Ntsr1+ cells presumably originating from the Rim. Scale bar = 100 µm. CN = cerebellar nuclei, CP = caudate putamen, Ctx = cerebral cortex, HC = hippocampus, Hyp = hypothalamus, IC = inferior colliculus, LG = lateral geniculate nucleus, mRF = medial reticular formation, Pt = pretectum, pTh = prethalamus, SC = superior colliculus, Th = thalamus.
Figure 6
Figure 6
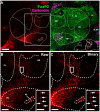
RFP+ cortical fibers entering the thalamus, specifically the ventrobasal thalamic nucleus, at E18.5. Coronal section of an E18.5 mouse brain stained for FoxP2 (in green), calbindin (magenta) and Red Fluorescent Protein (in red), with zoomed-in inset, showing the RFP+ corticothalamic fibers and another, separate, RFP+ fiber bundle, presumably originating from the cerebellar nuclei. Top right, schematic showing the angle and rostro-caudal level of the coronal slices. Scale bars: main image = 250 µm, inset = 100 µm. CT-tract = corticothalamic tract, VB = ventrobasal nucleus, VL = ventrolateral nucleus, VM = ventromedial nucleus.
Figure 7
Figure 7
EYFP+ fibers of IUE transfected cerebellum are present in the thalamus at E18.5. (A,B) EYFP+ signal in the transfected ipsilateral cerebellum. (C) EYFP+ fibers in the thalamic complex show selective innervation of particular nuclei. Note that in this sagittal section several CbT-innervated nuclei are outside the field of view, i.e., on a different level of the medio-lateral axis. Cb = cerebellum; CbT = cerebellothalamic tract; Pt = pretectum; Pf = parafascicular nucleus; VB = ventrobasal nucleus; VM = ventromedial nucleus; Rt = reticular nucleus; AC = anterior complex; LD = lateral dorsal nucleus; LP = lateral posterior nucleus.
Figure 8
Figure 8
RFP+ fibers in embryonic thalamus of Ntsr1-Cre/AI14 mice progress rostral through the ventromedial nucleus. At three rostrocaudal levels the percentage of summed area occupied by above-threshold RFP-signal (pSAO) is reported for E17.5 (AC) and E18.5 (DF). Note that the indicated percentages are not equal to those reported in Figure 9 and Figure 10, since the latter represent the averages from bilateral VM of several sections.
Figure 9
Figure 9
RFP signal quantification in the thalamic nuclei. Percentage of summed area occupied by above-threshold RFP-signal (pSAO). (A) VM (E16.5, n = 3, E17.5, n = 4, E18.5, n = 4), (B) VL (E16.5, n = 0, E17.5, n = 4, E18.5, n = 4) (C) Pf (E16.5, n = 3, E17.5, n = 5, E18.5, n = 4), (D) MD (E16.5, n = 2, E17.5, n = 5, E18.5, n = 4), (E) POm (E16.5, n = 3, E17.5, n = 5, E18.5, n = 4) (F) VB (E16.5, n = 3, E17.5, n = 5, E18.5, n = 4), (G) ML (E16.5, n = 3, E17.5, n = 5, E18.5, n = 4). Since the VL could not reliably be delineated at E16.5, as the border between VL and the intralaminar nuclei could not consistently be accurately delineated in all slices, we measured the pSAO in this nucleus at E17.5 and E18.5. Columns represent the mean; error bars represent ± SD; dots represent individual data points.
Figure 10
Figure 10
RFP signal quantification from caudal to rostral in the thalamic nuclei. The relative amount of RFP+ fibers (in %) is plotted against the relative rostral to caudal distance (in %) in VM, VL and Pf. (A,B) VM at E17.5 (n = 48) and E18.5 (n = 57), respectively, (C,D) VL at E 17.5 (n = 46) and E18.5 (n = 52), respectively, (E,F) Pf at E17.5 (n = 39) and E18.5 (n = 39), respectively. r = Spearman’s rho.
Figure 11
Figure 11
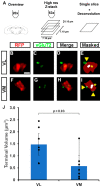
Putative boutons and colocalization with vGluT2. (A) Schematic overview of the workflow. After taking an overview image at 20×, we acquired z-stacks at 63×. Single optical slices were deconvolved and a user determined threshold was used after which we determined the overlap between fluorophores. RFP+ boutons were considered to colocalize with vGluT2 if the vGluT2-fluorescence overlapped completely in all dimensions. (BE) Example of a deconvolved image of a putative bouton in VL, with RFP in red (B), vGluT2 in green (C), colocalization of RFP and vGluT2 (D), and the result after thresholding (E). Asterisks indicate complete overlap, arrowheads indicate partial overlap, the latter of which is not considered for further analysis. (FI) as (BE) for VM. (J) Terminal volumes (in µm3) in VL and VM. Scale bars: (BI) = 1 µm.
Figure 12
Figure 12
Schematic representation of the development of the cerebellothalamic tract. (A) Sagittal representation of the development of the cerebellothalamic tract (red). (B) Coronal representation of inset in A, showing schematic representation of the invasion of cerebellothalamic fibers (red) into the thalamus. (C) Zoom in of inset in (B), showing a schematic representation of the appearance of vGluT2 positive terminals (green) in the cerebellothalamic fibers (red) at E18.5. Th = thalamus, pTh = prethalamus, Cb = cerebellum, MD = mediodorsal nucleus, VB = ventrobasal nucleus, VL = ventrolateral nucleus, VM = ventromedial nucleus.

References

    1. Gong S., Doughty M., Harbaugh C.R., Cummins A., Hatten M.E., Heintz N., Gerfen C.R. Targeting Cre Recombinase to Specific Neuron Populations with Bacterial Artificial Chromosome Constructs. J. Neurosci. 2007;27:9817–9823. doi: 10.1523/JNEUROSCI.2707-07.2007. - DOI - PMC - PubMed
    1. Madisen L., Zwingman T.A., Sunkin S.M., Oh S.W., Zariwala H.A., Gu H., Ng L.L., Palmiter R.D., Hawrylycz M.J., Jones A.R., et al. A robust and high-throughput Cre reporting and characterization system for the whole mouse brain. Nat. Neurosci. 2010;13:133–140. doi: 10.1038/nn.2467. - DOI - PMC - PubMed
    1. Belle M., Godefroy D., Dominici C., Heitz-Marchaland C., Zelina P., Hellal F., Bradke F., Chédotal A. A Simple Method for 3D Analysis of Immunolabeled Axonal Tracts in a Transparent Nervous System. Cell Rep. 2014;9:1191–1201. doi: 10.1016/j.celrep.2014.10.037. - DOI - PubMed
    1. Matsui A., Yoshida A.C., Kubota M., Ogawa M., Shimogori T. Mouse in Utero Electroporation: Controlled Spatiotemporal Gene Transfection. J. Vis. Exp. 2011;54:3024. doi: 10.3791/3024. - DOI - PMC - PubMed
    1. Jacobowitz D.M., Abbott L.C. Chemoarchitectonic Atlas of the Developing Mouse Brain. CRC Press; Boca Raton, FL, USA: 1998.

LinkOut - more resources