

Monochromatic Light Pollution Exacerbates High-Fat Diet-Induced Adipocytic Hypertrophy in Mice
- PMID: 36497068
- PMCID: PMC9737108
- DOI: 10.3390/cells11233808
Monochromatic Light Pollution Exacerbates High-Fat Diet-Induced Adipocytic Hypertrophy in Mice
Abstract
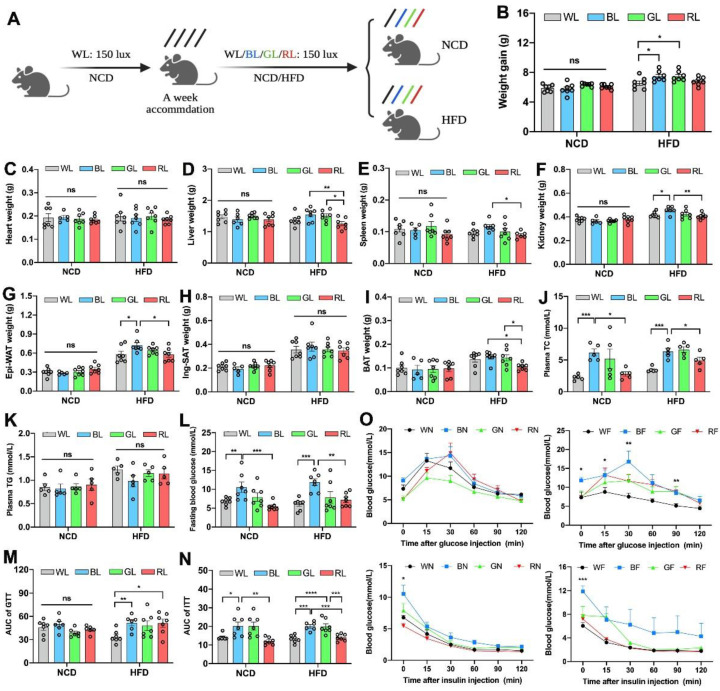
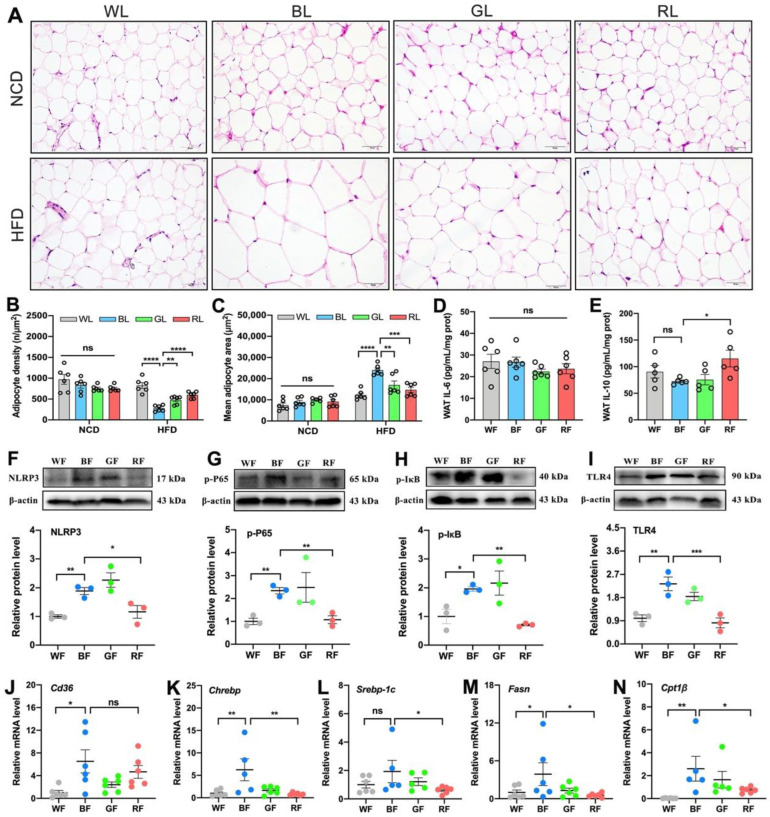
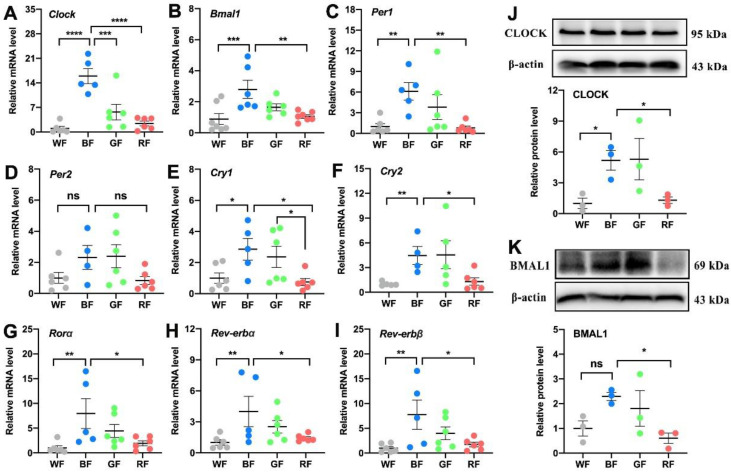
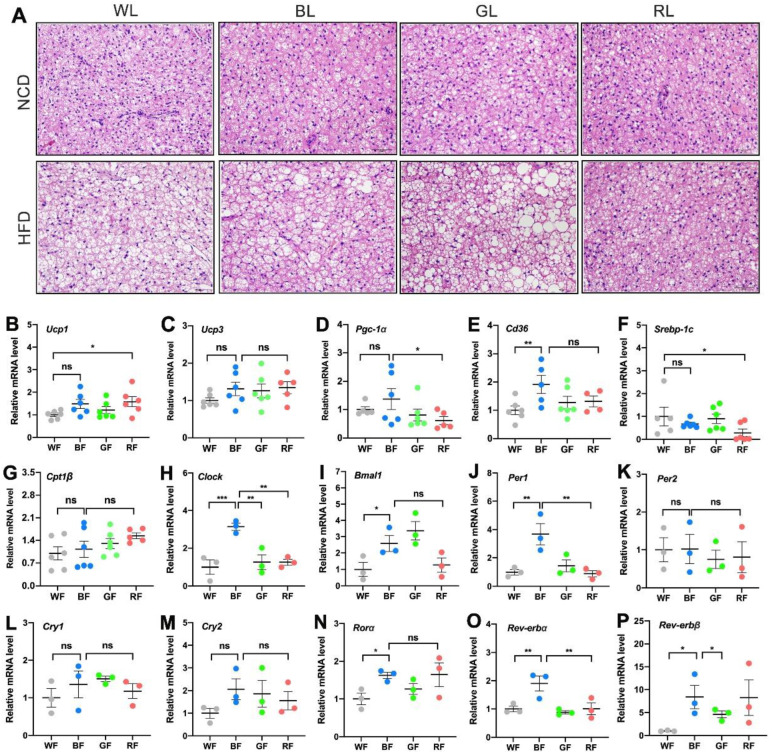
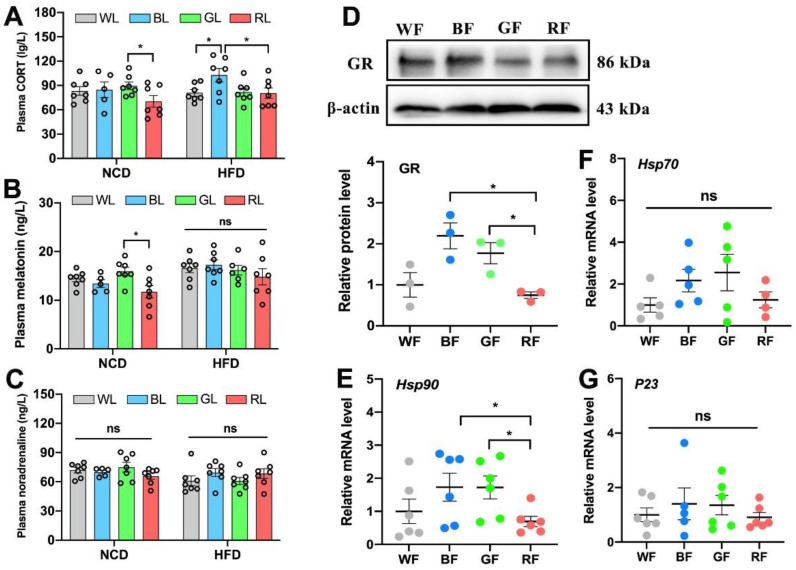
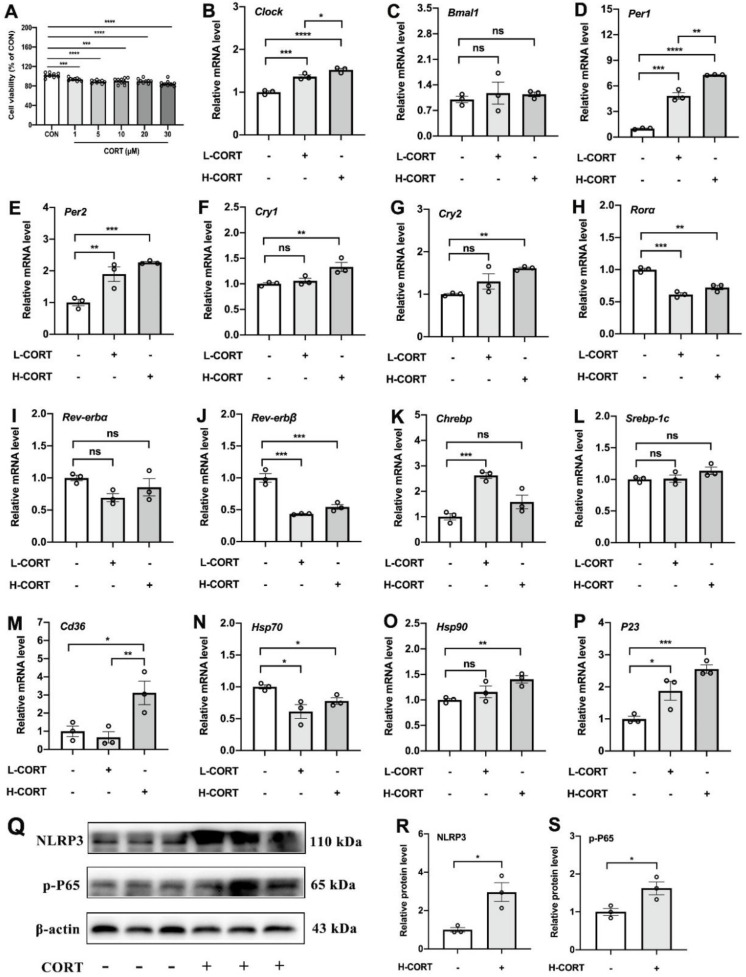
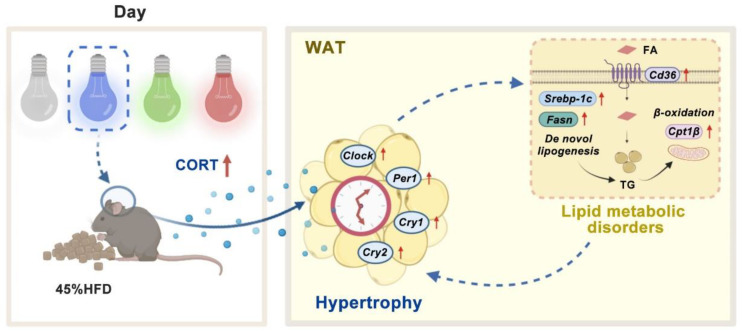
Light pollution worldwide promotes the progression of obesity, which is widely considered a consequence of circadian rhythm disruptions. However, the role of environmental light wavelength in mammalian obesity is not fully understood. Herein, mice fed a normal chow diet (NCD) or a high-fat diet (HFD) were exposed to daytime white (WL), blue (BL), green (GL), and red light (RL) for 8 weeks. Compared with WL and RL, BL significantly increased weight gain and white adipose tissue (WAT) weight, and it disrupted glucose homeostasis in mice fed with HFD but not NCD. The analysis of WAT found that BL significantly aggravated HFD-induced WAT hypertrophy, with a decrease in IL-10 and an increase in NLRP3, p-P65, p-IκB, TLR4, Cd36, Chrebp, Srebp-1c, Fasn, and Cpt1β relative to WL or RL. More interestingly, BL upregulated the expression of circadian clocks in the WAT, including Clock, Bmal1, Per1, Cry1, Cry2, Rorα, Rev-erbα, and Rev-erbβ compared with WL or RL. However, most of the changes had no statistical difference between BL and GL. Mechanistically, BL significantly increased plasma corticosterone (CORT) levels and glucocorticoid receptors in the WAT, which may account for the changes in circadian clocks. Further, in vitro study confirmed that CORT treatment did promote the expression of circadian clocks in 3T3-L1 cells, accompanied by an increase in Chrebp, Cd36, Hsp90, P23, NLRP3, and p-P65. Thus, daily BL, rather than RL exposure-induced CORT elevation, may drive changes in the WAT circadian clocks, ultimately exacerbating lipid dysmetabolism and adipocytic hypertrophy in the HFD-fed mice.
Keywords: adipose hypertrophy; circadian clocks; corticosterone; high-fat diet; monochromatic light pollution.
Conflict of interest statement
The authors declare no conflict of interest.
Figures
Similar articles
-
Dim blue light at night worsens high-fat diet-induced kidney damage via increasing corticosterone levels and modulating the expression of circadian clock genes.Ecotoxicol Environ Saf. 2025 Jan 1;289:117636. doi: 10.1016/j.ecoenv.2024.117636. Epub 2025 Jan 2. Ecotoxicol Environ Saf. 2025. PMID: 39752912
-
Effect of monochromatic light on the temporal expression of N-acetyltransferase in chick pineal gland.Chronobiol Int. 2020 Aug;37(8):1140-1150. doi: 10.1080/07420528.2020.1754846. Epub 2020 Apr 20. Chronobiol Int. 2020. PMID: 32308045
-
Monochromatic blue light not green light exposure is associated with continuous light-induced hepatic steatosis in high fat diet fed-mice via oxidative stress.Ecotoxicol Environ Saf. 2022 Jul 1;239:113625. doi: 10.1016/j.ecoenv.2022.113625. Epub 2022 May 16. Ecotoxicol Environ Saf. 2022. PMID: 35588616
-
Effect of Aerobic Exercise and Time-Restricted Feeding on Metabolic Markers and Circadian Rhythm in Mice Fed with the High-Fat Diet.Mol Nutr Food Res. 2024 Mar;68(5):e2300465. doi: 10.1002/mnfr.202300465. Epub 2024 Feb 22. Mol Nutr Food Res. 2024. PMID: 38389173
-
DHA substitution overcomes high-fat diet-induced disturbance in the circadian rhythm of lipid metabolism.Food Funct. 2020 Apr 1;11(4):3621-3631. doi: 10.1039/c9fo02606a. Epub 2020 Apr 15. Food Funct. 2020. PMID: 32292967
Cited by
-
Environmental Toxicology and Human Health.Int J Mol Sci. 2023 Dec 31;25(1):555. doi: 10.3390/ijms25010555. Int J Mol Sci. 2023. PMID: 38203725 Free PMC article.
-
Circadian Rhythms of Body Temperature and Locomotor Activity in Spontaneously Hypertensive Rats under Frequent Changes in Light Conditions.Pathophysiology. 2024 Mar 1;31(1):127-146. doi: 10.3390/pathophysiology31010010. Pathophysiology. 2024. PMID: 38535620 Free PMC article.
-
The emerging role of circadian rhythms in the development and function of thermogenic fat.Front Endocrinol (Lausanne). 2023 May 24;14:1175845. doi: 10.3389/fendo.2023.1175845. eCollection 2023. Front Endocrinol (Lausanne). 2023. PMID: 37293491 Free PMC article. Review.
References
MeSH terms
Grants and funding
LinkOut - more resources
Full Text Sources
Miscellaneous
