. 2022 Nov 29;11(23):3816.
doi: 10.3390/cells11233816.

Follistatin Is a Novel Chemoattractant for Migration and Invasion of Placental Trophoblasts of Mice

Affiliations

Follistatin Is a Novel Chemoattractant for Migration and Invasion of Placental Trophoblasts of Mice

Jing Li et al. Cells. .

Abstract

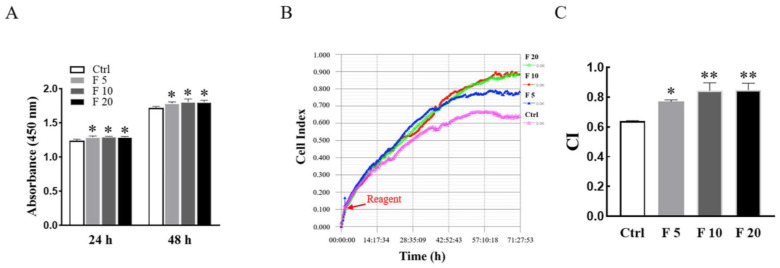
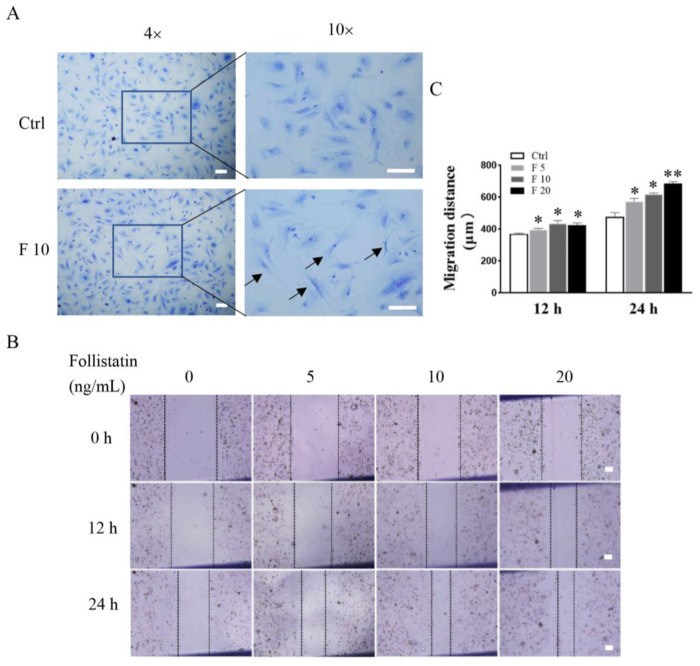
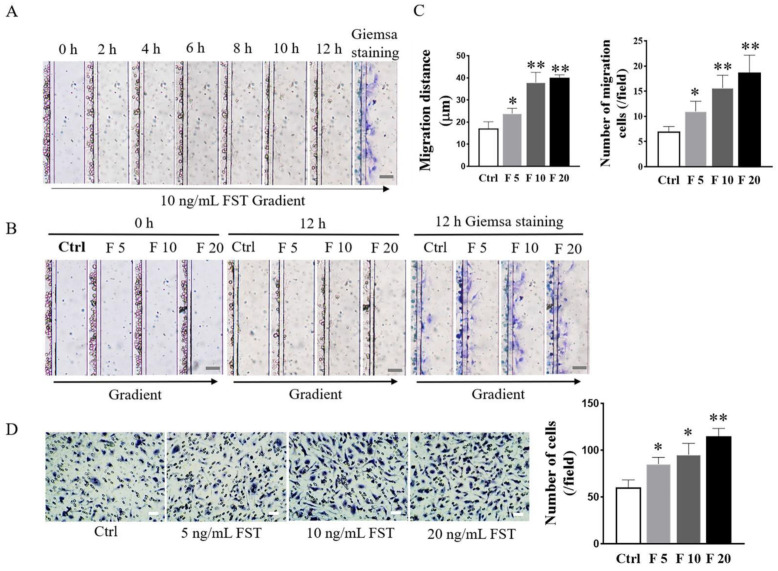
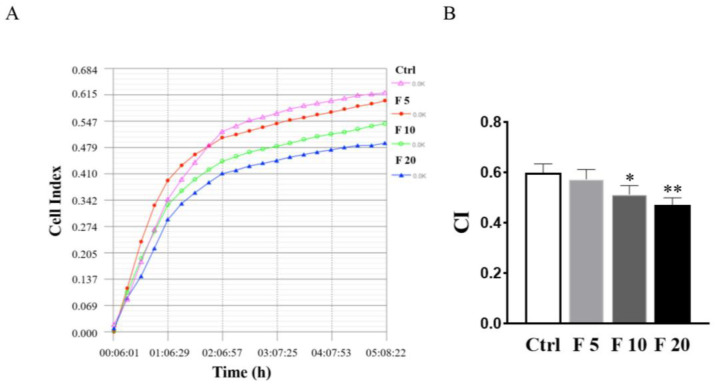
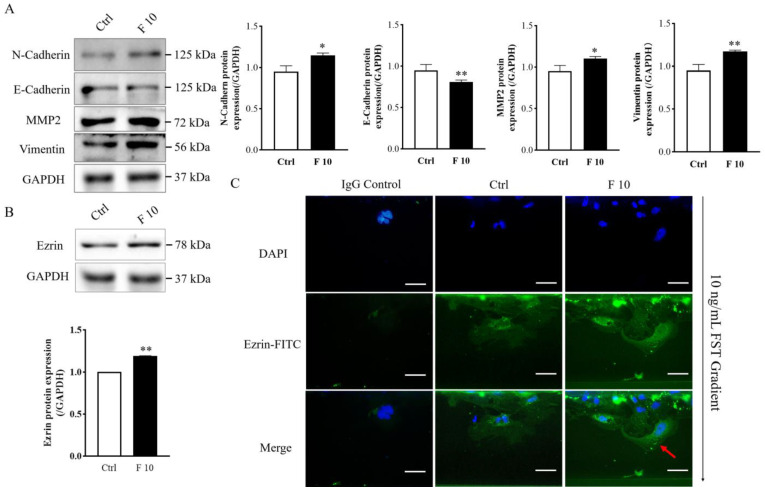
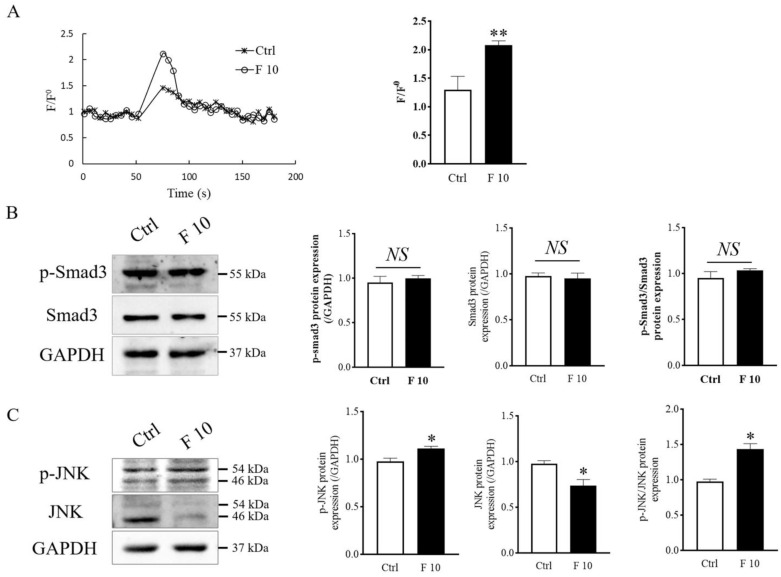
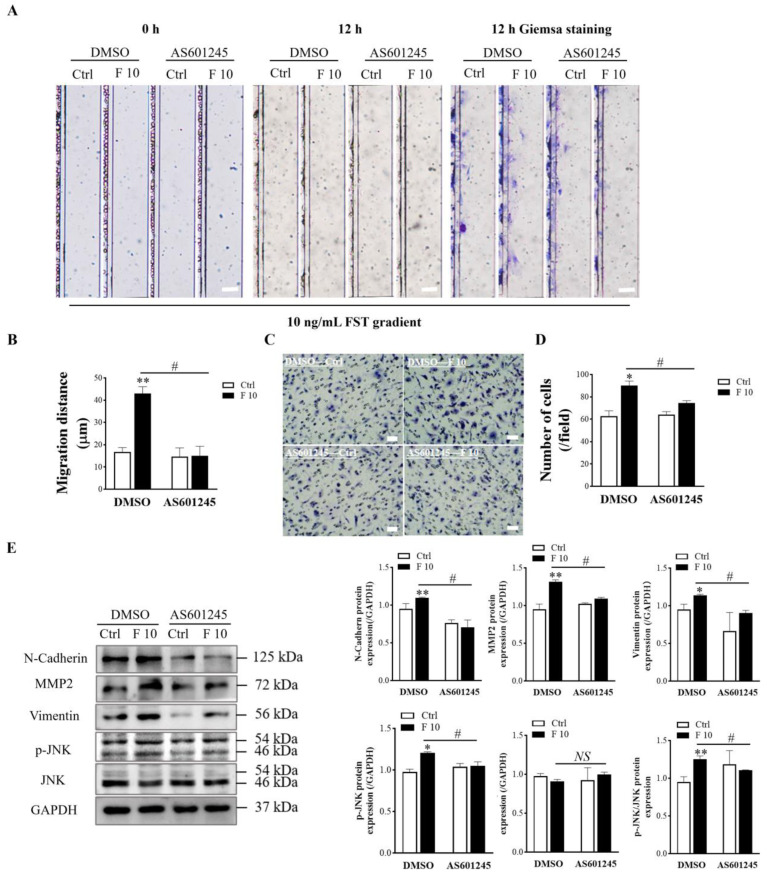
Follistatin (FST) as a gonadal protein is central to the establishment and maintenance of pregnancy. Trophoblasts' migration and invasion into the endometrium are critical events in placental development. This study aimed to elucidate the role of FST in the migration and invasion of placental trophoblasts of mice. We found that FST increased the vitality and proliferation of primary cultured trophoblasts of embryonic day 8.5 (E8.5) mice and promoted wound healing of trophoblasts. Moreover, FST significantly induced migration of trophoblasts in a microfluidic device and increased the number of invasive trophoblasts by Matrigel-coated transwell invasion assay. Being treated with FST, the adhesion of trophoblasts was inhibited, but intracellular calcium flux of trophoblasts was increased. Western blotting results showed that FST had no significant effects on the level of p-Smad3 or the ratio of p-Smad3/Smad3 in trophoblasts. Interestingly, FST elevated the level of p-JNK; the ratio of p-JNK/JNK; and expression of migration-related proteins N-cadherin, vimentin, ezrin and MMP2 in trophoblasts. Additionally, the migration of trophoblasts and expression of N-cadherin, vimentin, and MMP2 in trophoblasts induced by FST were attenuated by JNK inhibitor AS601245. These findings suggest that the elevated FST in pregnancy may act as a chemokine to induce trophoblast migration and invasion through the enhanced JNK signaling to maintain trophoblast function and promote placental development.

Keywords: JNK signaling; follistatin; migration; trophoblasts.


Conflict of interest statement

The authors declare no conflict of interest.

Figures

Figure 1
Figure 1
Illustration of the microfluidic D4-Chip device. (A,C) A schematic illustration of the fourth docking microfluidic device containing four units. Every unit is made of a cell inlet, outlet, and a dosing inlet containing medium and chemokine. (B) Soft-lithography adheres to the glass plate, and the dosing inlets are added to the ink. Blue ink represents medium and red ink represents chemokine. Moreover, both of them form the concentration gradient of chemokine in the main channel of cell migration. (D) From the image of the four microfluidic channels, cells are aligned beside in cell localization channel, and the formation of a concentration gradient in the main channel of cell migration owes to adding medium and chemokine at the same time. (E) I The length of the main channel of cell migration (Brillant blue), cell isolation zone (Red), and cell localization channel (Yellow) are 200 μm, 20 μm and 50 μm, respectively. What is more, illustration of the microfluidic migration assay simply involves cell seeding and solution loading followed by incubation and final end-point imaging analysis.
Figure 2
Figure 2
Effects of FST on viability and proliferation of primary cultured trophoblasts of mice. (A) The primary cultured trophoblasts of E8.5 mice were treated with FST for 24 h and 48 h, respectively, and the viabilities of cells were examined by the CCK-8 assay. The graph shows the absorbance of OD450 (n = 6). * p < 0.05, compared with control. (B) The proliferation of primary cultured trophoblasts of mice treated with FST for 72 h was examined by RTCA. The red arrow represents the dosing point. Ctrl: 2% FBS culture medium control. F5: 5 ng/mL of FST. F10: 10 ng/mL of FST. F20: 20 ng/mL of FST. (C) The graph showed the average cell index and standard deviation (n = 3). * p < 0.05, ** p < 0.01 compared with control.
Figure 3
Figure 3
Effects of FST on morphology and wound healing of primary cultured trophoblasts of mice. (A) Morphology of mice trophoblasts were determined by Giemsa staining. Arrows indicated the typical morphological changes of cells treated with 10 ng/mL FST for 24 h. (B) The scratch-wound model was generated in monolayer trophoblasts, and then cells were treated with FST for 12 h and 24 h, respectively. (C) The graph showed the degree of wound healing (n = 3). Scale bar = 100 μm. Ctrl: 2% FBS culture medium control. F5: 5 ng/mL of FST. F10: 10 ng/mL of FST. F20: 20 ng/mL of FST. * p < 0.05. ** p < 0.01, compared with control.
Figure 4
Figure 4
Effects of FST on migration and invasion of mice trophoblasts. (A) Images of trophoblast migration towards 10 ng/mL FST gradient were taken every 2 h in microfluidic device. (B) Images of trophoblast migration towards 0, 5, 10, and 20 ng/mL FST gradients were taken in the microfluidic device at 0 h and 12 h, respectively. Scale bar = 100 μm. (C) The graph showed the average migrated distance (left) and the number of migrated cells (right) in the same size fields of microfluidic device (n = 3). Ctrl: 2% FBS culture medium control. F5: 5 ng/mL of FST. F10: 10 ng/mL of FST. F20: 20 ng/mL of FST. * p < 0.05, ** p < 0.01, compared with control. (D) Invasion of trophoblasts treated with FST was determined by the Matrigel-coated transwell chamber invasion assay. Representative images of cell invasion were shown and the graph represented the average number of stained cells counted in five randomly chosen fields from each chamber (n = 3). Scale bar = 50 μm. * p < 0.05. ** p < 0.01, compared with control.
Figure 5
Figure 5
Effects of FST on adhesion of primary cultured trophoblasts of mice. (A) The cell adhesion was examined by RTCA in primary cultured mice trophoblasts subject to FST for 5 h. (B) The graph showed the average cell index (CI) and standard deviation (n = 3). Ctrl: 2% FBS culture medium control. F5: 5 ng/mL of FST. F10: 10 ng/mL of FST. F20: 20 ng/mL of FST. * p < 0.05, ** p < 0.01 compared with control.
Figure 6
Figure 6
Effects of FST on expression of migration-related protein and polarization of mice trophoblasts. (A) Migration-related protein expression was examined by Western blotting in primary cultured trophoblasts treated with 2% FBS culture medium (Ctrl) and 10 ng/mL FST (F10) for 24 h. The graph represents the relative levels of protein expression (n = 3). The expression levels of protein were normalized against GAPDH expression. (B) Ezrin expression in primary cultured trophoblasts of mice were analyzed by Western blotting. The graph represented the relative levels of ezrin protein expression (n = 3). (C) Ezrin distribution in primary cultured trophoblasts of mice were examined by immunofluorescent staining in microfluidic chip. IgG control, trophoblasts were stained with the normal rabbit IgG as isotype IgG control taking the place of anti-Ezrin antibody. Ctrl: trophoblasts that were treated with 2% FBS culture medium were stained with anti-Ezrin antibody. F 10, trophoblasts that were treated with 10 ng/mL FST were stained with anti-Ezrin antibody. Red arrows indicated the typical changes of Ezrin distribution in cells treated by 10 ng/mL FST. Scale bar = 50 μm. * p < 0.05. ** p < 0.01, compared with control.
Figure 7
Figure 7
Effects of FST on calcium signaling, Smad3, and JNK signaling of mice trophoblasts. (A) The calcium levels were measured by the Fluo-4 signal intensity normalized to the baseline (F/F0). The graph represented the comparison of the peak value of calcium signal upon stimulation under 2% FBS culture medium (Ctrl) and 10 ng/mL FST (F10) (n = 3). ** p < 0.01, compared with control. (B,C) Levels of Smad3, p-Smad3, JNK, and p-JNK proteins were examined by Western blotting in mice primary trophoblasts subjecting to 10 ng/mL FST for 4 h. The graph represented the relative level of proteins (n = 3). The levels of protein were normalized against GAPDH expression. * p < 0.05. ** p < 0.01, compared with control.
Figure 8
Figure 8
Effects of JNK inhibitor AS601245 on FST-induced migration and invasion of primary cultured trophoblasts of mice. (A) The primary cultured trophoblasts were pre-treated for 1 h with vehicle control (DMSO) or 1 μmol/L AS601245, and then migration of trophoblasts was determined by D4 chip for 12 h. Scale bar = 100 μm. (B) The graph showed the average migration distance of cells in the same size fields of microfluidic device (n = 3). (C) The invasion of primary cultured trophoblasts pre-treated with vehicle control (DMSO) or 1 μmol/L AS601245 was determined by Matrigel-coated transwell chamber invasion assay for 12 h. Scale bar = 50 μm. (D) The graph represents the average number of stained cells counted in five randomly chosen fields from each chamber (n = 3). (E) Levels of N-Cadherin, MMP2, vimentin, p-JNK, and JNK proteins in trophoblasts pre-treated with vehicle control (DMSO) or 1 μmol/L AS601245 in DMSO were determined by Western blotting with GAPDH as the internal control protein. The graph represents the relative level of proteins (n = 3). Ctrl: 2% FBS culture medium control. F10: 10 ng/mL of FST. * p < 0.05, ** p < 0.01, compared with vehicle control. # p < 0.05. compared with the indicted DMSO group.

Similar articles

Cited by

References

    1. Maltepe E., Fisher S.J. Placenta: The forgotten organ. Annu. Rev. Cell Dev. Biol. 2015;31:523–552. doi: 10.1146/annurev-cellbio-100814-125620. - DOI - PubMed
    1. Gerri C., McCarthy A., Alanis-Lobato G., Demtschenko A., Bruneau A., Loubersac S., Fogarty N.M.E., Hampshire D., Elder K., Snell P., et al. Initiation of a conserved trophectoderm program in human, cow and mouse embryos. Nature. 2020;587:443–447. doi: 10.1038/s41586-020-2759-x. - DOI - PMC - PubMed
    1. Mohan A., Asselin J., Sargent I.L., Groome N.P., Muttukrishna S. Effect of cytokines and growth factors on the secretion of inhibin A, activin A and follistatin by term placental villous trophoblasts in culture. Eur. J. Endocrinol. 2001;145:505–511. doi: 10.1530/eje.0.1450505. - DOI - PubMed
    1. Yokoyama Y., Nakamura T., Nakamura R., Irahara M., Aono T., Sugino H. Identification of activins and follistatin proteins in human follicular fluid and placenta. J. Clin. Endocrinol. Metab. 1995;80:915–921. doi: 10.1210/jcem.80.3.7883850. - DOI - PubMed
    1. Hardy J.T., Buhimschi I.A., McCarthy M.E., Zhao G., Laky C.A., Shook L.L., Buhimschi C.S. Imbalance of Amniotic Fluid Activin-A and Follistatin in Intraamniotic Infection, Inflammation, and Preterm Birth. J. Clin. Endocrinol. Metab. 2016;101:2785–2793. doi: 10.1210/jc.2015-4147. - DOI - PMC - PubMed