

Extracellular Vesicles from Ocular Melanoma Have Pro-Fibrotic and Pro-Angiogenic Properties on the Tumor Microenvironment
- PMID: 36497088
- PMCID: PMC9736613
- DOI: 10.3390/cells11233828
Extracellular Vesicles from Ocular Melanoma Have Pro-Fibrotic and Pro-Angiogenic Properties on the Tumor Microenvironment
Abstract
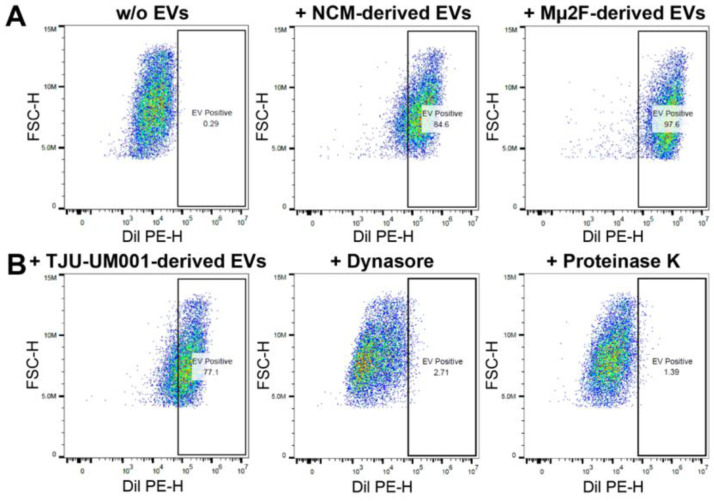
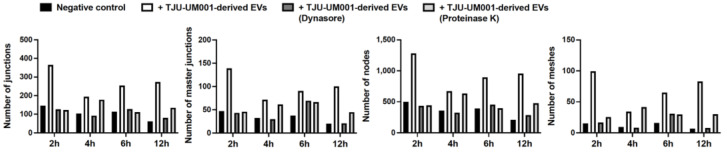
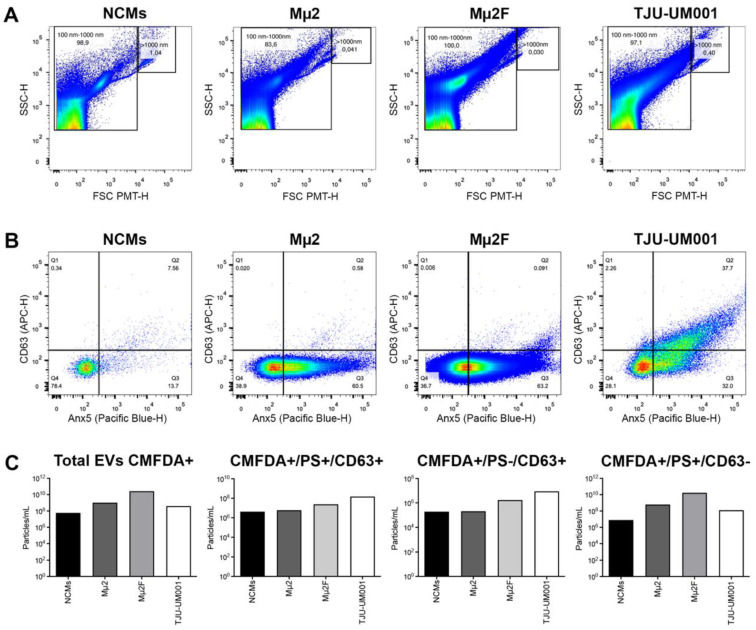
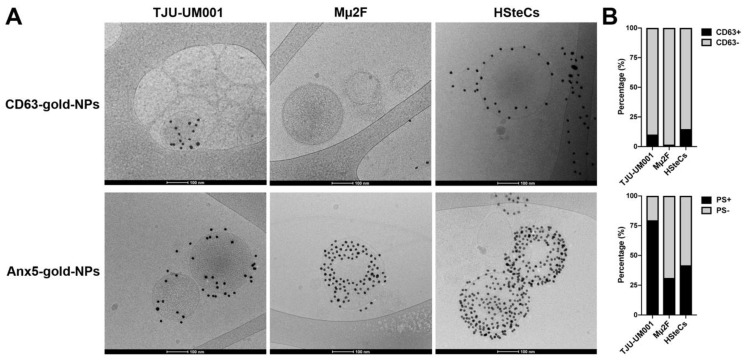
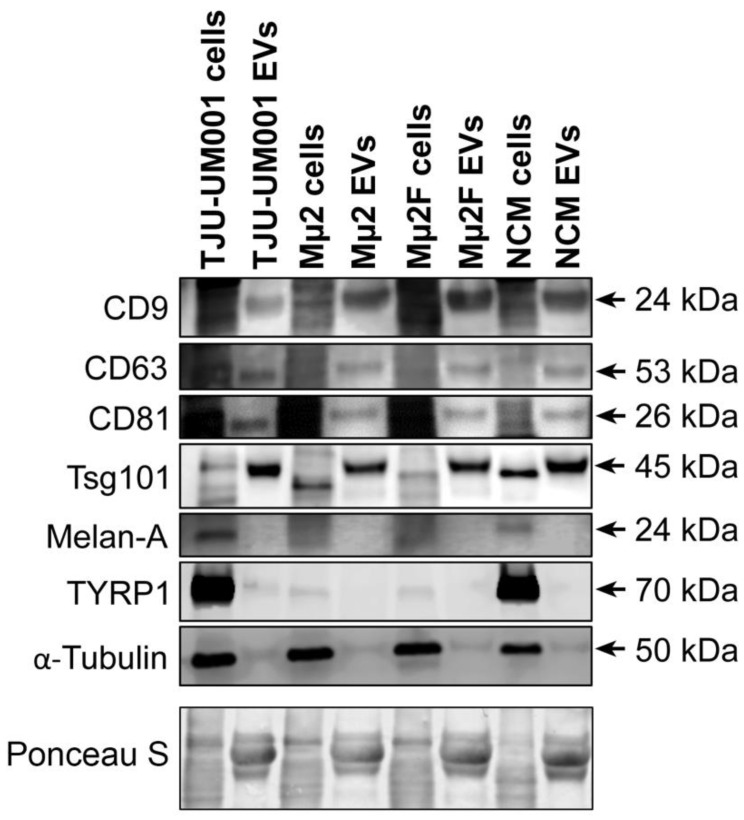
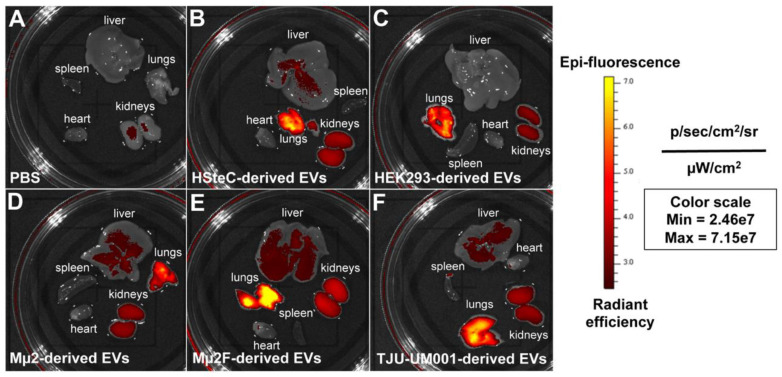
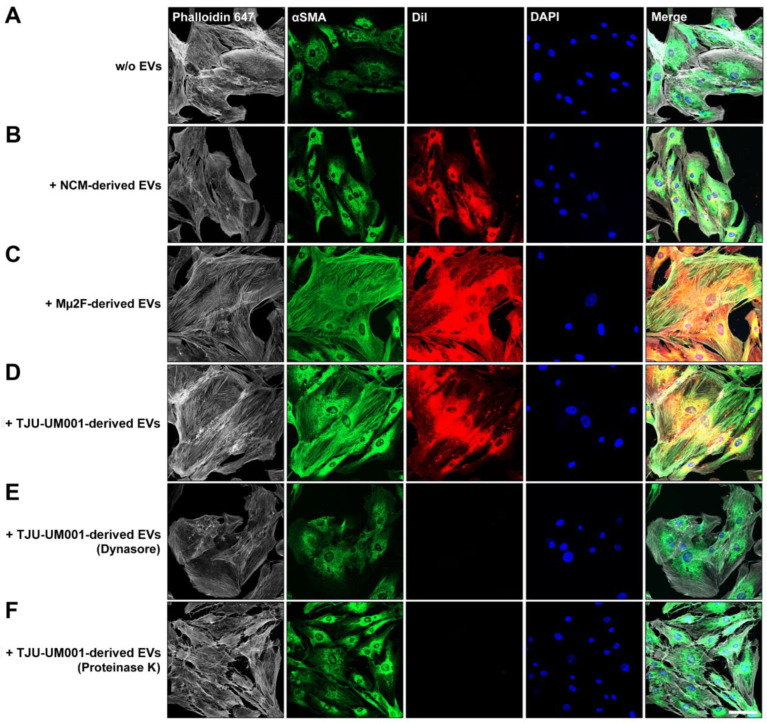
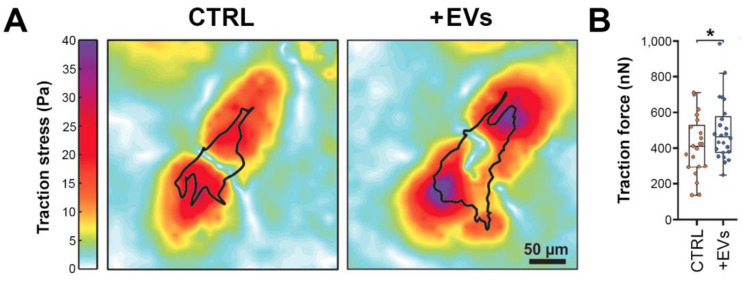
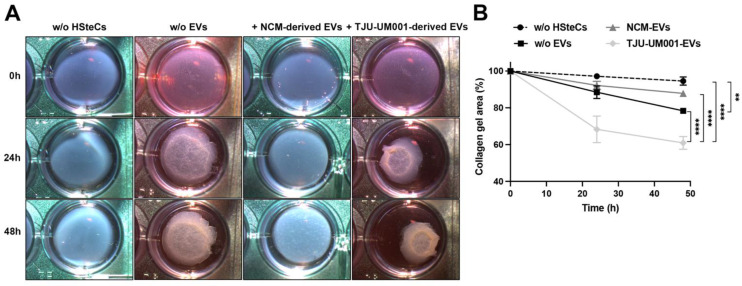
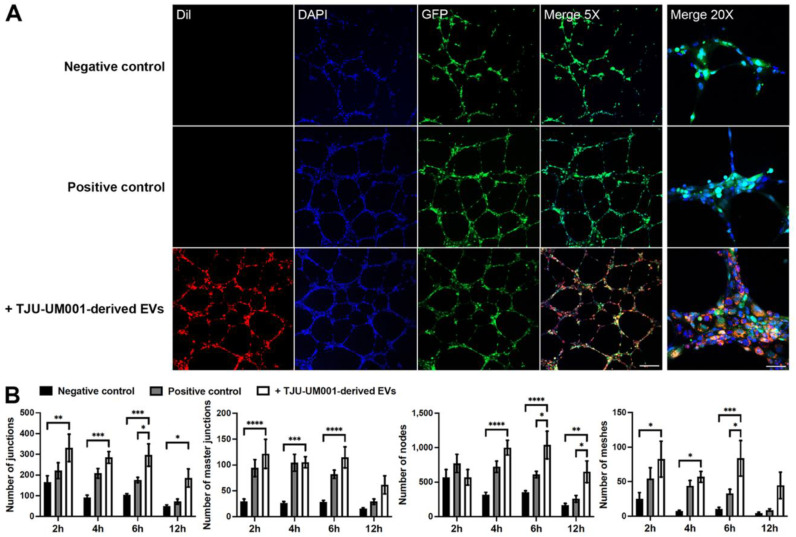
Uveal melanoma (UM) is the most common primary intraocular tumor and often spreads to the liver. Intercellular communication though extracellular vesicles (EVs) plays an important role in several oncogenic processes, including metastasis, therapeutic resistance, and immune escape. This study examines how EVs released by UM cells modify stellate and endothelial cells in the tumor microenvironment. The surface markers, and the concentration and size of EVs derived from UM cells or choroidal melanocytes were characterized by high-resolution flow cytometry, electron microscopy, and Western blotting. The selective biodistribution of EVs was studied in mice by fluorescence imaging. The activation/contractility of stellate cells and the tubular organization of endothelial cells after exposure to melanomic EVs were determined by traction force microscopy, collagen gel contraction, or endothelial tube formation assays. We showed that large EVs from UM cells and healthy melanocytes are heterogenous in size, as well as their expression of phosphatidylserine, tetraspanins, and Tsg101. Melanomic EVs mainly accumulated in the liver and lungs of mice. Hepatic stellate cells with internalized melanomic EVs had increased contractility, whereas EV-treated endothelial cells developed more capillary-like networks. Our study demonstrates that the transfer of EVs from UM cells leads to a pro-fibrotic and pro-angiogenic phenotype in hepatic stellate and endothelial cells.
Keywords: endothelial cells; extracellular vesicles; hepatic stellate cells; metastatic uveal melanoma.
Conflict of interest statement
The authors declare no conflict of interest.
Figures
Similar articles
-
Extracellular Vesicles from Steatotic Hepatocytes Provoke Pro-Fibrotic Responses in Cultured Stellate Cells.Biomolecules. 2022 May 13;12(5):698. doi: 10.3390/biom12050698. Biomolecules. 2022. PMID: 35625625 Free PMC article.
-
Extracellular vesicles in uveal melanoma - Biological roles and diagnostic value.Cancer Lett. 2025 Apr 10;615:217531. doi: 10.1016/j.canlet.2025.217531. Epub 2025 Feb 4. Cancer Lett. 2025. PMID: 39914771 Review.
-
Uveal Melanoma-Derived Extracellular Vesicles Display Transforming Potential and Carry Protein Cargo Involved in Metastatic Niche Preparation.Cancers (Basel). 2020 Oct 11;12(10):2923. doi: 10.3390/cancers12102923. Cancers (Basel). 2020. PMID: 33050649 Free PMC article.
-
Effects of Cyclooxygenase-2 in Canine Melanoma-derived Extracellular Vesicles on Tumor Microenvironment In Vitro.Anticancer Res. 2022 Nov;42(11):5397-5405. doi: 10.21873/anticanres.16044. Anticancer Res. 2022. PMID: 36288867
-
The Roles of Extracellular Vesicles in Malignant Melanoma.Cells. 2021 Oct 14;10(10):2740. doi: 10.3390/cells10102740. Cells. 2021. PMID: 34685720 Free PMC article. Review.
Cited by
-
New Insights into the Exosome-Induced Migration of Uveal Melanoma Cells and the Pre-Metastatic Niche Formation in the Liver.Cancers (Basel). 2024 Aug 27;16(17):2977. doi: 10.3390/cancers16172977. Cancers (Basel). 2024. PMID: 39272836 Free PMC article.
-
Cell Type-Specific Extracellular Vesicles and Their Impact on Health and Disease.Int J Mol Sci. 2024 Feb 27;25(5):2730. doi: 10.3390/ijms25052730. Int J Mol Sci. 2024. PMID: 38473976 Free PMC article. Review.
-
Recent Advances in Molecular and Genetic Research on Uveal Melanoma.Cells. 2024 Jun 12;13(12):1023. doi: 10.3390/cells13121023. Cells. 2024. PMID: 38920653 Free PMC article. Review.
-
Uveal Melanoma: Comprehensive Review of Its Pathophysiology, Diagnosis, Treatment, and Future Perspectives.Biomedicines. 2024 Aug 5;12(8):1758. doi: 10.3390/biomedicines12081758. Biomedicines. 2024. PMID: 39200222 Free PMC article. Review.
-
Lactadherin immunoblockade in small extracellular vesicles inhibits sEV-mediated increase of pro-metastatic capacities.Biol Res. 2024 Jan 3;57(1):1. doi: 10.1186/s40659-023-00477-8. Biol Res. 2024. PMID: 38173019 Free PMC article.
References
-
- Diener-West M., Reynolds S.M., Agugliaro D.J., Caldwell R., Cumming K., Earle J.D., Hawkins B.S., Hayman J.A., Jaiyesimi I., Jampol L.M., et al. Development of metastatic disease after enrollment in the COMS trials for treatment of choroidal melanoma: Collaborative Ocular Melanoma Study Group Report No. 26. Arch. Ophthalmol. 2005;123:1639–1643. - PubMed
-
- Chandran S.S., Somerville R.P.T., Yang J.C., Sherry R.M., Klebanoff C.A., Goff S.L., Wunderlich J.R., Danforth D.N., Zlott D., Paria B.C., et al. Treatment of metastatic uveal melanoma with adoptive transfer of tumour-infiltrating lymphocytes: A single-centre, two-stage, single-arm, phase 2 study. Lancet Oncol. 2017;18:792–802. doi: 10.1016/S1470-2045(17)30251-6. - DOI - PMC - PubMed
-
- Seedor R.S., Eschelman D.J., Gonsalves C.F., Adamo R.D., Orloff M., Amjad A., Sharpe-Mills E., Chervoneva I., Shields C.L., Shields J.A., et al. An Outcome Assessment of a Single Institution’s Longitudinal Experience with Uveal Melanoma Patients with Liver Metastasis. Cancers. 2020;12:117. doi: 10.3390/cancers12010117. - DOI - PMC - PubMed
MeSH terms
Grants and funding
LinkOut - more resources
Full Text Sources
Medical
