Beneficial Effects of Hyaluronan-Based Hydrogel Implantation after Cortical Traumatic Injury
- PMID: 36497093
- PMCID: PMC9735891
- DOI: 10.3390/cells11233831
Beneficial Effects of Hyaluronan-Based Hydrogel Implantation after Cortical Traumatic Injury
Abstract
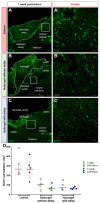
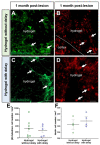
Traumatic brain injury (TBI) causes cell death mainly in the cerebral cortex. We have previously reported that transplantation of embryonic cortical neurons immediately after cortical injury allows the anatomical reconstruction of injured pathways and that a delay between cortical injury and cell transplantation can partially improve transplantation efficiency. Biomaterials supporting repair processes in combination with cell transplantation are in development. Hyaluronic acid (HA) hydrogel has attracted increasing interest in the field of tissue engineering due to its attractive biological properties. However, before combining the cell with the HA hydrogel for transplantation, it is important to know the effects of the implanted hydrogel alone. Here, we investigated the therapeutic effect of HA on host tissue after a cortical trauma. For this, we implanted HA hydrogel into the lesioned motor cortex of adult mice immediately or one week after a lesion. Our results show the vascularization of the implanted hydrogel. At one month after HA implantation, we observed a reduction in the glial scar around the lesion and the presence of the newly generated oligodendrocytes, immature and mature neurons within the hydrogel. Implanted hydrogel provides favorable environments for the survival and maturation of the newly generated neurons. Collectively, these results suggest a beneficial effect of biomaterial after a cortical traumatic injury.
Keywords: biomaterial; hyaluronan; neuroinflammation; traumatic brain injury.
Conflict of interest statement
The authors declare no conflict of interest. The funders had no role in the design of the study; in the collection, analyses, or interpretation of data; in the writing of the manuscript, or in the decision to publish the results.
Figures


Similar articles
-
Semi-Interpenetrating Polymer Network of Hyaluronan and Chitosan Self-Healing Hydrogels for Central Nervous System Repair.ACS Appl Mater Interfaces. 2020 Sep 9;12(36):40108-40120. doi: 10.1021/acsami.0c11433. Epub 2020 Aug 29. ACS Appl Mater Interfaces. 2020. PMID: 32808527
-
Hyaluronic acid-poly-D-lysine-based three-dimensional hydrogel for traumatic brain injury.Tissue Eng. 2005 Mar-Apr;11(3-4):513-25. doi: 10.1089/ten.2005.11.513. Tissue Eng. 2005. PMID: 15869430
-
Hydrogel-mediated local delivery of dexamethasone reduces neuroinflammation after traumatic brain injury.Biomed Mater. 2021 Feb 26;16(3). doi: 10.1088/1748-605X/abc7f1. Biomed Mater. 2021. PMID: 33152711
-
The Potential Applications of Hyaluronic Acid Hydrogels in Biomedicine.Drug Res (Stuttg). 2020 Jan;70(1):6-11. doi: 10.1055/a-0991-7585. Epub 2019 Sep 25. Drug Res (Stuttg). 2020. PMID: 31556074 Review.
-
The effect of hyaluronic acid hydrogels on dental pulp stem cells behavior.Int J Biol Macromol. 2019 Nov 1;140:245-254. doi: 10.1016/j.ijbiomac.2019.08.119. Epub 2019 Aug 13. Int J Biol Macromol. 2019. PMID: 31419560 Review.
Cited by
-
Combating Traumatic Brain Injury: A Dual-Mechanism Hydrogel Delivering Salvianolic Acid A and Hydroxysafflor Yellow A to Block TLR4/NF-κB and Boost Angiogenesis.Polymers (Basel). 2025 Jul 9;17(14):1900. doi: 10.3390/polym17141900. Polymers (Basel). 2025. PMID: 40732779 Free PMC article.
-
Development and Characterization of Hyaluronic Acid Microgels for Neural Regeneration Applications.J Biomed Mater Res A. 2025 Aug;113(8):e37972. doi: 10.1002/jbm.a.37972. J Biomed Mater Res A. 2025. PMID: 40787877 Free PMC article.
-
Proteoglycans and glycosaminoglycans: critical regulators in angiogenesis, vasculogenesis, and vascularized tissue engineering.Angiogenesis. 2025 Jun 25;28(3):37. doi: 10.1007/s10456-025-09995-3. Angiogenesis. 2025. PMID: 40560464 Review.
-
Applications of hydrogels and nanoparticles in the treatment of traumatic brain injury.Front Bioeng Biotechnol. 2025 Jan 6;12:1515164. doi: 10.3389/fbioe.2024.1515164. eCollection 2024. Front Bioeng Biotechnol. 2025. PMID: 39834632 Free PMC article. Review.
-
Printable biomaterials for 3D brain regenerative scaffolds: An in vivo biocompatibility assessment.Regen Ther. 2025 Aug 19;30:641-655. doi: 10.1016/j.reth.2025.08.008. eCollection 2025 Dec. Regen Ther. 2025. PMID: 40896181 Free PMC article.
References
-
- Maas A.I.R., Menon D.K., Adelson P.D., Andelic N., Bell M.J., Belli A., Bragge P., Brazinova A., Büki A., Chesnut R.M., et al. Traumatic brain injury: Integrated approaches to improve prevention, clinical care, and research. Lancet Neurol. 2017;16:987–1048. - PubMed
MeSH terms
Substances
Grants and funding
LinkOut - more resources
Full Text Sources

