

Stem-Cell-Derived β-Like Cells with a Functional PTPN2 Knockout Display Increased Immunogenicity
- PMID: 36497105
- PMCID: PMC9737324
- DOI: 10.3390/cells11233845
Stem-Cell-Derived β-Like Cells with a Functional PTPN2 Knockout Display Increased Immunogenicity
Abstract
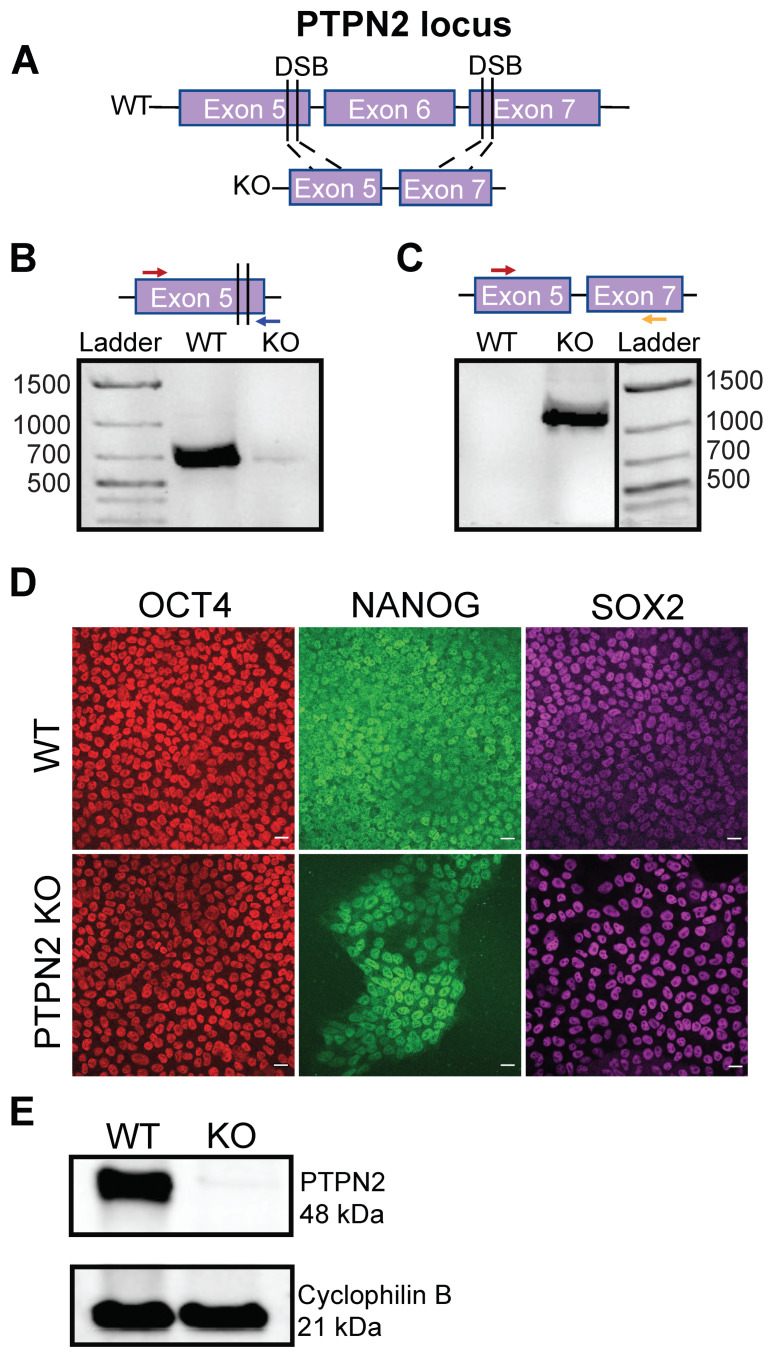
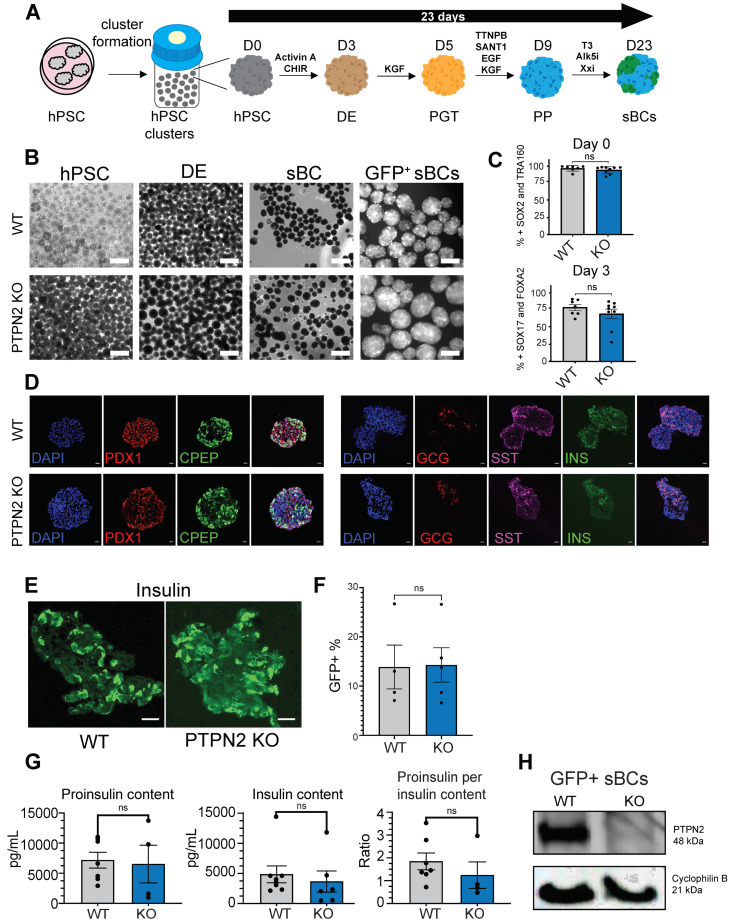
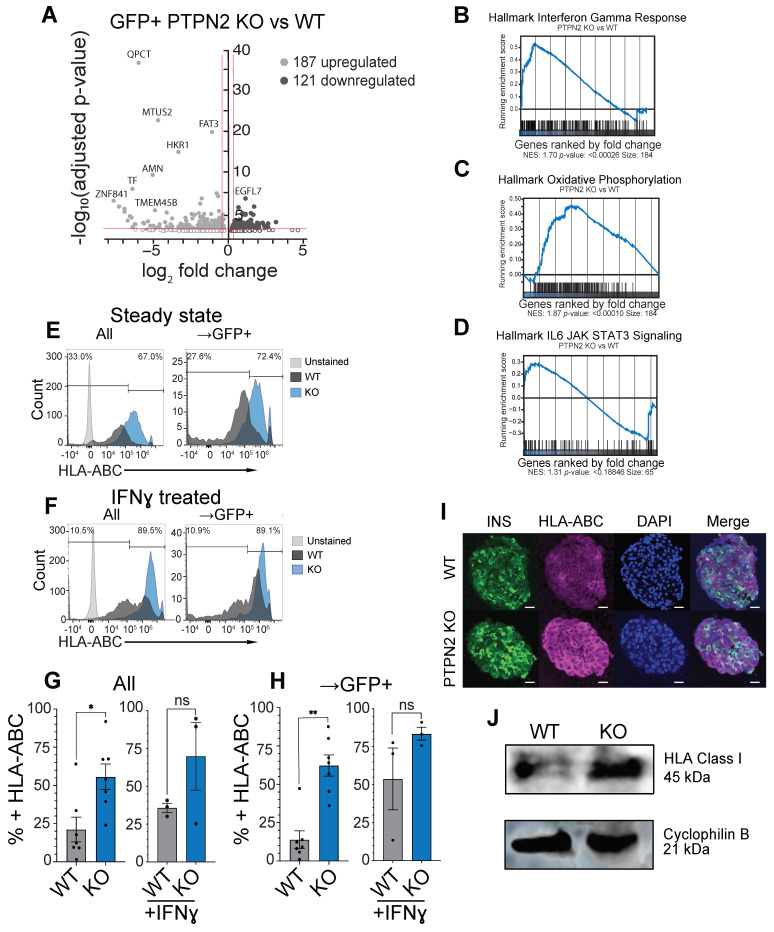
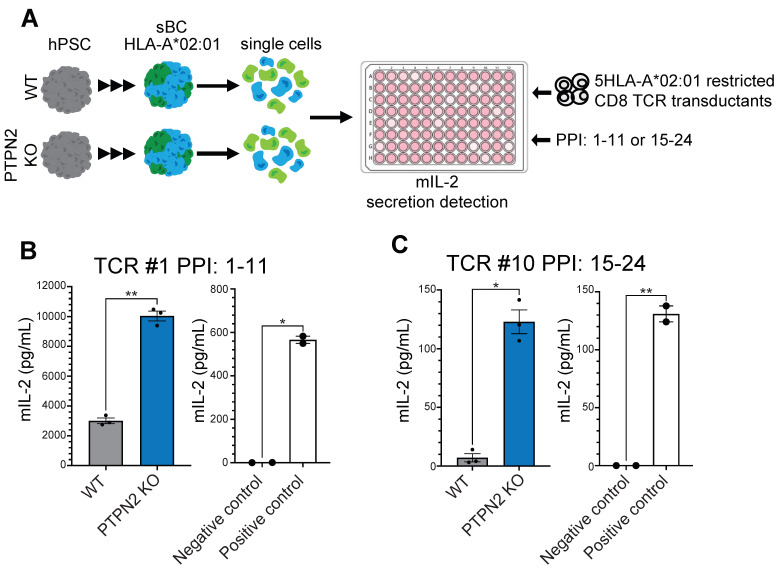
Type 1 diabetes is a polygenic disease that results in an autoimmune response directed against insulin-producing beta cells. PTPN2 is a known high-risk type 1 diabetes associated gene expressed in both immune- and pancreatic beta cells, but how genes affect the development of autoimmune diabetes is largely unknown. We employed CRISPR/Cas9 technology to generate a functional knockout of PTPN2 in human pluripotent stem cells (hPSC) followed by differentiating stem-cell-derived beta-like cells (sBC) and detailed phenotypical analyses. The differentiation efficiency of PTPN2 knockout (PTPN2 KO) sBC is comparable to wild-type (WT) control sBC. Global transcriptomics and protein assays revealed the increased expression of HLA Class I molecules in PTPN2 KO sBC at a steady state and upon exposure to proinflammatory culture conditions, indicating a potential for the increased immune recognition of human beta cells upon differential PTPN2 expression. sBC co-culture with autoreactive preproinsulin-reactive T cell transductants confirmed increased immune stimulations by PTPN2 KO sBC compared to WT sBC. Taken together, our results suggest that the dysregulation of PTPN2 expression in human beta cell may prime autoimmune T cell reactivity and thereby contribute to the development of type 1 diabetes.
Keywords: CRISPR/Cas9 knockout; PTPN2; autoimmunity; autoreactive TCR transductants; co-culture; direct differentiation; genetic risk; stem-cell-derived pancreatic beta cells; type 1 diabetes.
Conflict of interest statement
The authors have no conflict of interest to disclose. H.A.R. is (or has been) a SAB member at Sigilon Therapeutics and Prellis Biologics is (or has been) a consultant for Eli Lilly and Minutia.
Figures
Similar articles
-
T-Cell-Specific PTPN2 Deficiency in NOD Mice Accelerates the Development of Type 1 Diabetes and Autoimmune Comorbidities.Diabetes. 2019 Jun;68(6):1251-1266. doi: 10.2337/db18-1362. Epub 2019 Apr 1. Diabetes. 2019. PMID: 30936146
-
Inhibition of the type 1 diabetes candidate gene PTPN2 aggravates TNF-α-induced human beta cell dysfunction and death.Diabetologia. 2023 Aug;66(8):1544-1556. doi: 10.1007/s00125-023-05908-5. Epub 2023 Mar 29. Diabetologia. 2023. PMID: 36988639
-
PTPN2 Regulates the Interferon Signaling and Endoplasmic Reticulum Stress Response in Pancreatic β-Cells in Autoimmune Diabetes.Diabetes. 2022 Apr 1;71(4):653-668. doi: 10.2337/db21-0443. Diabetes. 2022. PMID: 35044456
-
[Research progress of several protein tyrosine phosphatases in diabetes].Sheng Li Xue Bao. 2010 Apr 25;62(2):179-89. Sheng Li Xue Bao. 2010. PMID: 20401454 Review. Chinese.
-
Protein tyrosine phosphatases and type 1 diabetes: genetic and functional implications of PTPN2 and PTPN22.Rev Diabet Stud. 2012 Winter;9(4):188-200. doi: 10.1900/RDS.2012.9.188. Epub 2012 Dec 28. Rev Diabet Stud. 2012. PMID: 23804260 Free PMC article. Review.
Cited by
-
The beta cell-immune cell interface in type 1 diabetes (T1D).Mol Metab. 2023 Dec;78:101809. doi: 10.1016/j.molmet.2023.101809. Epub 2023 Sep 20. Mol Metab. 2023. PMID: 37734713 Free PMC article. Review.
-
Evaluation of transduction efficiency in pancreatic beta and alpha cells utilizing various AAV serotypes.Sci Rep. 2025 Jul 1;15(1):20927. doi: 10.1038/s41598-025-05518-8. Sci Rep. 2025. PMID: 40594521 Free PMC article.
-
PTPN2 Regulates Metabolic Flux to Affect β-Cell Susceptibility to Inflammatory Stress.Diabetes. 2024 Mar 1;73(3):434-447. doi: 10.2337/db23-0355. Diabetes. 2024. PMID: 38015772 Free PMC article.
-
Untangling the genetics of beta cell dysfunction and death in type 1 diabetes.Mol Metab. 2024 Aug;86:101973. doi: 10.1016/j.molmet.2024.101973. Epub 2024 Jun 22. Mol Metab. 2024. PMID: 38914291 Free PMC article. Review.
References
-
- Herold K.C., Bundy B.N., Long S.A., Bluestone J.A., DiMeglio L.A., Dufort M.J., Gitelman S.E., Gottlieb P.A., Krischer J.P., Linsley P.S., et al. An Anti-CD3 Antibody, Teplizumab, in Relatives at Risk for Type 1 Diabetes. N. Engl. J. Med. 2019;381:603–613. doi: 10.1056/NEJMoa1902226. - DOI - PMC - PubMed
-
- Herold K.C., Gitelman S.E., Ehlers M.R., Gottlieb P.A., Greenbaum C.J., Hagopian W., Boyle K.D., Keyes-Elstein L., Aggarwal S., Phippard D., et al. Teplizumab (anti-CD3 mAb) treatment preserves C-peptide responses in patients with new-onset type 1 diabetes in a randomized controlled trial: Metabolic and immunologic features at baseline identify a subgroup of responders. Diabetes. 2013;62:3766–3774. doi: 10.2337/db13-0345. - DOI - PMC - PubMed
-
- Battaglia M., Ahmed S., Anderson M.S., Atkinson M.A., Becker D., Bingley P.J., Bosi E., Brusko T.M., DiMeglio L.A., Evans-Molina C., et al. Introducing the Endotype Concept to Address the Challenge of Disease Heterogeneity in Type 1 Diabetes. Diabetes Care. 2020;43:5–12. doi: 10.2337/dc19-0880. - DOI - PMC - PubMed
MeSH terms
Substances
Grants and funding
- R01DK082590/DK/NIDDK NIH HHS/United States
- DK032083/DK/NIDDK NIH HHS/United States
- R01DK132387/DK/NIDDK NIH HHS/United States
- K12DK094712/DK/NIDDK NIH HHS/United States
- UC24 DK1041162/DK/NIDDK NIH HHS/United States
- P30DK116073/DK/NIDDK NIH HHS/United States
- R56 DK099317/DK/NIDDK NIH HHS/United States
- T32 AR007411/AR/NIAMS NIH HHS/United States
- R01 DK125360/DK/NIDDK NIH HHS/United States
- R01 DK032083/DK/NIDDK NIH HHS/United States
- R01 DK108868/DK/NIDDK NIH HHS/United States
- R01 DK132387/DK/NIDDK NIH HHS/United States
- R01 DK099317/DK/NIDDK NIH HHS/United States
- SCR_014393/DK/NIDDK NIH HHS/United States
- P30 DK116073/DK/NIDDK NIH HHS/United States
- DK099317/DK/NIDDK NIH HHS/United States
- DK108868/DK/NIDDK NIH HHS/United States
- R01DK12044/DK/NIDDK NIH HHS/United States
- 5T32AR007411-35/NH/NIH HHS/United States
- K12 DK094712/DK/NIDDK NIH HHS/United States
- R37 DK032083/DK/NIDDK NIH HHS/United States
- R01 DK082590/DK/NIDDK NIH HHS/United States
- R01 DK120444/DK/NIDDK NIH HHS/United States
- T32 DK 120520/NH/NIH HHS/United States
- T32 DK120520/DK/NIDDK NIH HHS/United States
LinkOut - more resources
Full Text Sources
Other Literature Sources
Medical
Molecular Biology Databases
Research Materials
