The Protective Role of Microglial PPARα in Diabetic Retinal Neurodegeneration and Neurovascular Dysfunction
- PMID: 36497130
- PMCID: PMC9739170
- DOI: 10.3390/cells11233869
The Protective Role of Microglial PPARα in Diabetic Retinal Neurodegeneration and Neurovascular Dysfunction
Abstract
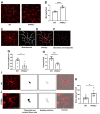
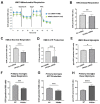
Microglial activation and subsequent pathological neuroinflammation contribute to diabetic retinopathy (DR). However, the underlying mechanisms of microgliosis, and means to effectively suppress pathological microgliosis, remain incompletely understood. Peroxisome proliferator-activated receptor alpha (PPARα) is a transcription factor that regulates lipid metabolism. The present study aimed to determine if PPARα affects pathological microgliosis in DR. In global Pparα mice, retinal microglia exhibited decreased structural complexity and enlarged cell bodies, suggesting microglial activation. Microglia-specific conditional Pparα-/- (PCKO) mice showed decreased retinal thickness as revealed by optical coherence tomography. Under streptozotocin (STZ)-induced diabetes, diabetic PCKO mice exhibited decreased electroretinography response, while diabetes-induced retinal dysfunction was alleviated in diabetic microglia-specific Pparα-transgenic (PCTG) mice. Additionally, diabetes-induced retinal pericyte loss was exacerbated in diabetic PCKO mice and alleviated in diabetic PCTG mice. In cultured microglial cells with the diabetic stressor 4-HNE, metabolic flux analysis demonstrated that Pparα ablation caused a metabolic shift from oxidative phosphorylation to glycolysis. Pparα deficiency also increased microglial STING and TNF-α expression. Taken together, these findings revealed a critical role for PPARα in pathological microgliosis, neurodegeneration, and vascular damage in DR, providing insight into the underlying molecular mechanisms of microgliosis in this context and suggesting microglial PPARα as a potential therapeutic target.
Keywords: diabetic retinopathy; glycolysis; inflammation; microglial metabolism; mitochondrion; neurodegeneration; pericyte loss.
Conflict of interest statement
The authors declare no conflict of interest.
Figures


Similar articles
-
Peroxisome proliferator-activated receptor α protects capillary pericytes in the retina.Am J Pathol. 2014 Oct;184(10):2709-20. doi: 10.1016/j.ajpath.2014.06.021. Epub 2014 Aug 7. Am J Pathol. 2014. PMID: 25108226 Free PMC article.
-
Neuroprotective effects of PPARα in retinopathy of type 1 diabetes.PLoS One. 2019 Feb 4;14(2):e0208399. doi: 10.1371/journal.pone.0208399. eCollection 2019. PLoS One. 2019. PMID: 30716067 Free PMC article.
-
Pathogenic role of diabetes-induced PPAR-α down-regulation in microvascular dysfunction.Proc Natl Acad Sci U S A. 2013 Sep 17;110(38):15401-6. doi: 10.1073/pnas.1307211110. Epub 2013 Sep 3. Proc Natl Acad Sci U S A. 2013. PMID: 24003152 Free PMC article.
-
The Role of Microglia in Diabetic Retinopathy: Inflammation, Microvasculature Defects and Neurodegeneration.Int J Mol Sci. 2018 Jan 1;19(1):110. doi: 10.3390/ijms19010110. Int J Mol Sci. 2018. PMID: 29301251 Free PMC article. Review.
-
Microglial regulation of the retinal vasculature in health and during the pathology associated with diabetes.Prog Retin Eye Res. 2025 May;106:101349. doi: 10.1016/j.preteyeres.2025.101349. Epub 2025 Feb 26. Prog Retin Eye Res. 2025. PMID: 40020909 Review.
Cited by
-
Glial Contribution to the Pathogenesis of Post-Operative Delirium Revealed by Multi-omic Analysis of Brain Tissue from Neurosurgery Patients.bioRxiv [Preprint]. 2025 Mar 14:2025.03.13.643155. doi: 10.1101/2025.03.13.643155. bioRxiv. 2025. PMID: 40161597 Free PMC article. Preprint.
-
Retinoid X Receptor Activation Prevents Diabetic Retinopathy in Murine Models.Cells. 2023 Sep 26;12(19):2361. doi: 10.3390/cells12192361. Cells. 2023. PMID: 37830574 Free PMC article.
-
Novel Therapeutic Approaches for Treatment of Diabetic Retinopathy and Age-Related Macular Degeneration.Vision (Basel). 2025 Apr 17;9(2):35. doi: 10.3390/vision9020035. Vision (Basel). 2025. PMID: 40265403 Free PMC article. Review.
-
Role of myeloid cells in ischemic retinopathies: recent advances and unanswered questions.J Neuroinflammation. 2024 Mar 7;21(1):65. doi: 10.1186/s12974-024-03058-y. J Neuroinflammation. 2024. PMID: 38454477 Free PMC article. Review.
-
BMP4 aggravates mitochondrial dysfunction of HRMECs.Heliyon. 2023 Feb 18;9(3):e13824. doi: 10.1016/j.heliyon.2023.e13824. eCollection 2023 Mar. Heliyon. 2023. PMID: 36895361 Free PMC article.
References
-
- Boss J.D., Singh P.K., Pandya H.K., Tosi J., Kim C., Tewari A., Juzych M.S., Abrams G.W., Kumar A. Assessment of Neurotrophins and Inflammatory Mediators in Vitreous of Patients with Diabetic Retinopathy. Investig. Opthalmol. Vis. Sci. 2017;58:5594–5603. doi: 10.1167/iovs.17-21973. - DOI - PMC - PubMed
-
- Krady J.K., Basu A., Allen C.M., Xu Y., LaNoue K.F., Gardner T.W., Levison S.W. Minocycline Reduces Proinflammatory Cytokine Expression, Microglial Activation, and Caspase-3 Activation in a Rodent Model of Diabetic Retinopathy. Diabetes. 2005;54:1559–1565. doi: 10.2337/diabetes.54.5.1559. - DOI - PubMed
MeSH terms
Substances
Grants and funding
LinkOut - more resources
Full Text Sources
Medical
Molecular Biology Databases
Research Materials

