. 2022 Dec 2;11(23):3891.
doi: 10.3390/cells11233891.

Hypothalamic-Pituitary-Adrenal Hormones Impair Pig Fertilization and Preimplantation Embryo Development via Inducing Oviductal Epithelial Apoptosis: An In Vitro Study

Affiliations

Hypothalamic-Pituitary-Adrenal Hormones Impair Pig Fertilization and Preimplantation Embryo Development via Inducing Oviductal Epithelial Apoptosis: An In Vitro Study

Jin-Song An et al. Cells. .

Abstract

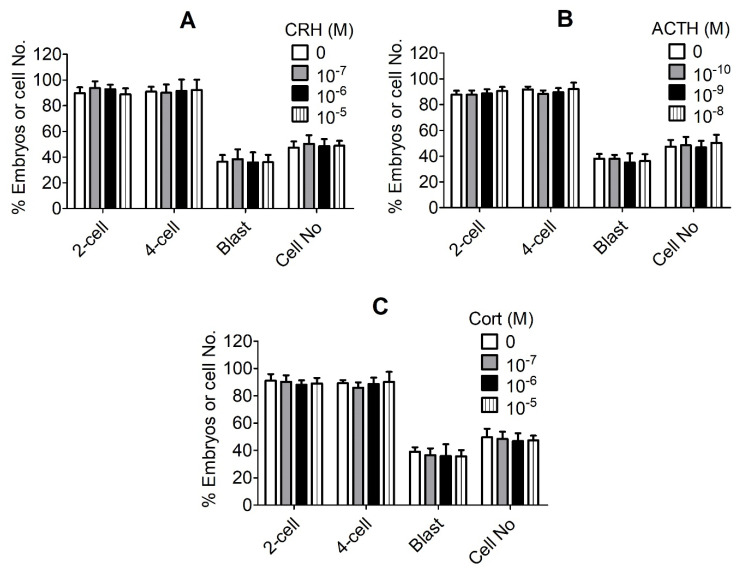
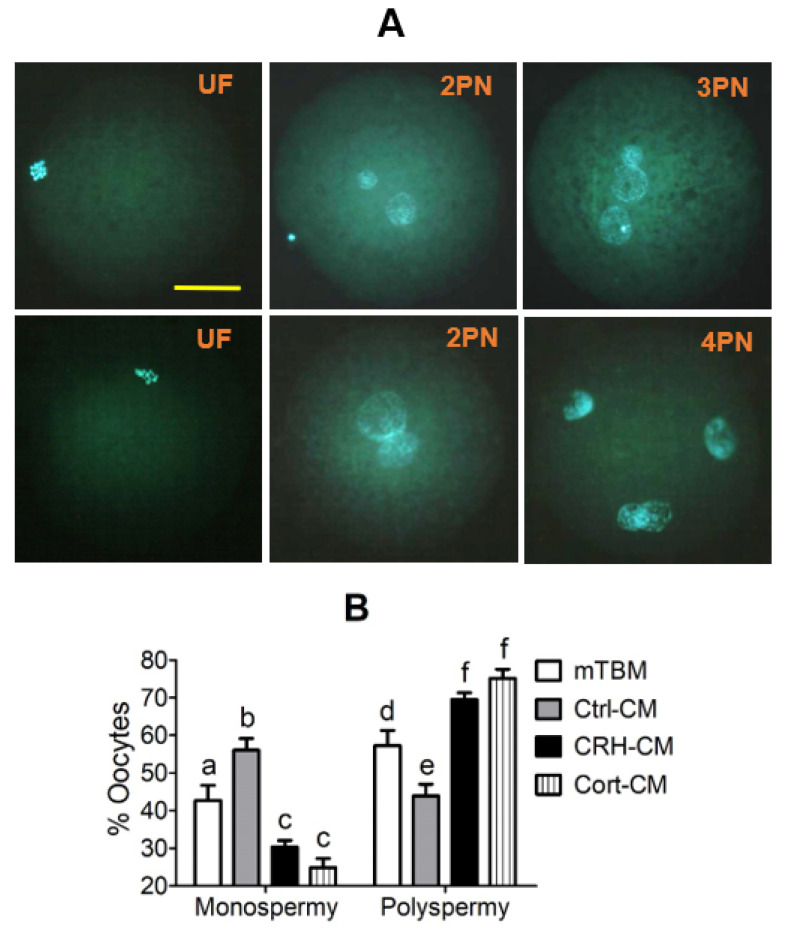
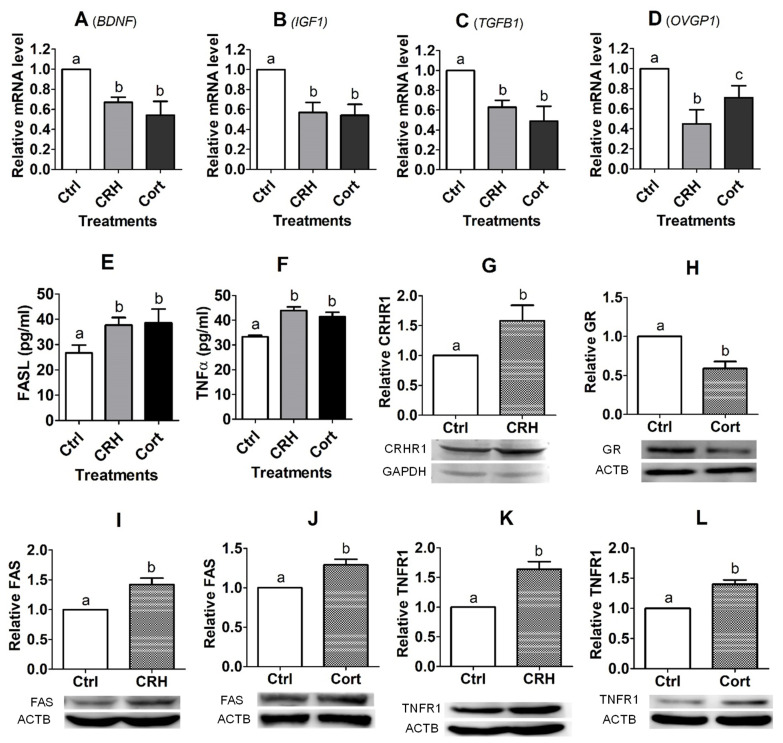
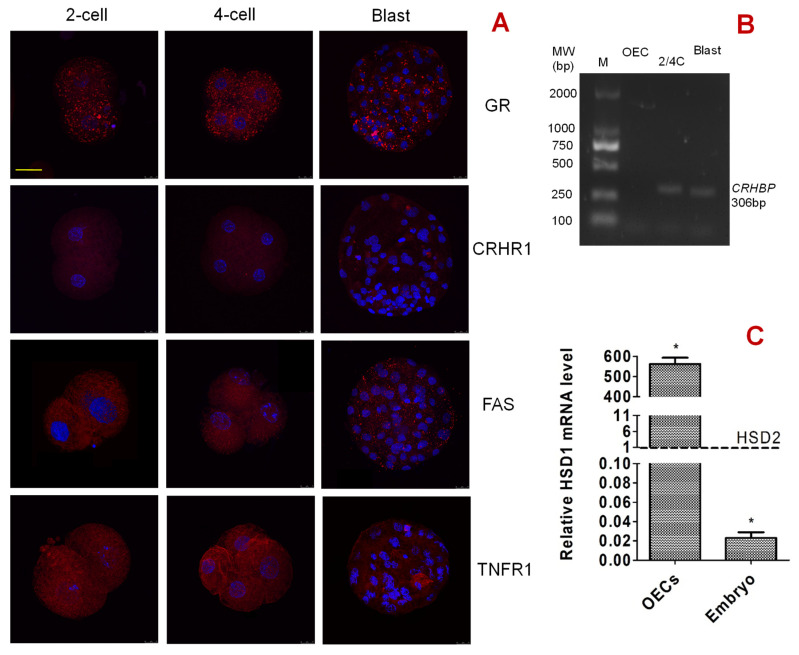
Previous studies show that stressful events after ovulation in sows significantly impaired the embryo cleavage with a significant elevation of blood cortisol. However, the effects of corticotropin-releasing hormone (CRH), adrenocorticotropic hormone (ACTH) and cortisol on fertilization and embryo development remain to be specified, and whether they damage pig embryos directly or indirectly is unclear. This study demonstrated that embryo development was unaffected when pig parthenotes were cultured with different concentrations of CRH/ACTH/cortisol. However, embryo development was significantly impaired when the embryos were cocultured with pig oviductal epithelial cells (OECs) in the presence of CRH/cortisol or cultured in medium that was conditioned with CRH/cortisol-pretreated OECs (CRH/cortisol-CM). Fertilization in CRH/cortisol-CM significantly increased the rates of polyspermy. CRH and cortisol induced apoptosis of OECs through FAS and TNFα signaling. The apoptotic OECs produced less growth factors but more FASL and TNFα, which induced apoptosis in embryos. Pig embryos were not sensitive to CRH because they expressed no CRH receptor but the CRH-binding protein, and they were tolerant to cortisol because they expressed more 11-beta hydroxysteroid dehydrogenase 2 (HSD11B2) than HSD11B1. When used at a stress-induced physiological concentration, while culture with either CRH or cortisol alone showed no effect, culture with both significantly increased apoptosis in OECs. In conclusion, CRH and cortisol impair pig fertilization and preimplantation embryo development indirectly by inducing OEC apoptosis via the activation of the FAS and TNFα systems. ACTH did not show any detrimental effect on pig embryos, nor OECs.

Keywords: HPA hormones; apoptosis; embryo development; oviduct; pig.


Conflict of interest statement

The authors declare no conflict of interest.

Figures

Figure 1
Figure 1
Effects of culture with different concentrations of corticotrophin-releasing hormone (CRH), adrenocorticotropic hormone (ACTH) or cortisol (Cort) on the embryo development of pig activated oocytes. Graphs (AC) show embryo development after culture with CRH, ACTH and Cort, respectively. Matured (MII) oocytes showing first polar body (PB1) were chemically activated and cultured in the presence of different concentrations of CRH, ACTH or Cort before observation for embryo development. Three concentrations of each hormone, plus a blank control, were used. Each treatment was repeated four times with each replicate containing approximately 25 MII oocytes. While 2-cell and 4-cell embryos were observed at 48 h, blastocysts were observed on day 6 after the onset of embryo culture. Percentages of 2-cell, 4-cell and blastocyst (Blast) embryos were calculated from MII oocytes, 2-cell and 4-cell embryos, respectively. Cell numbers (Cell No) per blastocyst were counted from all the blastocysts collected from each treatment. No significant effect of any concentration of any hormone was observed on any stage of embryo development.
Figure 2
Figure 2
Effects of treatment with corticotrophin-releasing hormone (CRH), adrenocorticotropic hormone (ACTH) or cortisol (Cort) on the apoptosis of pig oviduct epithelial cells (OECs). While graphs (AC) show Hoechst staining-revealed percentages of apoptotic cells following culture of OECs with different concentrations of CRH, ACTH or Cort, respectively, graphs (DF) show flow cytometry-revealed percentages of healthy (H), early apoptotic (E) and late apoptotic/necrotic (L/N) cells, following the culture of OECs with CRH (2 × 10⁻⁶ M), ACTH (1 × 10⁻⁸ M) or Cort (1 × 10⁻⁶ M), respectively. Graphs (G,H) show relative levels of active caspase 3 (CASP3) as revealed by Western blotting after the OECs were cultured with CRH (2 × 10⁻⁶ M) and Cort (1 × 10⁻⁶ M), respectively. Graph (I) shows flow cytometry-revealed percentages of healthy (H), early apoptotic (E) and late apoptotic/necrotic (L/N) cells, following the culture of OECs without hormone (Ctrl) or with CRH (1 × 10⁻⁸ M) or Cort (4 × 10⁻⁷ M) alone or both (Ch + Ct). Each treatment was repeated three times with each replicate including cells from one well of a 12-well culture plate. a–d: Values with a different letter above bars differ (p < 0.05). Panel (J) shows micrographs after Hoechst 33342 staining (upper row) and the flow cytometry graphs (lower row) following OECs were cultured with CRH (2 × 10⁻⁶ M), ACTH (1 × 10⁻⁸ M) or Cort (1 × 10⁻⁶ M), respectively. Control (Ctrl) OECs were cultured without stress hormone. In the Hoechst-staining micrographs, the apoptotic cells with pyknotic nuclei were heavily stained by Hoechst 33342 emitting bright light. The micrographs were taken at an original magnification of ×400. In the flow cytometry graphs, the healthy, early apoptotic and late apoptotic/necrotic cells are located in the Q4, Q3 and Q2 areas, respectively. The Q1 area contains mechanically damaged cell debris.
Figure 3
Figure 3
In vitro development and apoptosis of pig embryos cocultured with oviduct epithelial cells (OECs) in the presence of corticotrophin-releasing hormone (CRH), adrenocorticotropic hormone (ACTH) or cortisol (Cort) or cultured in medium conditioned by OECs pretreated with CRH, ACTH or cortisol. In graphs (AC), MII oocytes showing first polar body (PB1) were chemically activated and cocultured (coC) with OECs in the presence of CRH (2 × 10⁻⁶ M), ACTH (1 × 10⁻⁸ M) or Cort (1 × 10⁻⁶ M), respectively, before observation for embryo development. Control (Ctrl) oocytes were cocultured with OECs without stress hormones. In graphs (DG), activated oocytes were cultured in conditioned medium (CM) before examination for embryo development or apoptosis, and the CM was conditioned for 24 h with OECs that had been pretreated for 48 h with CRH (2 × 10⁻⁶ M), ACTH (1 × 10⁻⁸ M) or Cort (1 × 10⁻⁶ M), respectively. Control CM was conditioned with OECs pretreated without stress hormones. CRH + AN: OECs were pretreated for 48 h with both CRH and antalarmin (2 × 10⁻⁶ M); Cort + RU: OECs were pretreated for 48 h with both Cort and RU486 (1 × 10⁻⁶ M). While 2-cell and 4-cell embryos were observed at 48 h, blastocysts were observed on day 6 after the onset of embryo culture. Percentages of 2-cell, 4-cell and blastocyst (Blast) embryos were calculated from MII oocytes, 2-cell and 4-cell embryos, respectively. Graph G shows mRNA levels of BCL2 and BAX and the ratio of BCL2/BAX (BC/BX) as measured by one step RT-PCR. a–f: Values with a different letter above the bars differ significantly (p < 0.05).
Figure 4
Figure 4
Fertilization of pig oocytes in modified Tris Buffer Media (mTBM)-Conditioning Media (mTBM-CM) conditioned with corticotrophin-releasing hormone (CRH)- or cortisol (Cort)-pretreated oviduct epithelial cells (OECs). Panel (A) shows micrographs of unfertilized (UF) oocytes, and fertilized oocytes with two (2PN), three (3PN) or four pronuclei (4PN) as observed under a fluorescence microscope at a magnification of ×400 following Hoechst 33342 staining. The bar is 32 μm and applies to all images. Graph (B) shows percentages of oocytes with monospermy or polyspermy after insemination of oocytes in mTBM alone, or in mTBM-CM conditioned with OECs without hormone pretreatment (Ctrl-CM), or with OECs pretreated with either CRH (CRH-CM) or cortisol (Cort-CM). a–f: Values with a different letter above the bars differ significantly (p < 0.05).
Figure 5
Figure 5
Effects of culture with corticotrophin-releasing hormone (CRH) or cortisol (Cort) on expression of growth factors, oviduct-specific glycoprotein (OVGP1), Fas ligand (FASL)/tumor necrosis factor (TNF) α and their receptors, and CRH/glucocorticoid receptors (GR) in pig oviduct epithelial cells (OECs). Pig OECs were cultured without (Ctrl) or with CRH (2 × 10⁻⁶ M) or Cort (1 × 10⁻⁶ M) for 48 h before examination. Graphs (AD) show relative levels (RT-PCR results) of brain-derived neurotropic factor (BDNF), insulin-like growth factor 1 (IGF1), transforming growth factor β1 (TGFB1) and OVGP1 mRNAs, respectively. Graphs (E,F) show levels of FASL and TNFα proteins (ELISA results), respectively. Graphs (GL) show relative levels of CRH receptor (CRHR1), GR, FAS and TNFR1, respectively, as revealed by Western blotting. a–c: Values with a different letter above bars differ significantly (p < 0.05).
Figure 6
Figure 6
Effects of knocking down Fas ligand (FASL) or tumor necrosis factor (TNFα) on corticotrophin-releasing hormone (CRH)- or cortisol (Cort)-induced apoptosis of oviduct epithelial cells (OECs). Graphs (A,B) show FASL and TNFα concentration, respectively, in CM conditioned for 48 h without hormones with OECs transfected with negative control (NC), FASL siRNA-1 (FL1), -2 (FL2) or -3 (FL3), or with TNFα siRNA-1 (TN1), -2 (TN2) or -3 (TN3). Graphs (C,D) show the percentages of healthy (H), early apoptotic (E) or late apoptotic and necrotic (L/N) cells as revealed by flow cytometry following OECs transfected with NC, FL1 or TN3 siRNAs were cultured for 48 h in the presence of CRH and Cort, respectively. Panel (E) shows the flow cytometry graphs after the OECs transfected with NC, FL1 or TN3 siRNAs were cultured with CRH or Cort for 48 h. The healthy, early apoptotic and late apoptotic/necrotic cells are located in the Q4, Q3 and Q2 areas, respectively. The Q1 area contains mechanically damaged cell debris. Graph (F) shows the percentages of blastocysts (Blast) and cell number per blastocyst (Cell No) following embryo culture in CM conditioned in the presence of both 1 × 10⁻⁸ M CRH and 4 × 10⁻⁷ M cortisol with OECs that had been transfected with NC siRNA or co-transfected with both FASL siRNA-1 and TNFα siRNA-3 (F1 + T3). a–d: Values with a different letter above the bars differ significantly (p < 0.05).
Figure 7
Figure 7
Expression of corticotrophin-releasing hormone receptor (CRHR1), glucocorticoid receptor (GR), FAS, tumor necrosis factor receptor (TNFR1), corticotrophin-releasing hormone-binding protein (CRHBP) and hydroxysteroid 11-beta dehydrogenase 1/2 (HSD11B1/HSD11B2) in pig preimplantation embryos. Panel (A) shows expression of CRHR1, GR, FAS, and TNFR1 in 2-cell, 4-cell and blastocyst (Blast) embryos, as revealed by immunofluorescence microscopy. The micrographs are merged images from laser confocal microscopy with target proteins and DNA colored red and blue, respectively. The bar is 50 μm and applies to all images. While 2-cell and 4-cell embryos were observed at 48 h, the blastocysts were observed on day 6 after the onset of embryo culture. Panel (B) shows mRNA expression of CRHBP in pig oviduct epithelial cells (OECs), 2- or 4-cell embryos (2/4C) and blastocysts (Blast), as revealed by a general PCR amplification. The annealing temperature for the general PCR amplification was set to 58 °C. M: DM 2000 DNA marker. The molecular weight for CRHBP mRNA is 306 bp. Graph (C) shows relative levels of HSD11B1 (HSD1) and HSD11B2 (HSD2) mRNAs in pig embryos and OECs. The level of HSD11B2 mRNA was set as one (dotted line), and the level of HSD11B1 mRNA was expressed relative to it. * Indicates significant difference from the value of HSD11B2.
Figure 8
Figure 8
Possible pathways by which corticotrophin-releasing hormone (CRH) or cortisol (Cort) impairs preimplantation development of pig embryos. Please refer to the last paragraph of the Discussion for detailed explanations for the figure. “−”: Not expressed; “+”: Expressed; “↑”: Increased; “↓”: Decreased.

Similar articles

Cited by

References

    1. Glynn L.M., Wadhwa P.D., Dunkel-Schetter C., Chicz-Demet A., Sandman C.A. When stress happens matters: Effects of earthquake timing on stress responsivity in pregnancy. Am. J. Obstet. Gynecol. 2001;184:637–642. doi: 10.1067/mob.2001.111066. - DOI - PubMed
    1. Hobel C., Culhane J. Role of psychosocial and nutritional stress on poor pregnancy outcome. J. Nutr. 2003;133:1709S–1717S. doi: 10.1093/jn/133.5.1709S. - DOI - PubMed
    1. Wilcox A.J., Baird D.D., Weinberg C.R. Time of implantation of the conceptus and loss of pregnancy. N. Engl. J. Med. 1999;340:1796–1799. doi: 10.1056/NEJM199906103402304. - DOI - PubMed
    1. Humblot P. Use of pregnancy specific proteins and progesterone assays to monitor pregnancy and determine the timing, frequencies and sources of embryonic mortality in ruminants. Theriogenology. 2001;56:1417–1433. doi: 10.1016/S0093-691X(01)00644-6. - DOI - PubMed
    1. Burkus J., Cikos S., Fabian D., Kubandova J., Czikkova S., Koppel J. Maternal restraint stress negatively influences growth capacity of preimplantation mouse embryos. Gen. Physiol. Biophys. 2013;32:129–137. doi: 10.4149/gpb_2013010. - DOI - PubMed

Substances