. 2022 Nov 26;14(23):5836.
doi: 10.3390/cancers14235836.

The Chick Embryo Xenograft Model for Malignant Pleural Mesothelioma: A Cost and Time Efficient 3Rs Model for Drug Target Evaluation

Affiliations

The Chick Embryo Xenograft Model for Malignant Pleural Mesothelioma: A Cost and Time Efficient 3Rs Model for Drug Target Evaluation

Sarah E Barnett et al. Cancers (Basel). .

Abstract

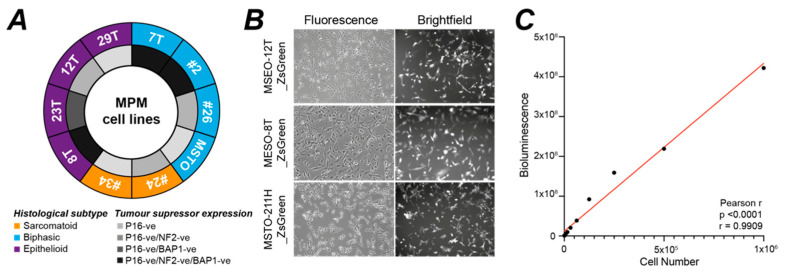
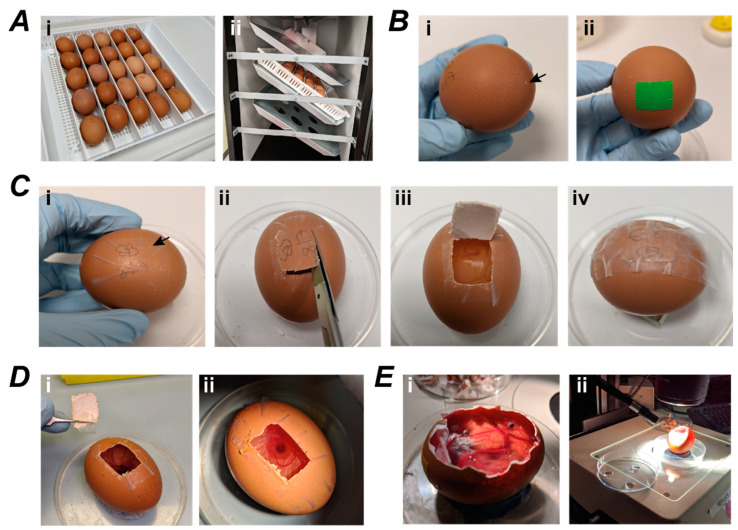
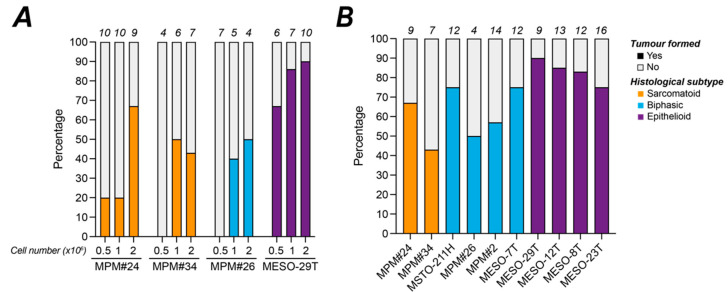
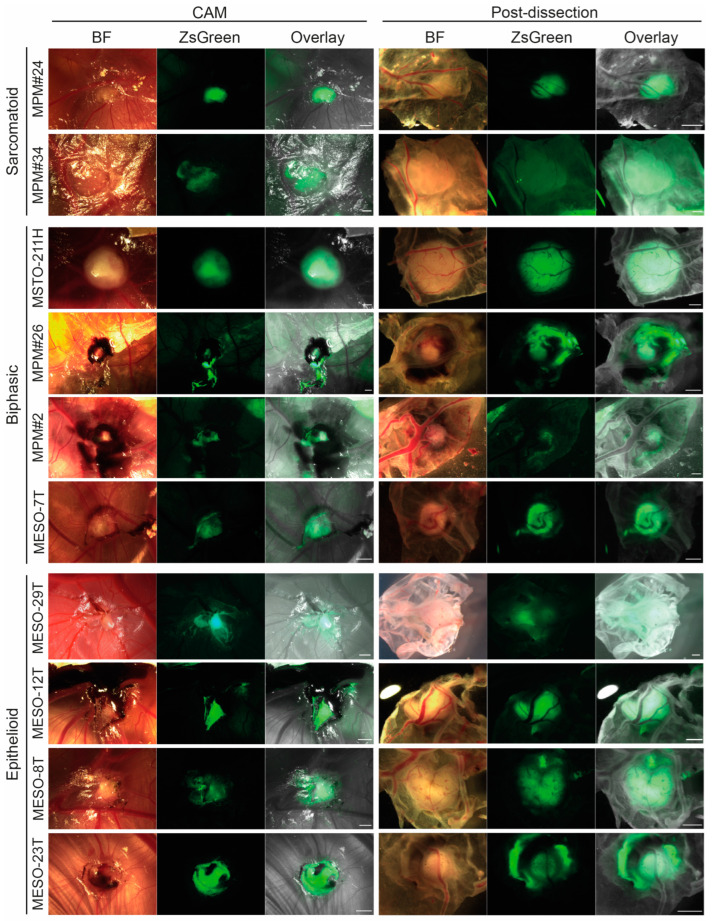
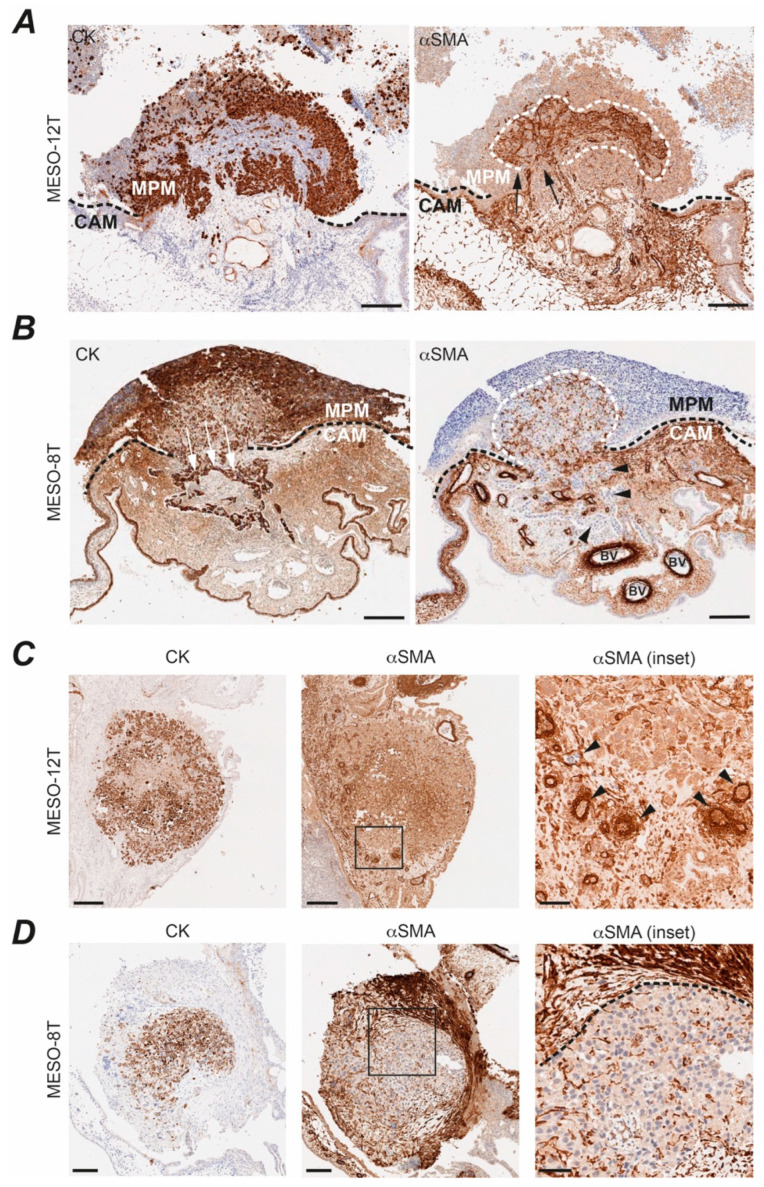
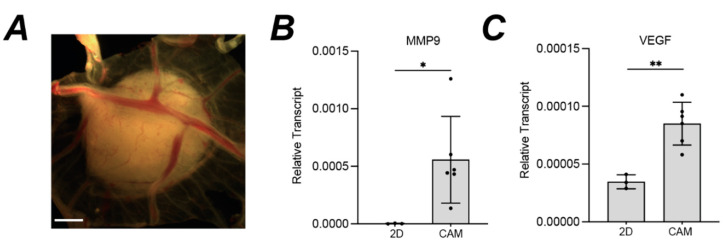
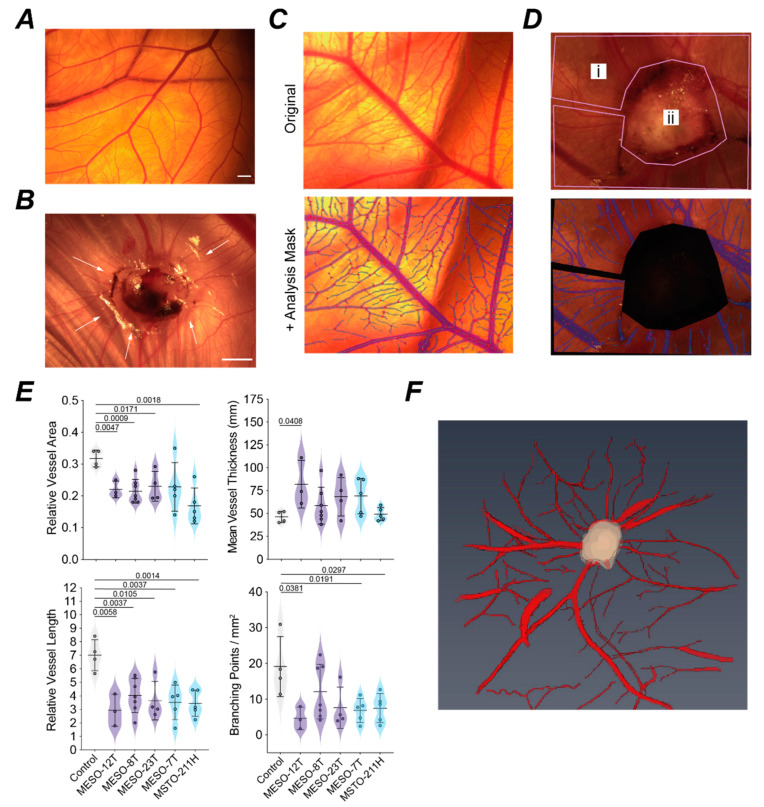
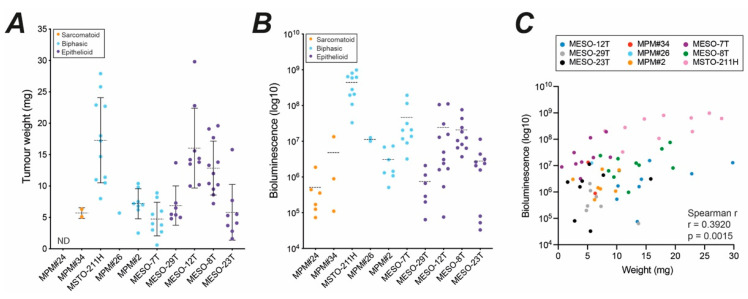
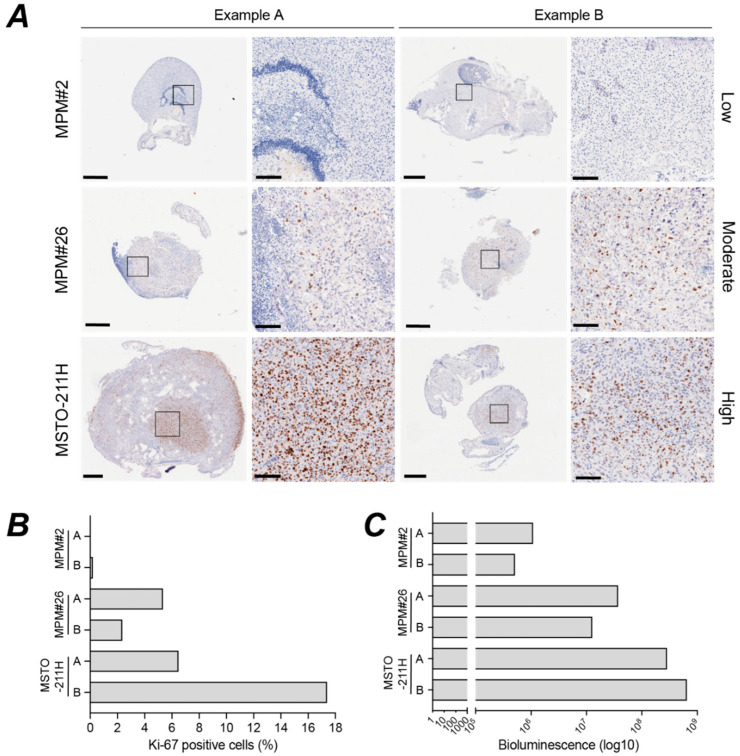
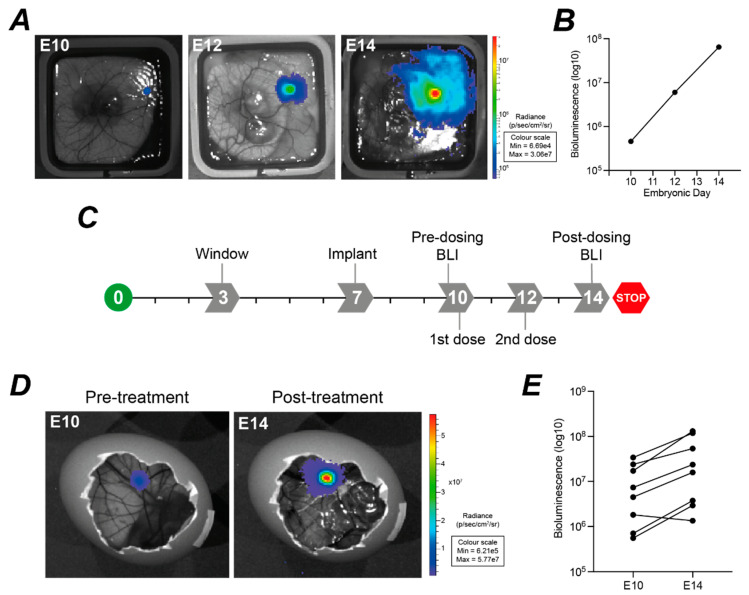
Malignant pleural mesothelioma (MPM) has limited treatment options and poor prognosis. Frequent inactivation of the tumour suppressors BAP1, NF2 and P16 may differentially sensitise tumours to treatments. We have established chick chorioallantoic membrane (CAM) xenograft models of low-passage MPM cell lines and protocols for evaluating drug responses. Ten cell lines, representing the spectrum of histological subtypes and tumour suppressor status, were dual labelled for fluorescence/bioluminescence imaging and implanted on the CAM at E7. Bioluminescence was used to assess viability of primary tumours, which were excised at E14 for immunohistological staining or real-time PCR. All MPM cell lines engrafted efficiently forming vascularised nodules, however their size, morphology and interaction with chick cells varied. MPM phenotypes including local invasion, fibroblast recruitment, tumour angiogenesis and vascular remodelling were evident. Bioluminescence imaging could be used to reliably estimate tumour burden pre- and post-treatment, correlating with tumour weight and Ki-67 staining. In conclusion, MPM-CAM models recapitulate important features of the disease and are suitable to assess drug targets using a broad range of MPM cell lines that allow histological or genetic stratification. They are amenable to multi-modal imaging, potentially offering a time and cost-efficient, 3Rs-compliant alternative to rodent xenograft models to prioritise candidate compounds from in vitro studies.

Keywords: 3Rs; CAM; MRI; bioluminescence; chick embryo; fluorescence; histology; mesothelioma; preclinical; xenograft.


Conflict of interest statement

The authors declare no conflict of interest.

Figures

Figure 1
Figure 1
Characteristics of MPM cell lines used for engraftment. (A) Summary of the ten MPM cell lines used in this study. Histological sub-type was defined by the supplying cell bank, tumour suppressor status was inferred from immunoblotting [48]; (B) MPM cell lines were transduced with lentiviral particles carrying pHIV-Luc-ZsGreen. Example fluorescence images of MESO-12T, MESO-8T and MSTO-211H cells grown in vitro show high efficiency of transduction (n = 1), other cell lines in Figure S1A; (C) Example in vitro analysis of luminescence signal shows proportionality with cell number for the MESO-8T cell line (n = 1), supporting kinetics data in Figure S1B.
Figure 2
Figure 2
Workflow for MPM cell engraftment on the CAM. (A) Fertilised eggs are placed horizontally in white trays (i) and incubated at 37 °C to initiate embryonic development. Trays are rotated 45° every 45 min to prevent membranes sticking to the shell (ii); (B) Prior to windowing on embryonic day 3 (E3), a hole is made in the wide base of the egg (i; arrowhead) to allow 5 mL albumin to be removed and then sealed with Nev’s label tape (ii); (C) To create the window, a hole is pricked in the eggshell as a starting point (arrowhead) and a piece of Scotch tape placed over the area where the window is to be cut (i). Scissors are used to the cut the window (ii) leaving one side attached (iii). The window is then sealed shut with Scotch tape (iv); (D) Cells are implanted on E7 by removing the window (i) to expose CAM underneath (ii). Once cells have been added to the CAM, the window is sealed shut again (Civ); (E) At E14 the window is enlarged (i) to allow inspection of the embryo and imaging of tumour nodules (ii).
Figure 3
Figure 3
Efficiency of MPM cell line engraftment on the CAM. (A,B) Stacked histograms show the percentage of viable eggs at E14 where tumour nodules had engrafted. (A) Experimental determination of the optimal cell number for im plantation on the CAM for 4 cell lines; (B) Engraftment efficiency for the 10 MPM cell lines implanted with 2 million cells; supporting survival data in Table S1. The number of viable engrafted eggs at E14 for each cell line is shown above the bars on each graph. All experiments were in ovo.
Figure 4
Figure 4
MPM cell lines all form vascularised tumour nodules on the CAM. Representative images of tumour nodules formed by each of the 10 MPM cell lines for the experiment shown in Figure 3. Nodules are shown in situ on the CAM in ovo (left) and post-dissection viewing the nodule from beneath (right). Scale bar 1 mm. BF, bright field.
Figure 5
Figure 5
Histological characterisation of MPM CAM nodule morphology, local invasion, fibroblast recruitment and tumour vascularisation. (A) MESO-12T nodule sagittal section; CK (MNF116; left) and αSMA (right); scale bar 200 µm. Black dashed line, CAM and MPM tumour interface; white dashed line, region of infiltrating chick fibroblast-like cells within the tumour nodule. Black arrows, αSMA-positive cells moving into tumour nodule. Supporting IHC in Figure S2A. (B) MESO-8T nodule sagittal section; CK (sc-81714; left) and αSMA (right); scale bar 200 µm. Black dashed line, CAM and MPM tumour interface; white dashed line, region of infiltrating chick fibroblasts within the tumour. BV, αSMA-positive blood vessels; arrow heads, αSMA-negative MPM cells invading CAM. Supporting IHC in Figure S3A. (C) Tumour nodule vascularisation. MESO-12T nodule section; CK (MNF116; left) and αSMA (middle); scale bar 250 µm. αSMA inset (left); scale bar 50 µm. Black arrow heads, blood vessels. Supporting IHC for other markers in Figure S2B. (D) Fibroblast encapsulation. MESO-8T nodule transverse section; CK (MNF116; left) and αSMA (middle); scale bar 100 µm. αSMA inset (left); scale bar 50 µm. White line, fibroblast encapsulation; supporting IHC in Figure S3C. All experiments were in ovo and at least two nodules were examined per cell line.
Figure 6
Figure 6
MPM tumour nodules increase transcription of invasive and angiogenic genes compared to 2D cultures. (A) Representative image of MSTO-211H tumour nodule used for RNA extraction, scale bar 1 mm; (B,C) qRT-PCR analysis comparing expression of MMP9 (B) and VEGF (C) transcript levels in MSTO-211H grown as 2D in vitro cultures (n = 3) versus 3D CAM nodules (n = 6). Mean expression shown relative to the mean of ACTB and GAPDH (2∆Cq), error bars SD, unpaired t-test, * p < 0.05, ** p < 0.01. Supporting data for housekeeping genes in Figure S5. All experiments were in ovo.
Figure 7
Figure 7
MPM tumour nodules remodel surrounding CAM vasculature. (A) Representative image of blood vessel branching on a normal non-tumour bearing CAM; scale bar 1 mm. (B) Radial remodelling of blood vessels (arrows) around an MPM nodule established by MESO-23T cells; scale bar 1 mm. (C,D) Example images of CAM vasculature for IKOSA analysis showing raw image (top) and analysis mask (below) for control non-tumour bearing CAM (C) and CAM vasculature around a MESO-7T nodule (D), (i) region used for vascular scoring, (ii) tumour nodule excluded. (E) Violin plots comparing characteristics of the CAM vasculature in non-tumour bearing CAM (control, n = 4) and in a 1 mm radius surrounding the tumour for MPM cell lines: MESO-12T (n = 3), MESO-8T (n = 7), MESO-23T (n = 4), MESO-7T (n = 5), MSTO-211H (n = 5). Histological sub-types: epithelioid (purple), biphasic (blue). Total vessel area and length are expressed relative to area of analysis (mm2). Normality was assessed by Shapiro–Wilk test and an unpaired t-test or Mann–Whitney test used as appropriate to compare tumour bearing CAMs to the control CAM group; p values indicate significant differences. (F) 3D rendered image derived from MRI analysis of the CAM vasculature around an MSTO-211H nodule. Supporting data in Figure S6B. All experiments were in ovo.
Figure 8
Figure 8
Bioluminescence imaging reliably estimates tumour burden. (A) Plots summarising measurement of individual tumours at E14 that were established from 2 million cells for each MPM cell line: tumour weight. MPM#34 n = 2, MSTO-211H n = 11, MPM#26 n = 1, MPM#2 n = 8, MESO-7T n = 9, MESO-29T n = 7, MESO-12T n = 8, MESO-8T n = 11, and MESO-23T n = 8. Dotted lines indicate the mean value for each cell type and error bars indicate standard deviation. ND, not done. (B) Plot summarising bioluminescence signal of individual tumours at E14. MPM#24 n = 6, MPM#34 n = 3, MSTO-211H n = 10, MPM#26 n = 2, MPM#2 n = 7, MESO-7T n = 9, MESO-29T n = 6, MESO-12T n = 12, MESO-8T n = 10, and MESO-23T n = 10. Dotted lines indicate the mean value for each cell type. (C) Positive correlation between bioluminescence signal (panel B) and dissected tumour weight (panel A); Spearman r = 0.39, p = 0.0015, n = 63. Correlation for individual cell lines in Figure S7. All experiments were in ovo.
Figure 9
Figure 9
Bioluminescence signal corresponds closely with Ki-67 staining for proliferating cells. (A) Ki-67 staining of two independent MPM nodules for each of three MPM cell lines chosen as examples of low, moderate, and high staining. Whole tumour nodules (left, scale bar 500 µm) and higher magnification of regions (right, scale bar 100 µm). Supporting IHC for other markers in Figure S8. (B) Ki-67 score determined by Qupath analysis of images show in A (n = 2). Supporting data in Figure S9A. (C) Corresponding bioluminescence signal for the tumours shown in A (n = 2). Pearson correlation between Ki-67 score and bioluminescence, r = 0.96, p = 0.0023. Supporting data in Figure S9B. All experiments were in ovo.
Figure 10
Figure 10
Bioluminescence imaging can be used to measure longitudinal responses. (A,B), Example of bioluminescence signal at E10, E12 and E14 monitoring ex ovo growth of an untreated MESO-8T tumour nodule. (C) Proposed experimental timeline for BLI imaging to evaluate xenografts pre- and post-dosing. (D,E) Comparison of bioluminescence signal for in ovo MSTO-211H tumour nodules at E10 and E14, following two yolk sac injections of PBS at E10 and E12 (n = 8).

References

    1. Takahashi K., Landrigan P.J., Collegium R. The Global Health Dimensions of Asbestos and Asbestos-Related Diseases. Ann. Glob. Health. 2016;82:209–213. doi: 10.1016/j.aogh.2016.01.019. - DOI - PubMed
    1. Blum Y., Meiller C., Quetel L., Elarouci N., Ayadi M., Tashtanbaeva D., Armenoult L., Montagne F., Tranchant R., Renier A., et al. Dissecting heterogeneity in malignant pleural mesothelioma through histo-molecular gradients for clinical applications. Nat. Commun. 2019;10:1333. doi: 10.1038/s41467-019-09307-6. - DOI - PMC - PubMed
    1. Galateau-Salle F., Churg A., Roggli V., Travis W.D., World Health Organization Committee for Tumors of the Pleura The 2015 World Health Organization Classification of Tumors of the Pleura: Advances since the 2004 Classification. J. Thorac. Oncol. 2016;11:142–154. doi: 10.1016/j.jtho.2015.11.005. - DOI - PubMed
    1. Ohara Y., Enomoto A., Tsuyuki Y., Sato K., Iida T., Kobayashi H., Mizutani Y., Miyai Y., Hara A., Mii S., et al. Connective tissue growth factor produced by cancer-associated fibroblasts correlates with poor prognosis in epithelioid malignant pleural mesothelioma. Oncol. Rep. 2020;44:838–848. doi: 10.3892/or.2020.7669. - DOI - PMC - PubMed
    1. Li Q., Wang W., Yamada T., Matsumoto K., Sakai K., Bando Y., Uehara H., Nishioka Y., Sone S., Iwakiri S., et al. Pleural mesothelioma instigates tumor-associated fibroblasts to promote progression via a malignant cytokine network. Am. J. Pathol. 2011;179:1483–1493. doi: 10.1016/j.ajpath.2011.05.060. - DOI - PMC - PubMed

LinkOut - more resources