. 2022 Nov 29;14(23):5909.
doi: 10.3390/cancers14235909.

Adrenomedullin Secreted by Melanoma Cells Promotes Melanoma Tumor Growth through Angiogenesis and Lymphangiogenesis

Affiliations

Adrenomedullin Secreted by Melanoma Cells Promotes Melanoma Tumor Growth through Angiogenesis and Lymphangiogenesis

Zohra Benyahia et al. Cancers (Basel). .

Abstract

Introduction: Metastatic melanoma is an aggressive tumor and can constitute a real therapeutic challenge despite the significant progress achieved with targeted therapies and immunotherapies, thus highlighting the need for the identification of new therapeutic targets. Adrenomedullin (AM) is a peptide with significant expression in multiple types of tumors and is multifunctional. AM impacts angiogenesis and tumor growth and binds to calcitonin receptor-like receptor/receptor activity-modifying protein 2 or 3 (CLR/RAMP2; CLR/RAMP3).

Methods: In vitro and in vivo studies were performed to determine the functional role of AM in melanoma growth and tumor-associated angiogenesis and lymphangiogenesis.

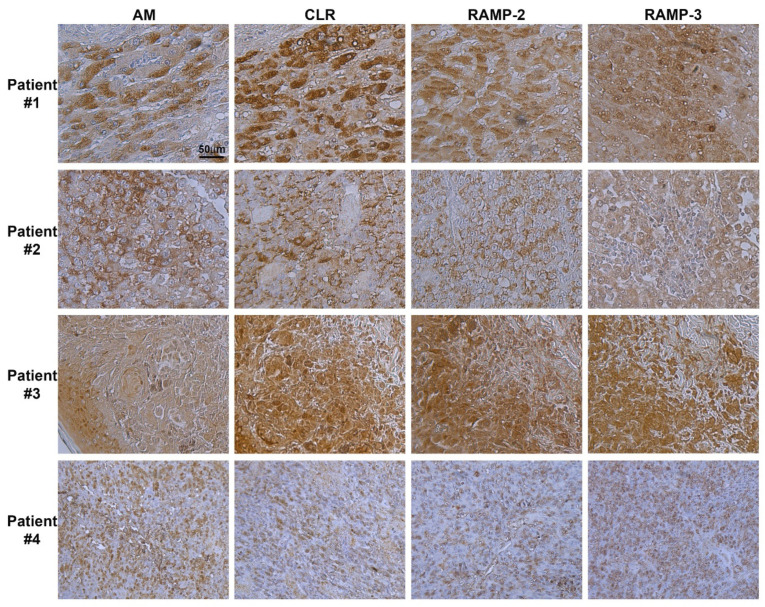
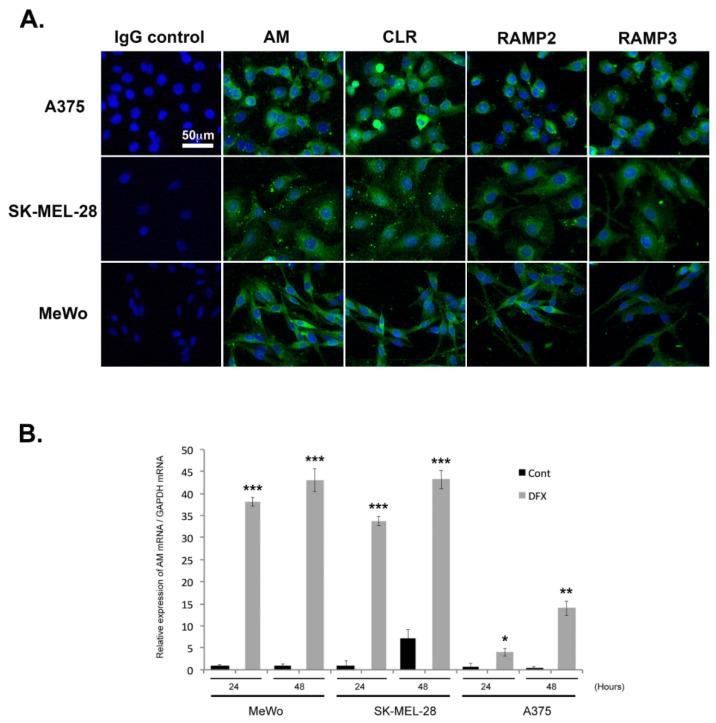
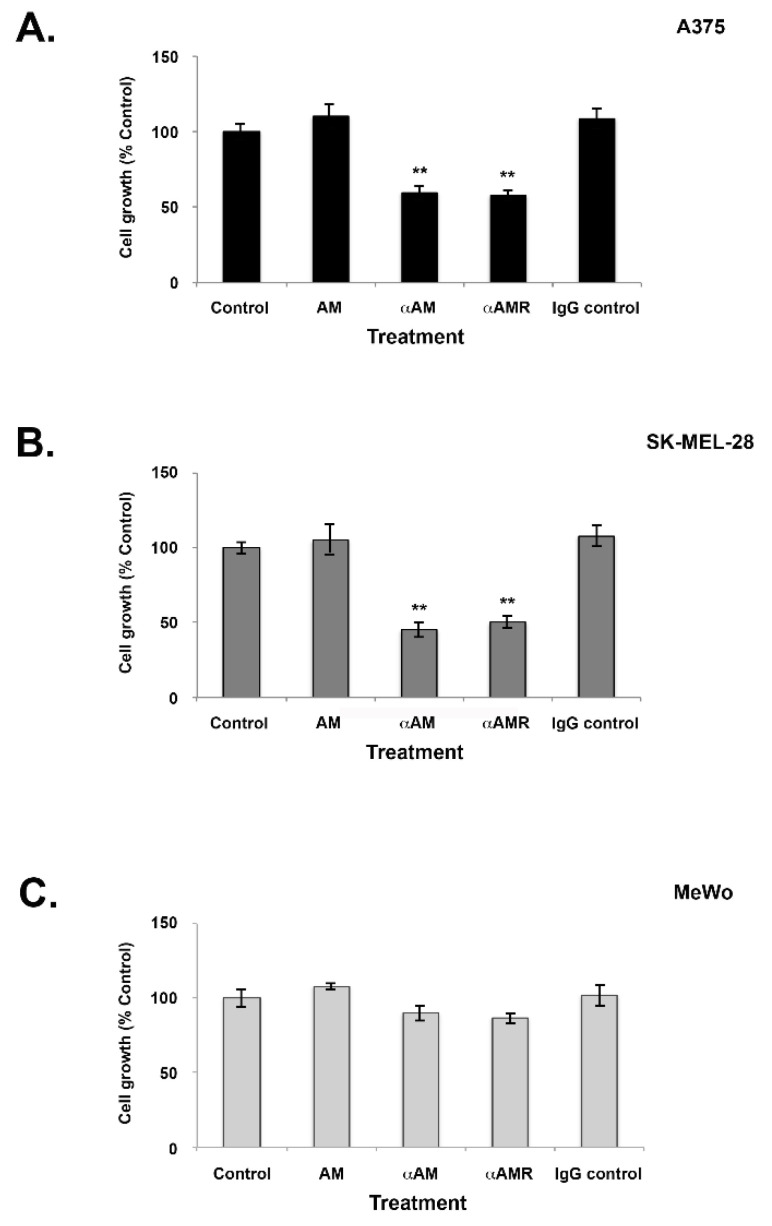
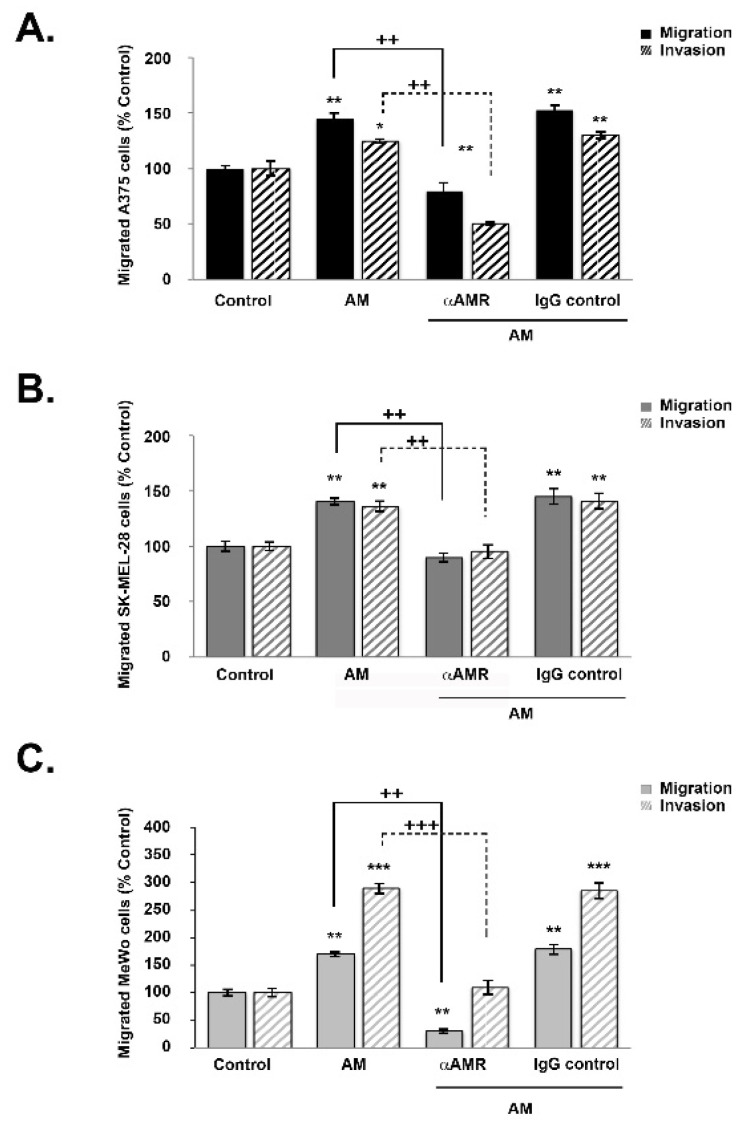
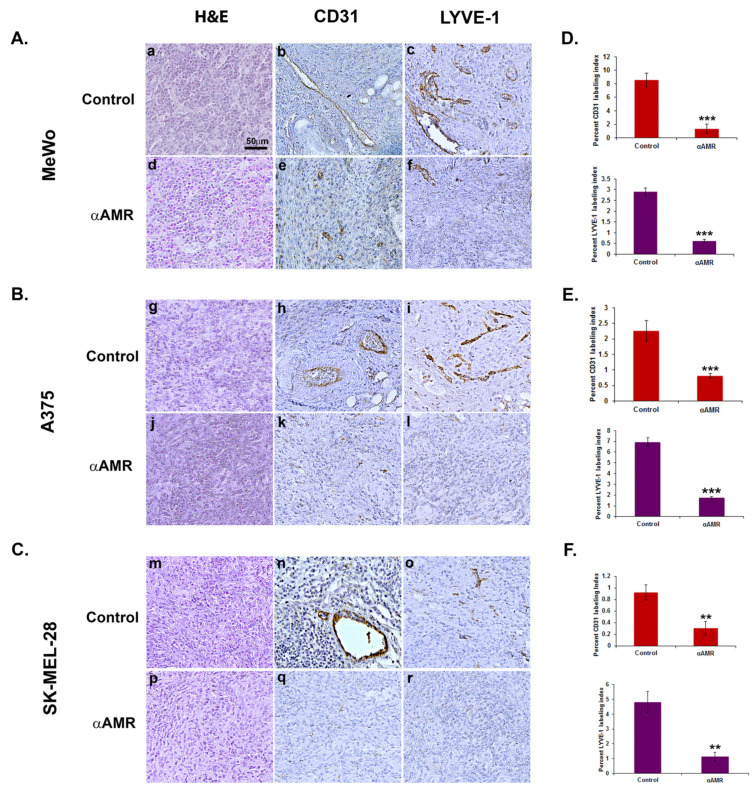
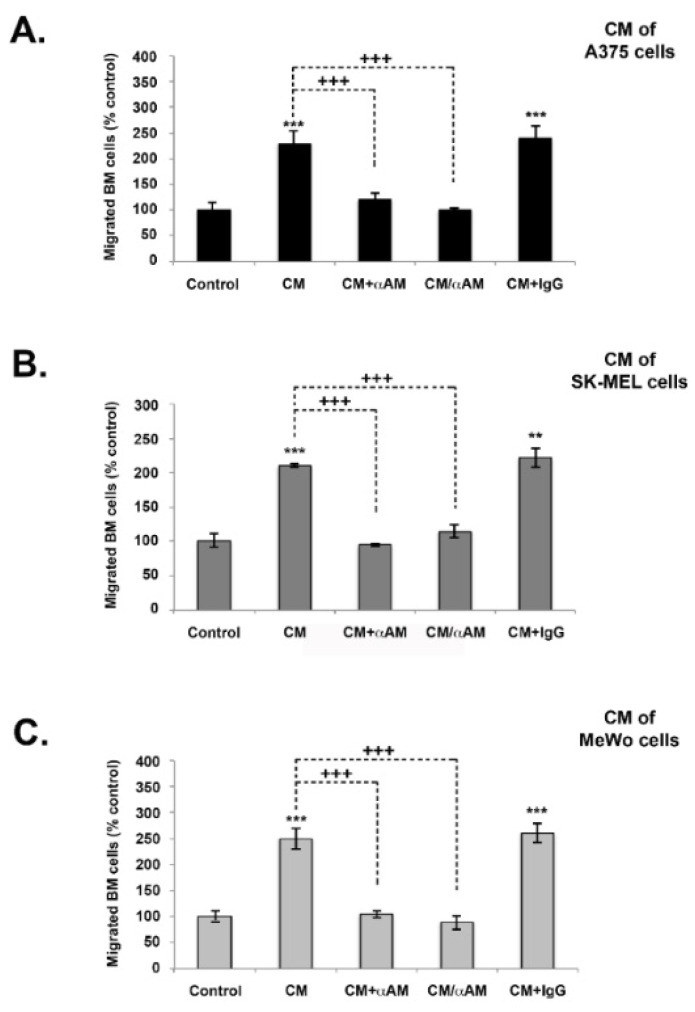
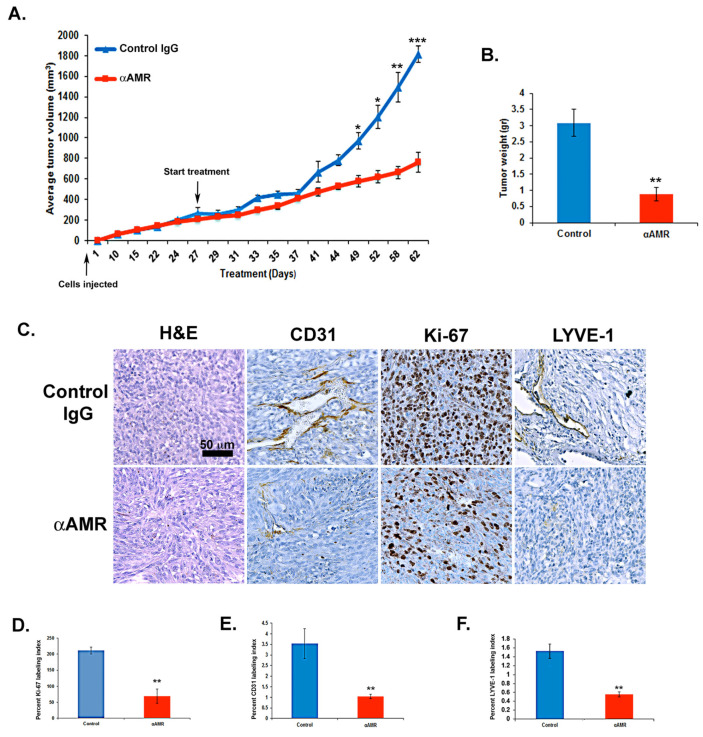
Results: In this study, AM and AM receptors were immunohistochemically localized in the tumoral compartment of melanoma tissue, suggesting that the AM system plays a role in melanoma growth. We used A375, SK-MEL-28, and MeWo cells, for which we demonstrate an expression of AM and its receptors; hypoxia induces the expression of AM in melanoma cells. The proliferation of A375 and SK-MEL-28 cells is decreased by anti-AM antibody (αAM) and anti-AMR antibodies (αAMR), supporting the fact that AM may function as a potent autocrine/paracrine growth factor for melanoma cells. Furthermore, migration and invasion of melanoma cells increased after treatment with AM and decreased after treatment with αAMR, thus indicating that melanoma cells are regulated by AM. Systemic administration of αAMR reduced neovascularization of in vivo Matrigel plugs containing melanoma cells, as demonstrated by reduced numbers of vessel structures, which suggests that AM is one of the melanoma cells-derived factors responsible for endothelial cell-like and pericyte recruitment in the construction of neovascularization. In vivo, αAMR therapy blocked angiogenesis and lymphangiogenesis and decreased proliferation in MeWo xenografts, thereby resulting in tumor regression. Histological examination of αAMR-treated tumors showed evidence of the disruption of tumor vascularity, with depletion of vascular endothelial cells and a significant decrease in lymphatic endothelial cells.

Conclusions: The expression of AM by melanoma cells promotes tumor growth and neovascularization by supplying/amplifying signals for neoangiogenesis and lymphangiogenesis.

Keywords: A375; MeWo; SK-MEL-28; adrenomedullin; angiogenesis; invasion; lymphangiogenesis; melanoma; tumor growth.


Conflict of interest statement

The authors declare no conflict of interest.

Figures

Figure 1
Figure 1
Expression of AM and its receptors in human melanoma. Immunohistochemistry for AM, CLR, RAMP2, and RAMP3 in melanoma tissue. Strong cytoplasmic staining for AM, CLR, RAMP2, and RAMP3 is observed in melanoma cells. Stroma cells with weaker cytoplasmic staining are also observed.
Figure 2
Figure 2
Depiction of the extent to which AM signaling is expressed and regulated in melanoma cells. (A) AM and receptors expressed in melanoma cells depicted using immunofluorescence of A375, SK-MEL-28, and MeWo cells stained with antibodies against AM, CLR, RAMP2, and RAMP3, revealing localization in the cytoplasm. Negative control for immunostaining was achieved with IgG-control. (B) AM expression induced by a hypoxia mimetic in melanoma cells. Total RNA (1 μg, DNA free) prepared from MeWo, SK-MEL-28, and A375 cells were reverse transcribed into cDNA under normoxic or hypoxic conditions and relative AM mRNA was estimated using a real-time quantitative reverse transcriptase polymerase chain reaction. There were significant differences between cells treated with desferrioxamine mesylate (DFX) and untreated control cells in terms of AM expression: * p < 0.05; ** p < 0.01; *** p < 0.001. Each experiment is representative of five independent experiments. Results are shown as means ± SD.
Figure 3
Figure 3
Effect of AM on in vitro growth of melanoma cells. (AC) Cells were seeded at densities of 1 × 10³ (A375), 2 × 10³ (SK-MEL-28), and 4 × 10³ (MeWo) per well for the proliferation assay in 24 multiwell plates using a growth medium containing 2% of fetal bovine serum. AM (10−7 M), αAM (70 μg/mL), αAMRs (70 μg/mL), or control IgG (70 μg/mL) was added to the cells for 6 days of treatment. Six wells were prepared for each treatment for 3-(4,5-dimethylthiazol-2-yl)-2,5-diphenyltetrazolium bromide (MTT) analysis. ** p < 0.01. The values represent the mean ± SD of five independent experiments, each performed in triplicate.
Figure 4
Figure 4
AM regulates melanoma cell migration and invasion in vitro. (AC) The bottom wells of all chambers were filled with DMEM for A375 and SK-MEL-28 cells or MEM for MeWo cells containing 2% fetal bovine serum in the presence of control buffer (control) or AM (10−7 M). A375 ((A), 2 × 10⁴ cells), SK-MEL-28 ((B), 2 × 10⁴ cells), or MeWo ((C), 1 × 10⁵ cells) cells pretreated for 30 min with αAMR (70 μg/mL) or control IgG (70 μg/mL) were placed in the upper chamber and incubated for 16 h at 37 °C. The cells that migrated were stained with 4′, 6′-diamidino-2-phenylindole and counted at 50x magnification using a microscope. Data are expressed as the number of migrated cells in 10 high-power fields, and the values represent the mean ± SD of four independent experiments, each performed in triplicate. The asterisk (*) is used for comparison to control cells (* p < 0.05; ** p < 0.01; *** p < 0.001) and the plus symbol (+) is used for comparison to AM-treated cells (++ p < 0.01; +++ p < 0.001).
Figure 5
Figure 5
Analysis of in vivo Matrigel plug bioassays indicates that AM secreted by melanoma cells induces angiogenesis and lymphangiogenesis. (AC) A total of 0.8 mL of growth factor-depleted Matrigel was admixed to MeWo ((A), 1 × 10⁶ cells) (a,b,c,d,e,f), A375 ((B), 1.5 × 10⁶ cells), or SK-MEL-28 ((C), 2 × 10⁶ cells) cells and administered to C57BL/6 mice via s.c. injection at the abdominal midline. Administration of αAMRs or control IgG was conducted intraperitoneally every three days (starting 24 h after initial Matrigel injection and for 15 days thereafter) in C57BL/6 mice. Formalin was used to fix Matrigel plugs, which were then embedded, sectioned, and used for immunohistochemical analysis. Figure 5A–C depict microphotographs of histochemical-stained Matrigel sections for H & E (a,d,g,j,m,p), blood vessel staining with the CD-31 antibody (b,e,h,k,n,q), and lymphatic vessels with the anti-LYVE-1 antibody (c,f,i,l,o,r) derived from Matrigel plugs mixed with melanoma cells treated with either αAMRs or control IgG. Each panel represents multiple fields, including five plugs in each group. Scale bar, 50 μm. (DF) Quantitative assessment of cell density for CD31- and LYVE-1-positive cells as assessed by staining conducted on the entire surface of the corresponding slides using CALOPIX software. (v2.10.16 by Tribvn) MBF_Image J 1.52a software was used for the analysis. The values represent the means ± SD (** p < 0.01; *** p < 0.001).
Figure 6
Figure 6
The effect of in vitro melanoma cells-conditioned medium (CM) induced invasion of BMDCs in the AM signaling blockade. (AC) In vitro regulation of BMDCs by A375, SK-MEL-28, and MeWo cells-CM. For all chambers, the bottom well was filled with melanoma cells-CM, while the control well was filled with DMEM containing 2% FBS (control). Immunoreactive AM secreted in CM was neutralized with pretreatment with αAM (70 μg/mL) for 30 min. αAMRs (70 μg/mL) or control IgG (70 μg/mL) was used to pre-treat bone marrow cells (5 × 10⁵ cells), which were then placed in the upper chamber and incubated (see Materials and Methods). Migrated cells were stained with DAPI and counted under the microscope at 50× magnification. Numbers represent the number of migrated cells in 10 high-power fields, given as means ± SD of four independent experiments, each performed in triplicate. The asterisk (*) is used for comparison to control cells (** p < 0.01; *** p < 0.001) and the plus symbol (+) is used for comparison to CM-treated cells (+++ p < 0.001).
Figure 7
Figure 7
AM signaling blockade inhibited the growth of MeWo xenografts in vivo. (A) MeWo cells (2 × 10⁶) were injected subcutaneously into the flanks of athymic nude mice (6 weeks old) (n = 10 in each group). Mice with tumor volumes averaging 250 ± 50 mm3 received intraperitoneal injections of αAMRs (12 mg/kg) every 3 days. Control mice were treated with 12 mg/kg of nonspecific isotype control immunoglobulin G (IgG). Measurements of tumor volume demonstrate differences in the growth of animals treated with αAMRs (n = 10) and control IgG (n = 10) during the 52-day schedule, * p < 0.05; ** p < 0.01; *** p < 0.001. (B) Tumors were weighed immediately after excision and the average tumor is indicated as the mean ± SD (n = 10), ** p < 0.01. (C) αAMRs-treated tumors are less vascular and depleted of vascular and lymphatic endothelial cells. LYVE-1, CD31, and Ki-67 antibodies and hematoxylin and eosin were used to stain the tumor sections. The figure depicts Ki-67 positive cells, with each section analyzed using 10 magnification fields (400×). Microvessel density was determined using immunohistochemical staining of the CD-31 marker of the endothelial cell surface. The density of cells staining positive for Ki-67 (D), CD-31 (E), or LYVE-1 (F) was assessed quantitatively based on the entire slide surface using CALOPIX Software v2.10.16 by Tribvn. Analysis was conducted with MVF_Image J1.52a software. The values shown represent the means ± SD, ** p < 0.01.

References

    1. Streit M., Detmar M. Angiogenesis, lymphangiogenesis, and melanoma metastasis. Oncogene. 2003;22:3172–3179. doi: 10.1038/sj.onc.1206457. - DOI - PubMed
    1. Greig R., Dunnington D., Murthy U., Anzano M. Growth Factors as Novel Therapeutic Targets in Neoplastic Disease. Cancer Surv. 1988;7:653–674. - PubMed
    1. Fernandez-Sauze S., Delfino C., Mabrouk K., Dussert C., Chinot O., Martin P.-M., Grisoli F., Ouafik L. Effects of adrenomedullin on endothelial cells in the multistep process of angiogenesis: Involvement of CRLR/RAMP2 and CRLR/RAMP3 receptors. Int. J. Cancer. 2003;108:797–804. doi: 10.1002/ijc.11663. - DOI - PubMed
    1. De Angeli S., Di Liddo R., Buoro S., Toniolo L., Conconi M.T., Belloni A.S., Parnigotto P.P., Nussdorfer G.G. New immortalized human stromal cell lines enhancing in vitro expansion of cord blood hematopoietic stem cells. Int. J. Mol. Med. 2004;13:363–371. doi: 10.3892/ijmm.13.3.363. - DOI - PubMed
    1. Hay D.L., Walker C.S., Poyner D.R. Adrenomedullin and calcitonin gene-related peptide receptors in endocrine-related cancers: Opportunities and challenges. Endocr. Relat. Cancer. 2011;18:C1–C14. doi: 10.1677/ERC-10-0244. - DOI - PubMed

LinkOut - more resources