

The Cytotoxic Effects of Cannabidiol and Cannabigerol on Glioblastoma Stem Cells May Mostly Involve GPR55 and TRPV1 Signalling
- PMID: 36497400
- PMCID: PMC9738061
- DOI: 10.3390/cancers14235918
The Cytotoxic Effects of Cannabidiol and Cannabigerol on Glioblastoma Stem Cells May Mostly Involve GPR55 and TRPV1 Signalling
Abstract
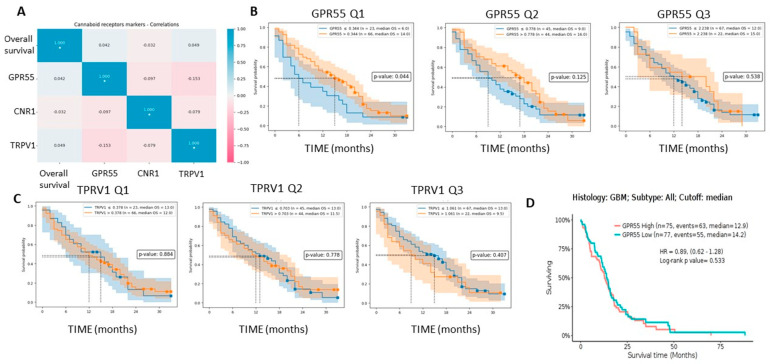
Glioblastoma (GBM) is one of the most aggressive cancers, comprising 60-70% of all gliomas. The large G-protein-coupled receptor family includes cannabinoid receptors CB1, CB2, GPR55, and non-specific ion receptor protein transporters TRPs. First, we found up-regulated CNR1, GPR55, and TRPV1 expression in glioma patient-derived tissue samples and cell lines compared with non-malignant brain samples. CNR1 and GPR55 did not correlate with glioma grade, whereas TRPV1 negatively correlated with grade and positively correlated with longer overall survival. This suggests a tumour-suppressor role of TRPV1. With respect to markers of GBM stem cells, preferred targets of therapy, TRPV1 and GPR55, but not CNR1, strongly correlated with different sets of stemness gene markers: NOTCH, OLIG2, CD9, TRIM28, and TUFM and CD15, SOX2, OCT4, and ID1, respectively. This is in line with the higher expression of TRPV1 and GPR55 genes in GSCs compared with differentiated GBM cells. Second, in a panel of patient-derived GSCs, we found that CBG and CBD exhibited the highest cytotoxicity at a molar ratio of 3:1. We suggest that this mixture should be tested in experimental animals and clinical studies, in which currently used Δ9-tetrahydrocannabinol (THC) is replaced with efficient and non-psychoactive CBG in adjuvant standard-of-care therapy.
Keywords: cannabidiol; cannabigerol; cannabinoid receptors; glioblastoma; glioma; stem cells.
Conflict of interest statement
The authors declared no potential conflict of interest with respect to the research, authorship, and/or publication of this article.
Figures


Similar articles
-
THC Reduces Ki67-Immunoreactive Cells Derived from Human Primary Glioblastoma in a GPR55-Dependent Manner.Cancers (Basel). 2021 Mar 3;13(5):1064. doi: 10.3390/cancers13051064. Cancers (Basel). 2021. PMID: 33802282 Free PMC article.
-
Cannabigerol Is a Potential Therapeutic Agent in a Novel Combined Therapy for Glioblastoma.Cells. 2021 Feb 5;10(2):340. doi: 10.3390/cells10020340. Cells. 2021. PMID: 33562819 Free PMC article.
-
Toxicological properties of Δ9-tetrahydrocannabinol and cannabidiol.Arh Hig Rada Toksikol. 2020 Mar 1;71(1):1-11. doi: 10.2478/aiht-2020-71-3301. Arh Hig Rada Toksikol. 2020. PMID: 32597140 Free PMC article. Review.
-
Cellular distribution of cannabinoid-related receptors TRPV1, PPAR-gamma, GPR55 and GPR3 in the equine cervical dorsal root ganglia.Equine Vet J. 2021 Aug 21;54(4):788-98. doi: 10.1111/evj.13499. Online ahead of print. Equine Vet J. 2021. PMID: 34418142 Free PMC article.
-
GPR55: a new member of the cannabinoid receptor clan?Br J Pharmacol. 2007 Dec;152(7):984-6. doi: 10.1038/sj.bjp.0707464. Epub 2007 Sep 17. Br J Pharmacol. 2007. PMID: 17876300 Free PMC article. Review.
Cited by
-
From bench to bedside: the application of cannabidiol in glioma.J Transl Med. 2024 Jul 11;22(1):648. doi: 10.1186/s12967-024-05477-0. J Transl Med. 2024. PMID: 38987805 Free PMC article. Review.
-
Rare Phytocannabinoids Exert Anti-Inflammatory Effects on Human Keratinocytes via the Endocannabinoid System and MAPK Signaling Pathway.Int J Mol Sci. 2023 Feb 1;24(3):2721. doi: 10.3390/ijms24032721. Int J Mol Sci. 2023. PMID: 36769042 Free PMC article.
-
Cannabidiol effects in stem cells: A systematic review.Biofactors. 2025 Jan-Feb;51(1):e2148. doi: 10.1002/biof.2148. Epub 2024 Dec 9. Biofactors. 2025. PMID: 39653426 Free PMC article.
-
TUFM in health and disease: exploring its multifaceted roles.Front Immunol. 2024 May 29;15:1424385. doi: 10.3389/fimmu.2024.1424385. eCollection 2024. Front Immunol. 2024. PMID: 38868764 Free PMC article. Review.
-
Cannabigerol (CBG): A Comprehensive Review of Its Molecular Mechanisms and Therapeutic Potential.Molecules. 2024 Nov 20;29(22):5471. doi: 10.3390/molecules29225471. Molecules. 2024. PMID: 39598860 Free PMC article. Review.
References
-
- IARC: Home. [(accessed on 25 September 2022)]. Available online: https://www.iarc.who.int/
-
- World Cancer Report—IARC. [(accessed on 25 September 2022)]. Available online: https://www.iarc.who.int/world-cancer-report-content-overview/
-
- Louis D.N., Perry A., Wesseling P., Brat D.J., Cree I.A., Figarella-Branger D., Hawkins C., Ng H.K., Pfister S.M., Reifenberger G., et al. The 2021 WHO Classification of Tumors of the Central Nervous System: A summary. Neuro-Oncology. 2021;23:1231–1251. doi: 10.1093/neuonc/noab106. - DOI - PMC - PubMed
-
- Weller M., van den Bent M., Preusser M., le Rhun E., Tonn J.C., Minniti G., Bendszus M., Balana C., Chinot O., Dirven L., et al. EANO guidelines on the diagnosis and treatment of diffuse gliomas of adulthood. Nat. Rev. Clin. Oncol. 2021;18:170–186. doi: 10.1038/s41571-020-00447-z. - DOI - PMC - PubMed
Grants and funding
LinkOut - more resources
Full Text Sources
Research Materials
Miscellaneous
